THERMOMECHANICAL EVOLUTION OF A MAGMATIC SYSTEM DURING A CALDERA CYCLE: OKATAINA VOLCANIC CENTER, NEW ZEALAND
←
→
Page content transcription
If your browser does not render page correctly, please read the page content below
Michigan Technological University
                                                      Digital Commons @ Michigan Tech

Dissertations, Master's Theses and Master's Reports

2022

THERMOMECHANICAL EVOLUTION OF A MAGMATIC SYSTEM
DURING A CALDERA CYCLE: OKATAINA VOLCANIC CENTER, NEW
ZEALAND
Jacob Bonessi
Michigan Technological University, jmboness@mtu.edu

Copyright 2022 Jacob Bonessi

Recommended Citation
Bonessi, Jacob, "THERMOMECHANICAL EVOLUTION OF A MAGMATIC SYSTEM DURING A CALDERA
CYCLE: OKATAINA VOLCANIC CENTER, NEW ZEALAND", Open Access Master's Thesis, Michigan
Technological University, 2022.
https://doi.org/10.37099/mtu.dc.etdr/1374

Follow this and additional works at: https://digitalcommons.mtu.edu/etdr
   Part of the Geology Commons, and the Volcanology Commons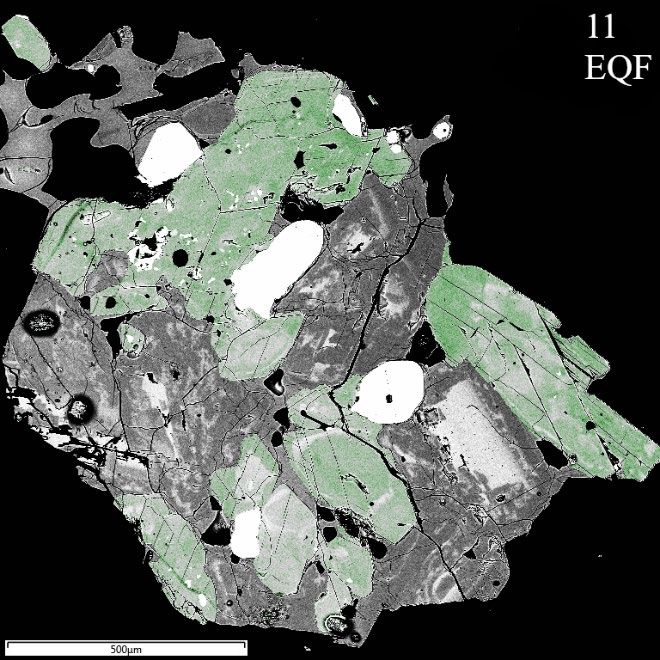
THERMOMECHANICAL EVOLUTION OF A MAGMATIC SYSTEM DURING A
  CALDERA CYCLE: OKATAINA VOLCANIC CENTER, NEW ZEALAND

                                      By

                              Jacob M. Bonessi

                                  A THESIS

     Submitted in partial fulfillment of the requirements for the degree of

                           MASTER OF SCIENCE

                                  In Geology

              MICHIGAN TECHNOLOGICAL UNIVERSITY

                                     2022

                          © 2022 Jacob M. Bonessi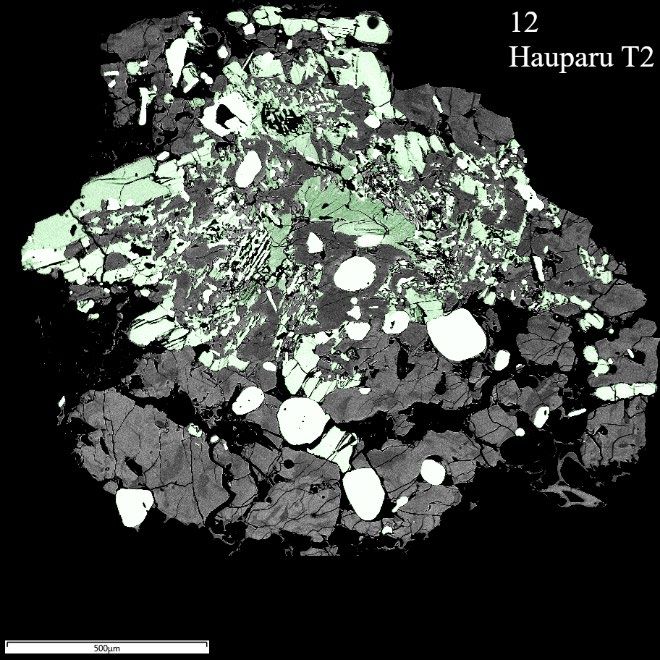
This thesis has been approved in partial fulfillment of the requirements for the Degree of
MASTER OF SCIENCE in Geology.

                         Department of Geological and Mining Engineering and Sciences

                 Thesis Advisor:      Dr. Chad Deering

            Committee Member:         Dr. Greg Waite.

            Committee Member:         Dr. Adam Kent

              Department Chair:       Dr. Aleksey Smirnov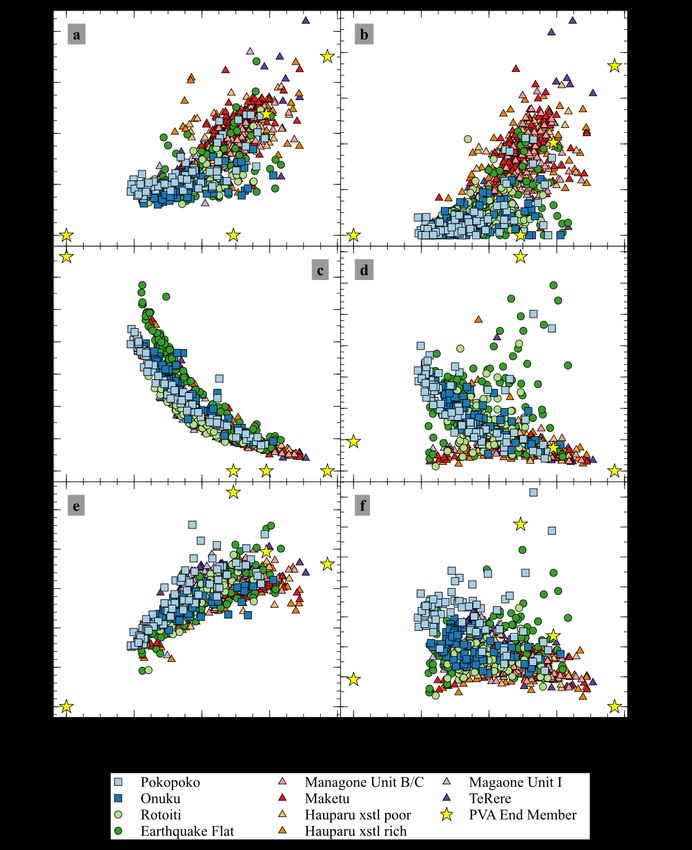
Table of Contents

List of Figures ......................................................................................................................v

List of Tables ..................................................................................................................... vi

Acknowledgements ........................................................................................................... vii

Abstract ............................................................................................................................ viii

1       Introduction .................................................................................................................1

2       Geologic setting ..........................................................................................................3
        2.1 OVC eruptive history .......................................................................................5

3       Methods.....................................................................................................................10
        3.1 Sample preparation .........................................................................................10
                  3.1.1        Sample selection criteria ...................................................................10
                  3.1.2        Crushing ............................................................................................10
                  3.1.3        Sieving ..............................................................................................10
                  3.1.4        Winnowing ........................................................................................11
                  3.1.5        Grain selection and mounting ...........................................................11
        3.2       Mineral textural characterization....................................................................12
                  3.2.1        Environmental scanning electron microscope (SEM) imaging ........12
                  3.2.2        Grain and spot selection ....................................................................12
        3.3       Geochemical analytical methods ....................................................................13
                  3.3.1        Microprobe major element analysis ..................................................13
                  3.3.2        Laser ablation and inductively coupled plasma mass spectrometry
                  (LA-ICP-MS) .................................................................................................13
        3.4       Modeling Methods using Polytopic Vector Analysis (PVA) .........................14

4       Results .......................................................................................................................16
        4.1 Textural variation of plagioclase ....................................................................16
                  4.1.1        Solid core plagioclase .......................................................................16
                  4.1.2        Glomerocrysts ...................................................................................17

                                                                   iii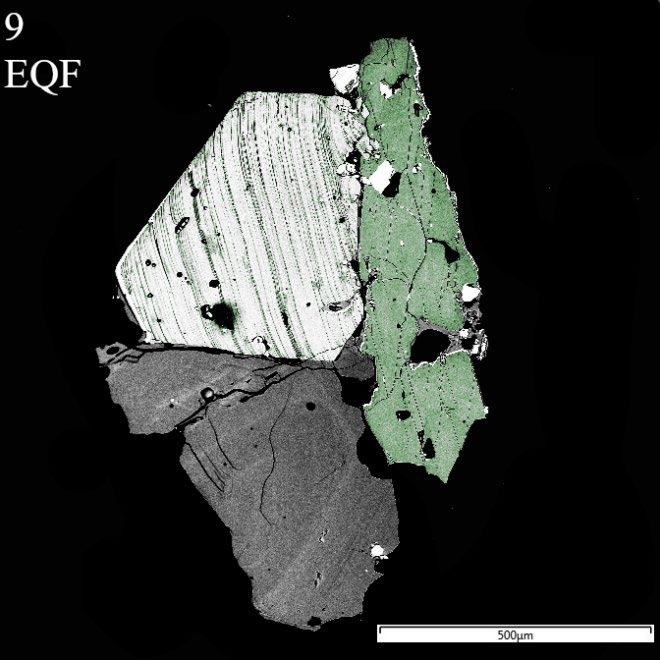
4.2      Major element chemistry ................................................................................18
    4.3      Trace element chemistry ................................................................................19
    4.4      PVA results for OVC .....................................................................................20

5   Discussion .................................................................................................................26
    5.1 The thermo-mechanical evolution at Okataina ..............................................26
             5.1.1        Textures.............................................................................................27
             5.1.2        Geochemistry ....................................................................................29
             5.1.3        PVA...................................................................................................30
    5.2      Pre-caldera magmatic system characteristics .................................................31
    5.3      Syn-caldera magmatic system characteristics ................................................32
    5.4      Post-caldera magmatic system characteristics ...............................................34

6   Conclusions ...............................................................................................................42

7   References .................................................................................................................45

                                                             iv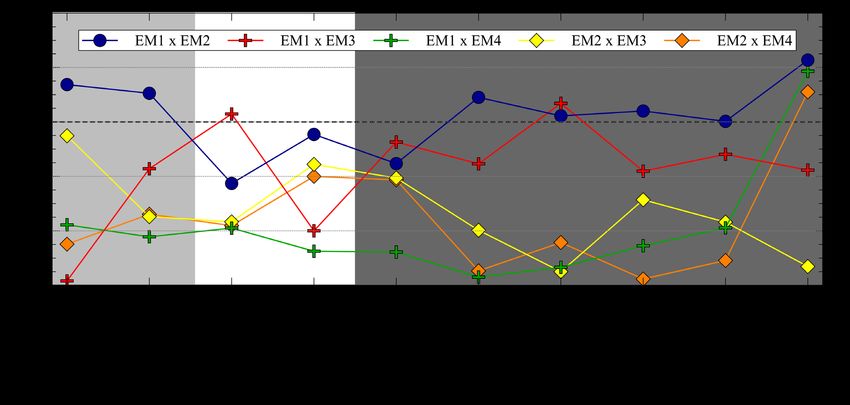
List of Figures
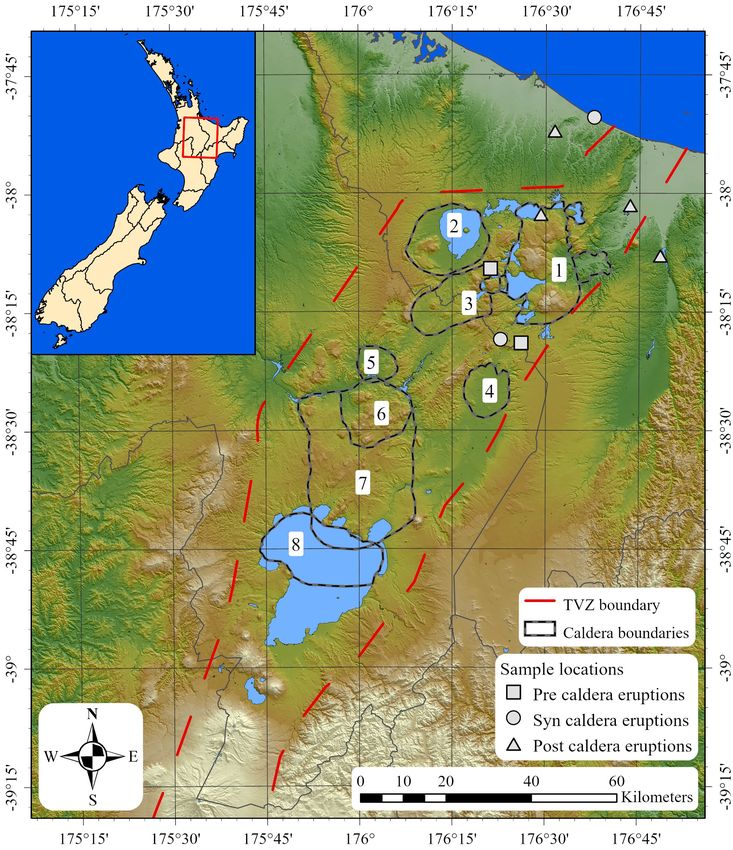
Figure 2.1: Map of the modern TVZ and associated historic caldera complexes modified
from (Cole & Spinks, 2009; Nairn, 2002; Spinks et al., 2005). Caldera names (1:
Okataina, 2: Rotorua, 3: Kapenga, 4: Reporoa, 5: Ohakuri, 6. Moroa, 7.
Whakamaru, 8. Taupo). Distal and proximal deposits from eruptions sourced from
OVC magmatism were sampled. .............................................................................4
Figure 4.1: Textural classification of OVC plagioclase. Glomerocrysts textures are based
solely on plagioclase characteristics. False color images for glomerocryst grains
are provided to differentiate between plagioclase (shades of grey) and other
accessory minerals (shades of green or pure white). .............................................22
Figure 4.2: a-f: Bivariate plot matrix of major and trace element chemistry results for
OVC plagioclase. Anorthite content is the common x-axis for all six plots..........25
Figure 5.1: Diagram demonstrating different types of hybridization that can occur during
an intrusion of mafic magma into a silicic system that is variably crystallized. 1.
Mixing, 2. Mingling, 3. Filling of early fractures (composite dikes), 4. Filling of
fractures (mafic dikes) Adapted from (Barbarin & Didier, 1992). ........................39
Figure 5.2 a &b: Median end-member composition for each eruption. EM contribution
box plots for each eruption. Whiskers calculated using 1.5IQR method...............40
Figure 5.3: Correlation coefficient diagram for eruptions through the most recent caldera
cycle at OVC. Light gray shading encompasses pre-caldera eruptions (Pokopoko
and Onuku), white include syn-caldera eruptions (Rotoiti and Earthquake Flat)
and dark grey represent post-caldera eruptions (Mangaone Unit B/C through
TeRere ....................................................................................................................41
Figure 6.1 Conceptual cross section of OVC illustrating changes of thermomechanical
state its during most recent caldera forming cycle. White stippled region
represents crystalized rock, grey stippled indicates mush zones. Not drawn to
scale........................................................................................................................44
v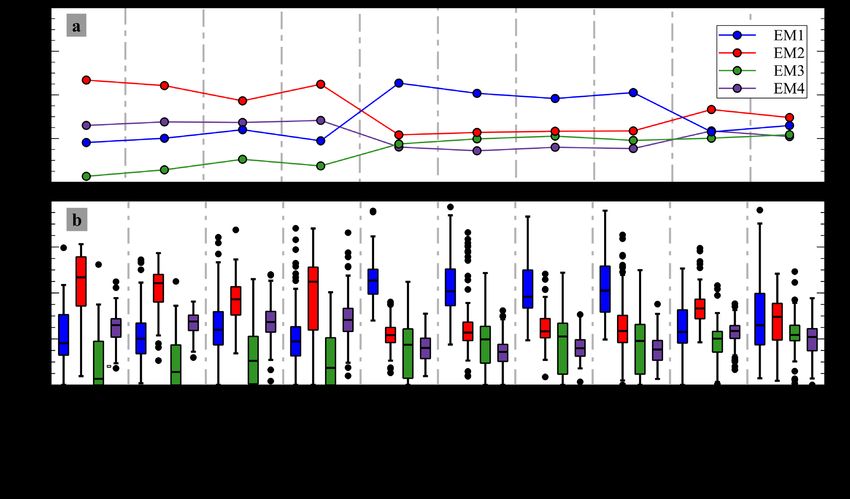
List of Tables
Table 2.1 Simplified stratigraphy of OVC eruptive products. Ages: (1: Danišík et al.,
       2020; 2: Lowe et al., 1998) Volumes (Cole et al., 2014; Manning, 1996; Nairn,
       2002) ........................................................................................................................8

Table 2.2: Approximate crystal content and dominant mineralogy for eruptions selected
       for this study. ...........................................................................................................9

Table 4.2: Average plagioclase composition (n = number of analyses) for each eruption in
       OVC caldera forming cycle. Major elements are provided in wt%. Trace elements
       are provided in parts per million (ppm) concentration. .........................................23

Table 4.3: Composition of each member of a 4 EM solution. Major element
       concentrations are in wt%, trace element concentrations in ppm. .........................24

Table 5.1: Partition coefficient values for trace elements in major mineral phases present
       in Okataina Volcanic Center. Adapted from Rollinson (1993). Darker cells
       correspond with higher Kd values. Ref 1: (Table 3: Arth, 1976) Ref 2: (Tables 8-
       11: Nash & Crecraft, 1985) ....................................................................................38

Table 5.2: Correlation coefficient values calculated for mixing relationships between end-
       members contributions from PVA results. Darker values correspond with higher
       correlation coefficient values. ................................................................................38

                                                               vi
Acknowledgements
I would like to thank Dr. Chad Deering for the work that he does to provide
opportunities for not only me, but also to his clade of students for the duration of their
research projects. The GMES department at MTU is also owed a thank you for their part
in cultivating student opportunities. Thanks to the efforts of Dr. Deering and MTU
GMES, my experience during the completion of the degree has provided me with a rich
experience that was undoubtedly well worth the effort.
Thank you, Dr. Greg Waite, for agreeing to be on my committee in short notice.
I would also like to thank several people at Oregon State University that helped
me along during my data collection marathon. Dr. Adam Kent, thanks for being a part of
the project and getting me in touch with Dr. Frank Tepley and Dr. Chris Russo, who both
helped immensely during my time in the labs at OSU.
viiAbstract
Caldera forming eruptions represent some of the largest simultaneous releases of mass and
energy on the planet and pose a looming risk on a global scale. The study of the underlying
magmatic systems is integral in understanding what leads to these large eruptions. This
approach pairs a suite of major and trace element profiles from plagioclase with a grain
texture classification and statistical analysis using Polytopic Vector Analysis (PVA) as
proxies to explore potential changes in the thermomechanical state of the magmatic system
at Okataina Volcanic Complex (OVC), New Zealand through its most recent caldera cycle.
Results indicate systematic changes in plagioclase chemistry and textures that are
highlighted by: 1) pre-caldera crystals that are compositionally evolved yet primarily fed
by a mafic chemical end-member, 2) syn-caldera crystals that are compositionally
heterogenous yet texturally restricted, and 3) post-caldera crystals that are initially
texturally broad and least evolved but migrate towards pre/post compositions and textures
by the end of the analyzed samples. Paired with the contributions of the four distinct
geochemical end-members generated using PVA, it is suggested that OVC was primarily
in a “cold storage” state during the pre- and post-caldera timeframe, while a “warm”
storage scenario best describes the state of the system during the building of the syn-caldera
eruptions.
viii1 Introduction
Volcanic systems that have produced caldera forming eruptions are a topic of continued
interest in geologic investigations (e.g., Bailey et al., 1976; Cole et al., 2010; Sawyer et al.,
1994; Wilson et al., 1984). Caldera forming eruptions, although rare, have the potential to
wreak havoc at a scale not seen in the modern era of human history. Due to the inherent
risk posed to local areas by these catastrophic eruptions, the understanding of these systems
is of paramount importance.
The Taupo Volcanic Zone (TVZ), located on the North Island of New Zealand, is the one
of the most active Quaternary silicic system in the world and is characterized by small scale
rhyolitic volcanism punctuated by large scale caldera forming eruptions (Houghton et al.,
1995). Due to the longevity and recent nature of the volcanic activity at the TVZ, the
extensive exposure of volcanic stratigraphy provides a unique opportunity to study the
chronologic evolution a magmatic complex that has generated over 30 caldera forming
eruptions since its inception 1.6 Ma (Wilson et al., 1995).
Zoned plagioclase crystals are ubiquitous in the entire range of volcanic rocks generated in
the TVZ. Due to the prevalence of plagioclase in the rocks produced here, it serves as a
useful metric when probing the conditions of the magmatic system during the residence of
the crystals. Magmatic plagioclase, although stable in a broad range of temperatures and
pressures, can take many forms as it is sensitive to changes in environmental parameters in
the melt (e.g., Nixon & Pearce, 1987; Smith et al., 2010; Tepley et al., 1999). The history
of each plagioclase crystal is recorded as growth occurs outwardly in layers during
favorable environmental conditions. The mineral can also record periods of dissolution, or
erosion, during unfavorable conditions. The compositions of the growth layers, or zones,
primarily depends on the temperature and composition of the melt. Investigations of the
textural characteristics and chemical compositions of zonation in plagioclase have been
widely used to gain insight on conditions of the magmatic system from which the crystals
were produced and often invoke processes such as magma mixing, fractional
crystallization, and convective stirring to explain the chemical and optical variations in
1zoning patterns (e.g.: Ginibre, Wörner, et al., 2002; Nixon & Pearce, 1987; Pearce et al.,
1987; Shane, 2015).
Although the paring of qualitative textural analysis with geochemical analysis often
provides sufficient evidence to interpret magmatic conditions, multivariate statistical
methods are occasionally summoned to aid in highlighting fine details in geochemical
datasets (e.g.: Brandmeier & Wörner, 2016; Pitcher & Kent, 2019; Tefend et al., 2007;
Vogel et al., 2008). A select multivariate method, Polytopic Vector Analysis (PVA), not
only attempts to discern the number of end-members (EM) in a magmatic system, but also
the composition of each EM and the proportion of each in the individual dataset entries
(Deering et al., 2008; Szymanski et al., 2013; Vogel et al., 2008). Although this method
has traditionally been used with whole rock datasets, several studies applied PVA in
mineral studies (e.g.: Apatite; Lisowiec et al., 2015, Plagioclase; Słaby et al., 2017)
In this study, we combine textural, geochemical, and statistical analysis of plagioclase from
eruptions that bracket the most recent caldera forming eruption derived from the Okataina
Volcanic Center (OVC) in the TVZ. This approach is used to demonstrate the fundamental
changes in the magmatic system at a volcanic center through an entire caldera cycle, i.e.
pre, syn and post-caldera. The novel approach of using PVA on magmatic plagioclase from
a large silicic volcanic center supports evidence of systematic changes in of the magmatic
system through time.
22 Geologic setting
Okataina Volcanic Center is a caldera complex located in the North Island of New Zealand.
It is one of eight volcanic centers that occurs in the Taupo Volcanic Zone, a NW trending
rifting volcanic arc (Figure 2.1). The volcanic arc is influenced by the oblique convergence
of the oceanic Pacific Plate with the continental Australian Plate. The rate of subduction
decreases towards the transition to a transform boundary in the South Island (Clark et al.,
2019). The asymmetric ~20ִ° convergence along the NE – SW trending Hikurangi
subduction margin generates rifting between the eastern limb and main body of the North
Island. The resulting thinning of the crust from active rifting has been accompanied by
upwellings of subduction derived fluids which promote significant partial melting of the
mantle wedge, which feeds the upper crustal magmatic systems in the TVZ (Deering et al.,
2008; Rooney & Deering, 2014).
The culmination of crustal thinning and active magmatism has produced extensive volcanic
activity in the TVZ. The southern and northern extents (Mt. Ruapehu and White Island
respectively) have predominantly intermediate composition volcanism, while rhyolite
production has been focused in the central TVZ. Rhyolite production has varied temporally
and spatially throughout the history of the TVZ (Wilson et al., 1995).
The Okataina segment of the TVZ rift is characterized by a high degree of extension and
voluminous volcanic activity (Spinks et al., 2005). The volcanic activity at this caldera
complex is characterized by intermittent infilling eruptions of small to moderate volume (5
– 15km3). Periodically, large (>100 km3) rhyolitic eruptions have occurred and drastically
reshaped the structure and geography of the OVC. The complex is currently subdivided
into the northern Haroharo Volcanic Complex (HVC) and southern Tarawera Volcanic
Complex (TVC).
3Figure 2.1: Map of the modern TVZ and associated historic caldera complexes modified
from (Cole & Spinks, 2009; Nairn, 2002; Spinks et al., 2005). Caldera names (1:
Okataina, 2: Rotorua, 3: Kapenga, 4: Reporoa, 5: Ohakuri, 6. Moroa, 7. Whakamaru, 8.
Taupo). Distal and proximal deposits from eruptions sourced from OVC magmatism
were sampled.
42.1 OVC eruptive history
The volcanic evolution at Okataina has been reported in previous studies (see Cole et al.,
2010 for eruptive history) and a simplified version is reported here (Table 2.1). Volcanic
activity in the OVC may have commenced around 650 ka based on distal tephra that
contains cummingtonite, which is a rare mineral assemblage only found in OVC rhyolites
(Ewart, 1971; Manning, 1996). Since the onset of volcanism in the OVC, intermittent
activity has been punctuated by caldera forming eruptions. The OVC has had three
significant caldera collapse events during its ~650 ka history: 1) Quartz-biotite (~550 ka),
2) Matahina (~325 ka), and 3) Rotoiti (~45 ka) (Bailey & Carr, 1994; Danišík et al., 2012;
Nairn, 2002). During the interim between caldera forming eruptions, smaller and more
frequent events occurred within and on the flanks of the OVC caldera complex.
During the previous 350 ka, Okataina has erupted over 350 km3 of magma (Cole et al.,
2010; V. C. Smith et al., 2005). Following the Matahina event, the preserved temporal
distribution of OVC eruptions is highly skewed, with 18 of 21 eruptions occurring between
325ka – 240ka. The Onuku and Pokopoko Pyroclastics occurred during this active post-
caldera volcanism. Onuku eruptions produced multiple pyroclastic and non-welded flow
deposits that occur to the south and east of OVC and form contacts between the older
Matahina Ignimbrite and younger 240 ka Kaingaroa Ignimbrite (Reporoa Caldera source).
At least six individual eruptions, separated by paleosols, have been assigned this
pyroclastic subgroup. The pyroclastic and fall deposits from the Pokopoko eruptions occur
at the western margin of the OVC and are overlain by the Mamaku Ignimbrite (240 ka;
Rotorua Caldera source) (Nairn, 2002). Vents for these eruptions are poorly constrained,
as with all OVC sourced eruptions that preceded the Rotoiti event.
A perceived dearth of activity between 240 – 45ka was interrupted by the Rotoiti event,
the most recent caldera forming event at Okataina. Evidence from mingled pumice and
mineralogy and geochemical signatures suggest a link between the eruptive products of the
late stage Rotoiti event and the Earthquake Flat event. The Earthquake Flat eruption
occurred southwest of the Rotoiti eruptions along a series of NW trending vents shortly
5after the continuous Rotoiti eruptive phase that produced > 100 km3 of magmatic
equivalent (Molloy et al., 2008). Earthquake Flat was an order of magnitude smaller than
the Rotoiti event, and produced ~10 km3 (Nairn, 2002).
Intracaldera volcanism defined the activity at Okataina following the caldera collapse of
the Rotoiti event. The Mangaone Subgroup, which lies between the Rotoiti deposits and
the Taupo sourced Oruanui deposit (26.5ka), is comprised of at least twelve individual
Plinian fall deposits (Unit A – Unit L). The oldest Mangaone eruptive products following
Rotoiti are characterized by low SiO2 rhyodacites. Eruptions during the younger Mangaone
sequence are characterized by a return to high SiO2 rhyolites (Smith et al., 2002) The
locations of Mangaone vents are not well constrained due to limited exposure, but most
eruptions likely occurred west of the Puhipuhi embayment or along a N-S trend between
the HVC and TVC (Figure 2.2; Jurado-chichay & Walker, 2000).
Following the 26.5ka Oruanui episode from TVC, intracaldera eruptions continued to
define the activity in OVC. Eruptions within the OVC during the last 26.5ka consist of at
least nine separate rhyolitic eruptions and several accompanying minor basaltic eruptions.
These eruptions occurred in the northern Haroharo and southern Tarawera linear vent
zones. These linear vent zones, which both trend NE, are roughly parallel to the
predominant structural fabric of the TVZ (Nairn, 1989). Of the >80 km3 of magma that
was erupted during this period, the Haroharo vents have produced the volumetric majority
and more frequent eruptions. The most recent eruption from OVC came from Tarawera
however. The 21ka TeRere eruptive episode is the oldest event that can be attributed to the
post 26.5ka sequence of rhyolites from OVC and is represented by ash fall and lava flows
that were produced along a long stretch of the Haraharo vent zone (Figure 2.2). Eruptions
after the TeRere episode occurred at 1.5-5 ka intervals and occurred from multiple vents
along the respective linear vents zones (Smith et al., 2005). The Kaharoa eruption (age:
665 ± 15 BP) the most recent rhyolitic eruption at OVC (Lowe et al., 1998). Although
basaltic eruptions represent a volumetric minority in the OVC and TVZ, the historic
Tarawera sourced eruption in 1886 AD was induced by a series of basaltic dike intrusions
6and subsequent eruptions from a 17 km long rift that formed during the event (Nairn &
Cole, 1981).
7Table 2.1 Simplified stratigraphy of OVC eruptive products. Ages: (1: Danišík et al.,
2020; 2: Lowe et al., 1998) Volumes (Cole et al., 2014; Manning, 1996; Nairn, 2002)
Caldera
Group Name Age (ka) Volume (DRE)
Produced
Quartz-biotite 550 90 km3 Yes
Murupara/Bonisch
340-325 30 km3 No
Pyroclastic Subgroup
Matahina 325 160 km3 Yes
Onuku/Pokopoko 325-240 20 km 3
No
Te Wairoa Pyroclastics 1 km3 No
Rotoiti / Earthquake Flat 45 100 km3 / 10 km3 Yes
Unit A 42.7 1
Unit B (Ngamotu) 39.61
Unit C 37.7-36.61
Unit D (Maketu) 36.11
Unit E (Te Mahoe) 35.61
Mangaone
Unit F (Hauparu) 35.21
Pyroclastic 22 km3 No
Unit G 33.81
Subgroup
Unit H 31.81
Unit I (Mangaone) 31.11
Unit J (Awakeri) 31.01
Unit K 30.81
Unit L 30.61
TeRere 25.22 13 No
Okareka 21.82 8 No
Rerewhakaaitu 17.62 5 No
Rotorua 15.4 2
4 No
Waiohau 13.6 2
11 No
Post 26 ka
Rotoma 9.52 8 No
Mamaku 8.0 2
17.5 No
Whakatane 5.5 2
13 No
Kaharo 1314 AD2 5 No
Tarawera June 10 1886 2
0.7 No
8Table 2.2: Approximate crystal content and dominant mineralogy for eruptions selected
for this study.
Eruption name Crystal Mineralogy
content (%)
Pokopoko 15 plag, opx, hbl, Fe-Ti ox
Onuku 10 plag, opx, hbl, Fe-Ti ox
Rotoiti 20 qtz, plag, hbl, opx, Fe-Ti ox
Earthquake Flat 40 qtz, plag, hbl, opx, bio, Fe-Ti ox
Mangaone Unit B/C 5 plag, hbl, opx, cpx, Fe-Ti ox
Mangaone Unit D (Maketu) 5 plag, hbl, opx, cpx, Fe-Ti ox
Mangaone Unit F (Hauparu xstl poor) 5 plag, opx, cpx, Fe-Ti ox
Mangaone Unit F (Hauparu xstl rich) 15 plag, hbl, opx, cpx, Fe-Ti ox
Mangaone Unit I (Mangaone) 5 qtz, plag, hbl, opx, Fe-Ti ox
TeRere 15 qtz, plag, hbl, opx, Fe-Ti ox
93 Methods
3.1 Sample preparation
3.1.1 Sample selection criteria
Pumice samples from ten separate OVC eruptions were used in this study (Table 2.2). The
samples were selected to represent eruptions that span a caldera forming cycle. Pumice
clasts for this study were first cleaned with water and a nylon brush to remove dirt and
debris. After surficial scrubbings, the pumice clasts were placed in an oven at 80 °C for 24
hours to dry. Once dried, individual pumice clasts from each eruption were selected to be
crushed based on the condition of glass. Pumice clasts that exhibited discoloration that
varied between the rind and interior were discarded in favor of pumice clasts that appeared
to be unaffected by post emplacement alteration.
3.1.2 Crushing
Initial attempts to crush the sample were attempted via ceramic mortar and pestle. This
method proved to be time consuming, and often resulted in over crushing of the sample.
Alternatively, the pumice clasts were coarse crushed with a Lemaire Instruments Model
150 tabletop jaw crusher. The minimum width of the gap at the bottom of the jaw crusher
was approximately 5mm, which prevented excessive crushing of the pumice samples and
maximizes crystal yield from encapsulating pumice.
3.1.3 Sieving
Coarse crushed samples were placed in a nested set of brass sieves with opening sizes of
2.36, 1.00, 0.60, and 0.25 mm. The stack of sieves was then placed on a Gilson mechanical
sieve shaker and set to 15 minutes of continual oscillation. Sieve products that ranged from
0.25mm were bagged and winnowed to separate crystalline phases from
glassy pumice (e.g.: Gualda, 2007; Skirius et al., 1990)
103.1.4 Winnowing
The winnowing process used to remove glass from crystals involved using a large beaker,
a fine sieve (opening size 0.25mm) and a constant flow of tap water. The material produced
from each sieve was winnowed individually to maintain the size fractions mentioned above
(>2.36mm, 1.00mm, 0.60mm, 0.25mm). After adding
dry sieved sample to the beaker, the beaker was held under a light to moderate flow of tap
water. The beaker was then rocked back and forth above the fine sieve, allowing for low
density glassy pumice to float to the top and pour out into the catchment sieve. After the
bulk of the sample floated out, the water was turned off, and a gentle rocking and tipping
of the beaker allowed for further removal of the material that was composed of a mix of
glass and some mineral material. What remained was a reduced sieve proportion that was
generally >90% mineral phases by volume. The winnowed portion was then drained and
placed in a drying oven at 80 °C for 24 hours.
3.1.5 Grain selection and mounting
The winnowed crystal separates for each eruption were inspected using a binocular
microscope. Crystals for each size fraction were hand-picked with binocular microscope
and fine-tipped tweezers. Notable variations within crystals populations of each eruption
were selected to insure representative sampling of each deposit in this study.
Glomerocrysts, or phenocryst clusters, of mono- or poly- mineralic constitution, were also
selected.
The mineral phases were mounted on 25mm diameter plastic plugs using double sided tape.
The minerals from each eruption were mounted based on size to ensure more consistent
results when the epoxy plugs were ground to a satisfactory depth and subsequently
polished. A two-part epoxy was mixed and poured in the mold for each plug and allowed
to cure for a minimum period of 24 hours at ~21 °C. After the cure, the plugs were removed
from the molds, and ground with a Diamond Pacific flat lap. The coarse grind procedure
stepped through 60-180-320-600 grits to ensure even removal of material. Once the plug
was ground to a point where the majority of the mounted crystals had exposed interiors,
11the plugs were hand polished using adhesive polishing pads and water lubricated diamond
lap paste. A three-step polishing process used 9μ, 6μ, and 1μ. The resulting plug ideally
had mirrored crystal phases with minimal scratches and rounding on the edges of the
crystal.
3.2 Mineral textural characterization
3.2.1 Environmental scanning electron microscope (SEM) imaging
Imaging of plagioclase crystals was completed at the Applied Chemical and Morphological
Analysis Laboratory (ACMAL) at Michigan Technological University using a Philips
XL40 ESEM. Sample plugs were carbon coated to a thickness 250-300 Å prior to
placement in the microscope. Plugs were placed in the sample chamber with conductive
tape used to ground the coated sample surface to the stage to minimize charging.
The backscatter electron (BSE) detector equipped on the ESEM was used to produce
images that elucidated the major elemental zoning patterns in the crystal cross sections
exposed in each plug. An accelerating voltage of 20kV and spot size of 5 were used to
optimize the imaging of the compositional zones and grain edges rather than surface
topography of the grains. The contrast setting for the microscope was increased to a
maximum, and brightness subsequently adjusted to a satisfactory level for each crystal. An
increased dwell time was applied in addition, which resulted in final images with a greater
degree of detail.
3.2.2 Grain and spot selection
Textures and zoning types in crystal populations were used to select grains for geochemical
analysis. Additionally, grain size was considered so that a range of grain sizes produced
from the nested sieves would be used to incorporate minerals that experienced different
stages of growth in the volcanic system.
Analysis locations were mapped on crystals of interest based on the zones present in the
SEM images. Every crystal was given a location for a rim and a core measurement. Interior
12zones were also targeted and selected based on perceived width of the zone and context to
the crystal. Zones less than 50μm across were largely ignored to avoid chemical analyses
of intrazonal regions.
3.3 Geochemical analytical methods
3.3.1 Microprobe major element analysis
Major element analysis was completed at Oregon State University Electron Microprobe
Laboratory in Corvallis, OR. The lab utilizes a Cameca SX-100 Electron Microprobe that
is equipped with five wavelength dispersive spectrometers and high intensity dispersive
crystals for enhanced analysis precision. Analyses on crystal samples were completed
using 15keV accelerating voltage, 10 nA sample current, and 10 μm beam size. The
microprobe was calibrated each day prior to running analyses. Appendix A provides
information relating to procedure and microprobe analyses of the standard as an unknown.
3.3.2 Laser ablation and inductively coupled plasma mass spectrometry
(LA-ICP-MS)
The analysis of plagioclase samples for trace element concentrations were measured using
laser ablation inductively coupled plasma mass spectrometry (LA-ICP-MS) at the W.M.
Keck Collaboratory for Plasma Mass Spectrometry at Oregon State University. Material
was ablated from the plagioclase samples using a Photon Machines Analyte G2 193 ArF
Excimer Laser. The ablation occurred using a 30 μm spot size, repetition rate of 12Hz, and
shot count of 540. Ablation occurred in a He atmosphere and ablated material was carried
to the Thermo Scientific iCAP-RQ ICP-MS using helium as a carrier gas. Trace element
43
data collected was processed using LaserTram Visual Basic software using Ca as the
internal standard isotope and GSE-1G as the calibration standard (see Loewen (2013) for
detailed method using LaserTram software). Results from analysis of secondary calibration
standards (USGS GSE-1G, BHVO-2G and NIST SRM-612) are included in Appendix B.
Accepted values for these standards were acquired from the GeoReM database
(http://georem.mpch-mainz.gwdg.de/).
133.4 Modeling Methods using Polytopic Vector Analysis (PVA)
Polytopic Vector Analysis (PVA) was developed to analyze samples that are mixtures of
two or more compositional end-members (EMs). This multivariate statistical tool evaluates
geochemical datasets and produces an output that provides end-member compositions and
proportions of each for analyses provided in the input dataset. Three parameters are needed
to characterize a mixing system: 1) the number of EMs in the system 2) the composition
of each EM and 3) the relative proportion of the EMs in each sample analysis. Most
commonly used with whole rock compositions in igneous petrology studies (e.g.: Deering
et al., 2008; Tefend et al., 2007; Vogel et al., 2008), recent studies have demonstrated the
utility of this tool in studies with apatite (Lisowiec et al., 2015) and plagioclase (Słaby et
al., 2017).
In order to determine the proportion and composition of each end-member, the
compositional data must be plotted in the confines of a generalized geometric figure called
a polytope. The polytope in PVA solutions contains a vertex for each end-member in the
solution and is thus one less dimension than the number of end-members.
Prior to determining the composition and relative proportion of each EM in the samples
using PVA, the number of EMs must be determined. The VSPACE module in the PVA
package assists in determining an appropriate minimum number of EMs to describe the
mixing relationship. The VSPACE output provides several statistical measures that are
used to determine the number of EMs. The first report of importance is the cumulative
variance explained by an increasing number of eigenvectors in the solution. The number
of eigenvectors in the solution represents the number of vertices in the simplex that
attempts to encapsulate the cloud of data. The cumulative variance values should not be
used as a sole reference for selecting a potential number of end-members but provide a
useful starting point.
An additional criterion useful in selecting the number of end-members is the Klovan /
Miesch Coefficient of Determination (KMCD) (Klovan & Miesch, 1976). The KMCD
represents the ratio between the actual data values from the input dataset and the back-
14calculated values from the PVA module. Support for a given number of EMs is suggested
by KMCD values that approach 1.0 for the analytes (major and trace element
concentrations) in the dataset.
In such exploratory evaluations, a solution for the number of EMs in a system is difficult
to subject to a rule-of-thumb cutoff criteria. For instance, not all analytes in a particular
dataset may be useful for the subject in PVA. This dataset includes compositions of Ni and
Cr in plagioclase. These elements do not occur in plagioclase in a significant fashion and
can be considered less important than trace elements that are preferentially incorporated in
crystal such as Sr and Ba. Although a solution will be created to explain the variance in
less significant analytes, the number of end-members is often much greater than what is
feasible to describe for a single system solution. The importance of selecting a realistic
number of end-members should consider the cumulative variance explained by the
eigenvectors, a KMCD value cutoff of ≥ 0.6 for analytes (see: Lisowiec et al., 2015; Słaby
et al., 2017) and the geologic system that influenced the evolution of the subject. End-
members represent mass contributions from potentially evolving magmas and different
sources alike.
Once an appropriate number of EM is selected, the iterative process of PVA proper
modifies the location of the initial polytope incrementally until all data is encapsulated
within the shape, and mixing ratios are positive (or greater than user defined maximum
negative value for EM proportion). In this study, the maximum allowable negative value
was -0.07. Negative values in successful PVA results that occurred between 0 and -0.07
were set to 0 and proportions were then recalculated to 100%.
154 Results
4.1 Textural variation of plagioclase
Qualitative textural analysis of plagioclase crystals was conducted by categorizing grains
based on patterns of BSE intensity in imaging results. BSE imagery highlights on polished
crystal cross sections the differences in average composition based on atomic number.
Plagioclase forms a continuous solid solution series between Ca and Na rich end-members.
The difference in proportion between Ca (anorthite) and Na (albite) defines the brightness
intensity of the zones in the images. Areas richer in Ca (larger atomic number) appear with
a greater BSE intensity than areas with more Na (smaller atomic number) (Ginibre, Kronz,
et al., 2002). Representative plagioclase images and textures are given in Figure 4.1.
4.1.1 Individual plagioclase grains
Individual plagioclase grains with solid (consistent BSE intensity) cores are found
throughout the caldera cycle and are found in each eruption in this study (Table 4.1; Type
1). Crystals with solid cores and oscillatory rim sequences were the most common texture
type for all eruptions. Rim sequences exhibit both normal and reverse oscillatory growth
patterns. Oscillatory zones, demonstrated by changes in BSE image intensity, vary in
thickness between crystals within each eruption.
Patchy core (inconsistent BSE intensity) plagioclase crystals occur in each eruption in this
study (Table 4.1; Type 2). The proportion of individual grains with patchy cores is highest
in the Rotoiti and Earthquake Flat pumice samples. Cores in these minerals exhibit regions
of high and low BSE intensity within the core region. Rim sequences most commonly show
oscillatory growth in normal and reverse patterns, but also demonstrate considerable
resorption.
Individual grains also demonstrate sieve texture in the cores (Table 4.1; Type 3). This
classification of plagioclase, except for four pre-caldera grains, occurs exclusively after the
Rotoiti and Earthquake Flat eruptions. The sieve core plagioclase exhibit rim sequences
16with normal and reverse oscillatory zoning. Rim sequences are also occasionally
interrupted by grain boundaries that have eroded rim sequences.
4.1.2 Glomerocrysts
Glomerocrysts that contain plagioclase are found in each eruption in this study. The
additional phases found in glomerocrysts varies based on eruption mineralogy (Table 2).
The glomerocrysts are classified here using the predominate texture exhibited in the
plagioclase minerals within the cluster of grains. The same three textures used for
individual plagioclase grains are used to discern plagioclase in glomerocrysts.
Glomerocrysts with solid cored plagioclase (Table 4.1; Type 4) occur in each eruption in
this study, with most of the clusters occurring in pumice from eruptions following the
caldera forming Rotoiti eruption. Plagioclase occurs as the dominant mineral phase in most
glomerocrysts. Glomerocrysts are comprised of clusters that contain one to many
plagioclase grains. Solid core plagioclase crystals are most commonly euhedral in shape
and share irregular boundaries with adjacent or intersecting accessory phases. The presence
of Fe-Ti oxides is ubiquitous among these glomerocrysts. Biotite and amphibole occur as
accessory phases in syn-caldera eruption pumice. Biotite was not found in post-caldera
glomerocrysts with pyroxene as the most common accessory phase in this stage.
Plagioclase grains with patchy cores occur in a similar distribution as solid core plagioclase
in glomerocrysts (Table 4.1; Type 5). Patchy core plagioclase grains were not found in
glomerocrysts from Rotoiti or Mangaone Unit I pumice and were exceedingly rare in all
eruptions except for Earthquake Flat. The Type 5 plagioclase mostly commonly occurs in
glomerocrysts that contain numerous plagioclase grains (> 5) in the cluster and are
accompanied by Fe-Ti oxides and amphibole.
Sieve texture plagioclase occur in glomerocrysts in five of the ten eruptions in this study
(Table 4.1; Type 6). The trend is like those individual sieve grains, where most of the grains
occur in post-caldera eruption pumice. Mangaone Unit B/C and Unit I pumice did not yield
17any glomerocrysts with sieve textured plagioclase. The occurrence of this plagioclase
texture occurs primarily in the Hauparu deposit.
4.2 Major element chemistry
Average element compositions for the OVC plagioclase in this study are listed in Table
4.2. Although ranges in major element composition overlap throughout the eruptions in
this study, systematic changes in average compositions between eruptions are noted.
Complete major element data from electron microprobe analysis provided in Appendix C.
Plagioclase from pre-caldera eruptions (Pokopoko and Onuku) contain the lowest average
anorthite content of all eruption in this study (An32.1 and An35.4 respectively). They ranged
in compositions from An19.0-58.5 and An22.8-61.0 respectively. Plagioclase from Rotoiti and
Earthquake Flat deposits have an average An content that is slightly higher than the
previous eruptions (37.9 and 36.9 respectively). The range of anorthite content for Rotoiti
is slightly restricted compared to previous eruptions and Earthquake Flay (An24.2-57.3).
Earthquake Flat produced a range from An22.1-63.3. Following caldera formation from the
Rotoiti event, plagioclase from early Mangaone Subgroup eruptions exhibit a marked
increase in average An composition. Average anorthite content in Mangaone Unit B/C
(An39.9-67.2) through Hauparu (crystal poor: An32.0-65.8, crystal rich: An22.9-68.8) range from
48.2 to 51.2, with the highest average occurring in Mangaone Unit B/C plagioclase.
Mangaone Unit I plagioclase break from the high An trend, with an average of An39.5 and
a range of An23.4-54.2.
Trends in FeO and MgO (Figure 4.1a, b) exhibit similarities to those seen in anorthite.
System low averages in these elements are seen in pre-caldera plagioclase from Pokopoko
and Onuku. Syn-caldera plagioclase demonstrate an adherence to pre-caldera trends, with
average concentrations leveling off during the syn-caldera events. Following caldera
formation, the onset of volcanism in the early Mangaone Subgroup produced plagioclase
with high averages FeO and MgO content. Although Maketu through Hauparu have high
averages in these elements, they also produced analyses with low concentrations like those
18found in sieve plagioclase glomerocrysts. The trend towards pre / syn-caldera plagioclase
is observed in Mangaone Unit I and TeRere in respect to FeO and MgO content.
K2O content in these plagioclase changes in a fashion unlike other major element analytes
(Figure 4.1c). A systematic decrease in average K2O is seen from pre-caldera plagioclase
to Rotoiti. The range in K2O content in Rotoiti plagioclase is restricted compared to
pre/syn-caldera plagioclase (0.12 – 0.49 wt%), while Earthquake Flat plagioclase exhibit a
large range of K2O content (0.11 to 0.94 wt%) and the highest average K2O composition
out of all eruptions in this study (0.47 wt%). A drop in average K2O composition occurs
following caldera formation (Mangaone Unit B/C average K2O wt% = 0.16) and is
followed by a gradual increase through the remainder of the Mangaone Subgroup
(Mangaone Unit I average K2O wt% = 0.27). Maketu, Hauparu crystal rich, and Unit I all
contain several plagioclase analyses enriched in K2O (greater than 0.5 wt%) that overlap
with Earthquake Flat and pre-caldera plagioclase.
4.3 Trace element chemistry
Trace element concentrations exhibit differing evolutionary patterns through the caldera
forming cycle (Table 4.2, Appendix D). An enrichment of Ba in plagioclase occurs in
eruptions through pre and syn-caldera eruptions. Beginning with Mangaone Unit B/C,
plagioclase predominately demonstrate a depletion in Ba concentration (Figure 4.2d). It is
important to note that there is some compositional overlap in respect to Ba between pre
and post-caldera eruptions. There is also a clear divergence in respect to Ba vs. An content.
Pre and to an extent syn-caldera plagioclase occurred along a low An / high Ba to high An
/ low Ba trend. Early post-caldera plagioclase chemistry shows a flat slope trend from high
An / low Ba to low An / low Ba. Late post-caldera plagioclase chemistry adheres to a trend
more similar to pre-caldera plagioclase. The opposite trend is exhibited in respect to Sr
concentrations. Pre and syn-caldera forming eruptions show more heterogeneity and are
more depleted on average than post-caldera eruptions in the Mangaone Subgroup and
TeRere (Figure 4.2e)
19Yttrium concentrations gradually increase from pre-caldera eruptions through the early
Mangaone Subgroup until Maketu where concentrations stabilize between 0.25 and 0.5
ppm, with Mangaone Unit I and TeRere settling slightly on average towards Mangaone
Unit B/C Y compositions. Apart from two analyses from Rotoiti, a population of zones
from post-caldera plagioclase (n=21) have high Y concentration (Y > 1ppm).
The change in Eu through time in OVC plagioclase demonstrates a trend that closely
mirrors the changes in Ba (Figure 4.1f). Mean Eu concentrations decrease from Pokopoko
through Rotoiti (Pokopoko: 3.11 ppm, Onuku: 1.98 ppm, Rotoiti:1.57ppm). Earthquake
Flat interrupts the depletion trend temporarily with a large range of Eu with a mean
concentration of 2.03 ppm. Mangaone Subgroup Eu characteristic changes abruptly at
Mangaone Unit I. Early Mangaone plagioclase (Unit B/C – Hauparu) occur in a narrow
range of concentrations, with averages between 1.25 – 1.57 ppm. Mangaone Unit I and
TeRere show enriched Eu behavior with both averages occurring above 2 ppm.
Light Rare Earth Elements (LREE; La, Ce, Pr) exhibit trends of systematic increase from
Pokopoko to Earthquake Flat. The range of compositions through this sequence of
eruptions generally increase as the eruptions occurred, with Earthquake Flat exhibiting the
largest heterogeneity in LREE. With a range of La between 1.97 – 19.6 ppm, Earthquake
Flat plagioclase nearly contains the entire compositional range of OVC plagioclase in
respect to La. Compositional range is strictly reduced in the Mangaone Subgroup with the
slight exception of Hauparu crystal rich, which resembles pre-caldera heterogeneity, but
with a lower average LREE composition in line with Mangaone Subgroup plagioclase.
LREE trends show an uptick in enrichment in Mangaone Unit I and TeRere plagioclase,
which is also seen with MREE such as Eu.
4.4 PVA results for OVC
The PVA module generates several outputs that aids in determining an appropriate number
of end-members to explain the sample population (Appendix E). Cumulative variance
values of 95% and 98% occurred at four end-members and eight end-members respectively
for this dataset. KMCD values for each analyte at a given number of end-members can be
20viewed similarly to the r2 values used in regression analysis. An arbitrary lower limit of 0.6
is used here but has been assigned lower values such as 0.4 (Szymanski et al., 2013). Of
the 23 analytes used in the PVA dataset, 16 have at least a minimum value of 0.6 at four
end-members while 19 surpass the lower limit at eight end-members. The number of
analytes with a value greater than or equal to 0.8 is reduced to ten for a four end-member
solution, and seventeen for an eight end-member solution.
A four end-member solution was selected to represent the minimum number of end-
members required to explain the chemical variation in this plagioclase population. A four-
end-member solution produced a high cumulative variance value (>95) and a minimum
acceptable KMCD value (0.6) for the majority of high importance elements. Although
solutions with additional end-members do produce higher KMCD values for analytes, the
resulting compositions of the end-members in these solutions become unrealistic and
redundant. The compositions of the four end-members are provided in Table 4.5. The four
end-member solution produced one high, one low, and two intermediate compositions
based on calculated anorthite content. EM1 (An77) is enriched in FeO and MgO and
contains a depleted trace element profile, but shows moderate concentrations of Sc, Cr, Ni,
Sr, and Y. EM2 (An0) has the most depleted trace element profile out of the four end-
members, with only a slight Ba concentration. EM3 and EM4 are characterized by
moderate anorthite contents (An59 and An49 respectively). EM3 is moderately enriched
in FeO and MgO and is characterized by moderate enrichments in the trace elements. This
EM contains a relative e enrichment of Y (0.981 ppm). EM4 is depleted in FeO and MgO
but contains an enriched trace element profile. Besides Ni, Y, and Gd, EM4 contains the
highest concentration of all trace elements in the PVA results. Contributions from each
end-member for the samples in the dataset are provided in Appendix E.
211; Solid core and oscillatory rim sequence 2; Patchy core and oscillatory rim sequence 3; Sieve core and oscillatory rim sequence
22
4; Solid core plagioclase in glomerocryst 5; Patchy core plagioclase in glomerocryst 6; Sieve plagioclase in glomerocryst
Figure 4.1: Textural classification of OVC plagioclase. Glomerocrysts textures are based solely on plagioclase characteristics.
False color images for glomerocryst grains are provided to differentiate between plagioclase (shades of grey) and other
accessory minerals (shades of green or pure white).Earthquake Mangaone Hauparu Hauparu Mangaone
Eruption Pokopoko Onuku Rotoiti Flat Unit B/C Maketu xstl poor xstl rich Unit I TeRere
n= 88 77 149 127 87 140 123 137 77 79
SiO2 60.311 59.581 58.954 59.226 55.707 56.489 56.371 56.454 58.537 57.345
Al2O3 24.849 25.432 25.837 25.618 27.810 27.359 27.336 27.383 26.051 26.714
TiO2 0.011 0.008 0.009 0.011 0.019 0.023 0.021 0.020 0.012 0.018
FeO 0.231 0.189 0.215 0.236 0.377 0.401 0.388 0.391 0.268 0.341
MgO 0.007 0.006 0.009 0.010 0.032 0.033 0.033 0.031 0.012 0.025
CaO 6.454 7.101 7.613 7.420 10.247 9.714 9.691 9.654 7.920 8.898
K2O 0.454 0.420 0.284 0.479 0.163 0.211 0.207 0.227 0.275 0.226
Na2O 7.220 6.883 6.686 6.664 5.284 5.561 5.549 5.570 6.510 5.989
Sc 6.717 6.171 6.742 7.798 5.225 6.362 6.355 6.177 6.302 5.123
Cr 0.957 1.058 1.057 0.993 1.054 1.083 1.115 1.003 0.870 1.030
Ni 0.034 0.074 0.057 0.066 0.073 0.091 0.113 0.096 0.067 0.067
23
Rb 0.744 0.615 0.440 0.974 0.359 0.262 0.345 0.438 0.404 0.682
Sr 638.700 630.888 668.548 632.303 790.962 752.417 751.920 718.602 744.791 797.336
Y 0.270 0.265 0.299 0.304 0.398 0.435 0.438 0.443 0.393 0.470
Ba 530.105 450.408 377.824 570.374 178.553 180.167 209.614 201.989 276.788 267.097
La 6.580 7.567 7.566 9.301 4.372 4.123 4.700 4.392 6.004 5.777
Ce 8.635 9.621 10.223 11.999 6.585 6.369 7.094 6.665 8.865 8.419
Pr 0.756 0.804 0.863 0.965 0.641 0.629 0.689 0.643 0.816 0.793
Pm 0.551 0.545 0.586 0.626 0.504 0.512 0.542 0.498 0.620 0.613
Nd 2.402 2.411 2.594 2.812 2.181 2.225 2.414 2.240 2.688 2.666
Sm 0.211 0.221 0.218 0.218 0.240 0.264 0.254 0.246 0.272 0.276
Eu 3.111 1.985 1.574 2.032 1.252 1.443 1.558 1.338 2.080 2.061
Gd 0.096 0.088 0.111 0.110 0.138 0.163 0.163 0.155 0.166 0.200
Table 4.1: Average plagioclase composition (n = number of analyses) for each eruption in OVC caldera forming cycle. Major
elements are provided in wt%. Trace elements are provided in parts per million (ppm) concentration. See Appendix C and D for
complete major and trace element tabulations.Table 4.2: Composition of each member of a 4 EM solution. Major element
concentrations are in wt%, trace element concentrations in ppm.
Analyte EM 1 EM 2 EM 3 EM 4
SiO2 49.00 70.60 53.70 55.30
Al2O3 32.00 16.90 29.20 28.50
TiO2 0.05 0.00 0.03 0.00
FeO 0.70 0.00 0.48 0.00
MgO 0.07 0.00 0.04 0.00
CaO 15.50 0.00 11.90 10.10
K2O 0.00 1.22 0.00 0.00
Na2O 2.55 11.30 4.57 5.74
Anorthite 0.77 0 0.59 0.49
Albite 0.23 0.93 0.41 0.51
Orthoclase 0 0.07 0 0
Sc 4.57 0 5.14 20.5
Cr 1.24 0.0735 0.908 2.19
Ni 0.161 0.0415 0.158 0
Rb 0 0.152 0.879 2.4
Sr 904 0 983 1360
Y 0.385 0 0.981 0.56
Ba 0 234 184 1710
La 0 0.507 6.79 30.6
Ce 0 0 11.5 38.6
Pr 0 0 1.18 3.05
Pm 0.0274 0 0.991 1.97
Nd 0.272 0 4.22 8.71
Sm 0.13 0 0.572 0.613
Eu 0 0.906 2.36 6.09
Gd 0 0.0159 0.925 0
24Figure 4.2: a-f: Bivariate plot matrix of major and trace element chemistry results for
OVC plagioclase. Anorthite content is the common x-axis for all six plots.
255 Discussion
Some of the largest calderas on Earth have formed in arc volcanic settings (e.g., Best et al.,
2016; Hughes & Mahood, 2008; Melnick et al., 2006). Calderas are formed by the
evacuation of large volumes of silicic magma that was assembled and stored in an upper
crustal reservoir. These large eruptions clearly pose a significant threat to modern society,
therefore, determining the conditions and signs that precede these potentially devastating
events has been the subject of many studies. In particular, there has been a recent focus on
determining the periods when the magmatic system is in an ‘eruptible’ state; considered to
be magma with less than 50% crystals. Magma in systems that are beyond 50% crystalized
becomes rheologically hindered and unlikely to erupt (Marsh, 1981). For those volcanic
systems that are in the midst of a caldera forming cycle, we can evaluate the physical state
of the magmatic system by analyzing plagioclase crystals produced from eruptions during
the most recent caldera cycle to postulate where the system is now.
In particular, plagioclase crystals can offer a more detailed representation of the magma
evolution as it is a liquidus phase that preserves the compositional characteristics of the
reservoir. Although age dating intracrystalline growth zones in plagioclase is not possible
in the way that it is for other phases such as zircon, plagioclase can still demonstrate
temporal changes to a magmatic system through a caldera cycle. Here we assess the
changes in the thermo-mechanical state through the most recent OVC caldera cycle by
utilizing chemical, textural and statistical information derived from the plagioclase at OVC.
5.1 The thermo-mechanical evolution at Okataina
The primary factor that influences the ‘eruptibility’ of a magmatic system is its physical
state. Similar to other silicic volcanic centers, the eruptible magmatic system in the upper
crust at Okataina has been described as a crystal mush that is comprised of a crystal
framework supported by interstitial melt (Andersen et al., 2019; Bachmann et al., 2011;
Deering, Cole, et al., 2011; Klemetti et al., 2011). Although these mush systems are often
cited to describe the physical status of a wide array of volcanic systems, the understanding
of the evolution of these mush systems through time is still a topic of debate. The
26mechanical state that these upper crustal magma bodies exist in has been subject of debate
between a “cold” and “warm” storage where the eruptibility is controlled by the
crystallinity and viscosity of the magma (e.g.: Barboni et al., 2016; Cooper & Kent, 2014;
Rubin et al., 2017).
The interactions between reservoirs can be characterized generally by a spectrum of
hybridization that is controlled by the input of primary, less evolved magma and the degree
of crystallization of the magma in the host reservoir (Figure 5.1). Here, low degree of host
crystallization, akin to a warm storage environment, lends to more complete mixing with
intruded mafic material (Column 1) while near complete crystallization of the reservoir,
akin to a cold storage environment, encourages dike propagation of less evolved intruded
material through the host reservoir (Column 4). Magma mingling (Column 2) and
Composite dikes (Column 3) occur when intruded magma can mingle and mix with the
host reservoir to varying degrees (Barbarin & Didier, 1992).
5.1.1 Textures
Variations in growth zone textures occur because of changes in P-T-X conditions of the
melt in which a crystal resides. Crystals that have a solid core and oscillatory zones are
noted in each eruption within this series (Table 4.1:1). Small scale (width and ΔAn) zoning
oscillations have been shown to reflect local changes in the boundary layer kinetics during
equilibrium interactions between melt and crystal, while large scale (zone width and ΔAn)
oscillations suggest more significant changes to the P-T-X conditions of the magmatic
system (e.g.: Pearce & Kolisnik, 1990; Ruprecht & Wörner, 2007; Viccaro et al., 2009).
These larger scale fluctuations often accompany unconformities in the zoning stratigraphy
in response to intrusions of hotter, less evolved melt. The variations in zoning amplitude
and frequency are often not mutually exclusive in each population of plagioclase however,
as each eruption often produces plagioclase with a complex variety of growth textures.
Patchy zoning is considered here to indicate a change in environmental parameters
surrounding an existing crystal such that it was no longer in equilibrium with the
surrounding melt. As a result of the disequilibrium, the plagioclase reacted with the host
27You can also read