THE LEADING MARITIME CITIES OF THE WORLD 2O22
←
→
Page content transcription
If your browser does not render page correctly, please read the page content below
THE LEADING
MARITIME CITIES
OF THE WORLD
2O22
A Menon Economics and DNV Publication
A Menon Economics and DNV Publication

Authors:                                                               CONTENTS
Menon team: Erik W Jakobsen, Lars Martin Haugland, Serli Abrahamoglu
DNV team: M. Shahrin Osman, Deepti Sewraz, and Benjamin Dineshkar
                                                                       EXECUTIVE SUMMARY                                        4
Design:
Ludvig Holmen                                                          THE MARITIME INDUSTRY                                    6
Daniel Barradas

Photos: iStock                                                         THE LEADING MARITIME CITIES OF THE WORLD                12

                                                                       INDICATORS FOR CITY RANKING                             16

                                                                       SHIPPING CENTERS                                        18

                                                                       MARITIME FINANCE AND LAW                                24

                                                                       MARITIME TECHNOLOGY                                     30

                                                                       PORTS AND LOGISTICS SERVICES                            38

                                                                       ATTRACTIVENESS AND COMPETITIVENESS                      42

                                                                       APPENDIX A: LIST OF OBJECTIVE INDICATORS OF 30 CITIES   46

                                                                       APPENDIX B: METHODOLOGY AND DATA SOURCES                48
EXECUTIVE SUMMARY

     1                          2                         3                         4                         5
                                                                                                                            maritime city of the world during the pandemic and           the Shipping pillar is Hamburg’s only top 5 position
                                                                                                                            the emerging green transformation of the industry.           this year. Consequently, Hamburg has fallen to 9th
                                                                                                                            Singapore has been able to retain its position as a          place overall. New York takes the top position on the
                                                                                                                            world-leading maritime hub due to its strength in            Maritime Finance & Law pillar, followed by London,
    SINGAPORE               ROTTERDAM                   LONDON                   SHANGHAI                     TOKYO
                                                                                                                            all pillars. However, the top positions on the pillars       Tokyo, and Oslo. For the Maritime Technology pillar,
                                                                                                                            have changed. Singapore is still number one on the           Singapore claims the top position, with Oslo and
                                                                                                                            Attractiveness and Competitiveness pillar. This year         Busan ranking 2nd and 3rd respectively. Shanghai
                                                                                                                            Singapore has also outperformed all other cities on          takes the top position for the Ports & Logistics pillar,

     D      ramatic changes have occurred since our last         cities are competing to attract the best companies,        Maritime Technology. A consistent strategy for inno-         overtaking Rotterdam, Hong Kong, and Singapore.
            Leading Maritime Cities publication. We are          startups, and most talented people. The winners in         vation, targeting start-ups, and investment in digital          The maritime industry is on the verge of a digital
     still in a pandemic, more than two years after its          this race for attractiveness are – and will continue to    technologies has paved the way for Singapore’s posi-         transformation, including the adoption of disruptive
     initial outbreak. Countries and cities have been            be – the leading maritime centers of the world.            tion on Maritime technology. However, Singapore              and innovative technologies. These two dimensions
     locked down, with severe consequences for trade,               The 2022 edition of the LMC (Leading Maritime           loses its number one position in Shipping Centers            cut across the five pillars that the cities are bench-
     travel, and people’s mobility. Ships have been stuck        Cities) report is back, with fresh insight about which     and Ports and Logistics to Athens and Shanghai               marked on, and are particularly relevant on Maritime
     in ports, and seafarers have been stuck onboard             maritime cities provide the best support, in terms of      respectively. On the Maritime Finance and Law pillar,        Technology. The maritime industry experts voted
     ships. Cargo delays are common, and container               soft and hard infrastructure and world-class talent, to    Singapore is losing some ground, going from 5th to           Singapore, Oslo, Shanghai, and Copenhagen to be the
     rates have skyrocketed. Still, the world economy is         allow maritime businesses and people to connect and        8th place.                                                   cities best prepared for the digital transformation of
     in surprisingly good shape, taking the consequences         thrive. Like its previous editions, the LMC 2022 report       Three of the top 5 cities are Asian, and two cities are   the industry. Oslo has also further consolidated its
     of the pandemic into account.                               covers 5 pillars – Shipping Centers, Maritime Finance      European. Rotterdam continues to climb up the LMC            position as the world’s leading center for sustainable
        The second major change driver is the climate            and Law, Maritime Technology, Ports and Logistics,         ranking and takes second place this year. Although           technologies and solutions for the oceans, followed by
     crisis. Although by no means a new phenomenon, the          Attractiveness and Competitiveness – on which the          holding a 10th position on Shipping and having no            Singapore and Copenhagen.
     sentiment in the world in general, and the maritime         maritime cities are benchmarked. Under each pillar, a      first position on any pillar, Rotterdam scores high on          Looking five years into the future, our experts
     community in particular, has changed dramatically           comprehensive set of objective and subjective indica-      most pillars, particularly on Ports and Logistics and        predict that Singapore will keep its position as the
     recently. The technological progress is stunning,           tors have been considered (40 in total). For the 2022      Attractiveness and Competitiveness. London has also          global leader, while Shanghai will grow in impor-
     but we are still far from the GHG goals set by the          report, some new and more comprehensive objective          climbed from 5th to 3rd position overall. Interestingly,     tance and become the second most important mari-
     IMO, the European Union and national authorities.           and subjective indicators, as well as data sources, have   though, London also does not have first position on          time city. The race to be the leading city in Europe is
     However, shipowners, charterers and cargo owners,           been used to ensure that the analysis is based on reli-    any of the pillars, since New York has outranked             still open, with London, Oslo, and Rotterdam as the
     and financial providers are preparing for a low- or         able and complete data for the various cities, which       London on Maritime Finance & Law. On the overall             leading contenders in this regional race. Hamburg
     even zero-carbon future, and we can expect rapid            ultimately allow for a more refined benchmarking           ranking, Shanghai holds the 4th position, and Tokyo          and Athens have lost ground since 2019. In the Middle
     implementation of zero-carbon fuels in the next ten         of the relative performance of each city compared          holds the 5th position. Tokyo has always performed           East, India and Africa region, Dubai is the leading
     to fifteen years. We are quite certain that cities taking   to the previous report. We have also introduced new        strongly on objective indicators. Hong Kong has lost         maritime center, and at a global level now ranked 12th,
     the lead in the green transformation will become the        objective indicators to benchmark key development          its position within the top 5 in the Shipping pillar, and    primarily due to the split between Dubai and Abu
     leading maritime cities of the world.                       in the green transition. The subjective indicators         Maritime Finance & Law, and dropped from 4th to              Dhabi (both parts of UAE) in this year’s edition of the
        More than half of the world’s population live in         under each pillar come in the form of the perception       7th place in the overall ranking. In the 2022 edition of     LMC. The experts predict that Dubai will continue to
     cities, and it is predicted that two-thirds of the world    and assessment by nominated business executives –          LMC, more objective indicators are introduced, with          grow in importance and is expected to take 6th place
     population will be living in urban areas by 2050,           mostly shipowners and managers – from all around           a stronger weighting of objective indicators compared        by 2027, albeit with strong competition from Hong
     according to United Nations estimates. The impor-           the globe. Of these 280 experts called upon for this       to maritime experts’ assessments.                            Kong, Hamburg, and Copenhagen.
     tance of city regions will therefore continue to grow.      study, around 50% are based in Asia, 25% in Europe,           Athens is back on top of the Shipping pillar, followed
     Cities are the centers of knowledge, talent, innova-        and the remaining 25% are from America, the Middle         by Singapore, Tokyo, and Shanghai. Hamburg, which
     tion, and specialization of production and services. In     East and Africa.                                           in previous editions has been among the top 5 cities on
     today’s world, particularly for the maritime industry,         Singapore maintains its position as the leading         the overall ranking, has lost ground. Its 5th place on

4                                                                                                                                                                                                                                                   5
THE MARITIME
INDUSTRY
2020/2021 – SNAPSHOT actions and practices on critical matters such as onboard safety, • Ongoing prolonged port congestions and increasing back- ALWAYS FOR A GLOBAL REACH
M T
seafarer contracts and repatriations, and supply of necessary logs for most major ports. Indicatively, during November 2021,
aritime trade accounts for almost 90% of the world’s he past decade has presented new obstacles and possibilities
provisions, supplies, and vessel spare parts. Singapore recorded close to 60% level of congestion, followed
commerce, but has been severely tested in recent years. The for organizations vying for a global reach and an interna-
With the IMF forecasting a rise in world GDP in 2022, various by Hong Kong at 55% and Shanghai at 45%, while LA ports
global seaborne trade’s current situation is subject to a multifac- tional footprint, which impacted markets and the economy on a
growth projections for global seaborne trade have been published, in the USA have had more than 80 vessels anchored during
eted problem. Before COVID-19, strained trade relations among global scale. Organizations involved in maritime transportation
ranging between 4 to 6% in 2021. These growth projections are the same period (Bloomberg, 2021). During “normal” times,
several nations (e.g., between global economic superpowers have had a significant impact on the economies of nations regard-
subject to the extent and effectiveness of policy intervention ports typically experience 10% level of congestion and rarely
China and the USA, and in relation to the UK’s ratification of less of their size or type. Globalization encourages businesses to
measures aimed at stimulating growth in various regions, but surpass the 20% mark. As a consequence, shippers are opting
the withdrawal agreement with the EU) were already threatening take active measures to defend their own market from competi-
clear signs of recovery could already be seen by mid-2021 when to unload goods destined for LA in Seattle or even Florida,
disruptions to maritime trade and supply chains. With the onset tion while also seeking new, appealing markets for their goods
overall global average trade volumes returned to pre-COVID then arranging for long rail or truck transportation (Journal
of COVID-19 as a global pandemic in March 2020, international and services. Regulatory and technological trends, such as the
levels, surpassing most of 2020’s expectations. Market perfor- of Commerce Online, 2021).
trade collapsed with lockdowns, travel restrictions, fast-rising presence of trading blocs like the EU/EEA, NAFTA, RCEP and
mance for different shipping segments has been uneven, with • Booming freight rates for containerships in 2021. Large
unemployment, and temporary oil and stock market crashes. the ability of companies to manage cargo flows, utilizing modern
some experiencing exceptional times (with faster recoveries for owners/operators such as Maersk Line, CMA CGM and
Supply chain disruptions, demand contractions and global IT systems, are removing barriers to cross-border mobility and
containers, LPG, dry bulk and LNG, with approx. 6-12 months COSCO are achieving record profits for back-to-back quar-
economic uncertainty resulted in a drop in seaborne trade across reducing associated “barrier costs”.
to recovery from the start of the pandemic in March 2020), while ters. On the other hand, shippers around the world are looking
different shipping segments in all regions. Achieving complex trading networks for these organizations
others are continuously struggling to make ends meet (e.g., into adapting their logistics plans and practices to counter the
Since shipping continues to shoulder the responsibility of is key, to benefit from opportunities in capitalizing on labor
with oil and cruise segments still under pressure with expected impact of costly freight rates. For example, IKEA has moved
providing undisrupted shipments of food, energy commodities cost differentials and availing raw resources in specific nations.
recovery timelines between 24 and 36 months from March 2020). a significant portion of its production base from China to
and medical supplies across the continents, shipping companies, The most prevalent method for transporting raw materials and
With the rebound in consumer demand for goods from Q3 Turkey to ease the logistics strain (Reuters, 2021). Coca-Cola
by necessity, must be agile and adaptable to this fluid situation merchandise has been and will continue to be seaborne routes.
2020 onwards, following the initial disruption in the global logis- is now packaging some of its material and products in large
and focus on building effective response strategies and plans. To In 2019, the total annual global seaborne trade was at 11.8 billion
tics sector, the effects have been felt differently by various mari- palleted blocks or sacks for transportation in chartered dry
support the maritime industry in achieving this, the IMO and metric tons of goods transported, up from 8.36 billion metric
time players, leading to new measures of adaptation. bulk vessels (Tradewinds, 2021).
other systemic maritime organizations joined efforts in defining tons in 2011 (UNCTAD, 2021).
6 7
calculation of fees and online payment for immediate release highlighting the risk and the plethora of potential avenues a
functionalities – registered an 85% increase in transactions as cyberattack can originate from.
customers started ordering more remotely and sought to track The IMO urges administrations to take sufficient steps in
cargo more efficiently (UNCTAD, 2020). constructing, adopting, and integrating efficient and effec-
Some maritime players are also upgrading their infrastructural tive cyber risk management procedures, offering guidance and
and assets’ operations based on cyber-physical systems (systems encouraging vessel operators to ensure that cyber risks are appro-
coupling digital software with hardware). Emerging technolo- priately addressed in their existing safety management systems
gies like blockchain-based utilization are proving to be effective (as defined in the ISM Code), no later than the first annual verifi-
in customs clearance and management, and the standardization cation of the company’s Document of Compliance after January
of paper-based procedures (Yang, 2019). On the vessels side, the 1st, 2021.
need to integrate smart technologies during operation supported The maritime industry has witnessed the impact of digital
by “big data analysis” is becoming more prevalent, although an disruptions and disruptive innovations within several areas such
effective level of integration can be more easily achieved if incor- as additive manufacturing, electronic bills of lading replacing
porated during the newbuilding stage (Sullivan et al., 2020). the century-old paper-based system, and remote operations and
Such maritime digital transformation causes fundamental monitoring combined with AI for automatic detection of corro-
organizational changes in traditional business practices by the sions, cracks, and deformities. The development within additive
implementation and use of digital technology, redefining existing manufacturing for maritime applications is most profound in
business capabilities, processes, and relationships, and thus Singapore, with the authorities injecting millions in innova-
new possibilities are enabled, and value is created, captured and tion funding to kick-start multiple joint industry projects to
delivered (Tijan et al., 2021). Crucial for the success of digital implement a just-in-time provision of marine parts, acceler-
transformation is the alignment between both the business and ating the deployment of 3D-printed marine parts aboard several
digital strategies as well as the acceptance of involved players Singapore-registered vessels. In 2021, Singapore and Rotterdam
(port administrations, shipowners, shippers, service providers) to have successfully completed a trial on the application of electronic
cooperate. On the other hand, the main barriers for digital trans- bills of lading using two different technology platforms. With the
formation appear to be the high initial implementation costs, low Government of Singapore passing a new bill to amend its existing
quality of offshore internet connections, aging decision-makers, Electronic Transactions Act, recognizing the electronic bills of
and the lack of investment initiatives and risk aversion especially lading as equivalent to paper-based bills of lading, this develop-
due to the uncertainty sentiment induced by the COVID-19 ment will be a major disruption to the traditional supply chain.
pandemic.
With digitalization come cyber security concerns which
Maritime shipping, especially driven by vessel upsizing trends, level of service, such as continuous satellite cargo monitoring, require constant monitoring of both interconnected IT (standard
is utilizing economies of scale and standardization of vessel tech- prompting organizations to form international alliances or merge information systems) and OT (operation and control systems)
nologies and design to achieve great reductions in transportation their individual regional entities into one global network. infrastructures to detect real-time threats. Increasing reliance
costs. In 2021, the largest containerships can reach up to 23,000 on automated and networked systems of equipment and tech-
nologies greatly affects the safety and livelihood of crews, vessels,
TEU (“twenty-foot equivalent unit”) capacity, shooting up from DIGITAL TRANSFORMATION, CYBER SECURITY
cargoes, and ports. Indeed, as vessels increasingly shift their
8,000 TEU capacity in 2006. Sufficient infrastructure needed to AND INNOVATION
connectivity and control to OT systems (providing tremendous
D
accommodate the increasing seaborne trade, led by state-of-the-
igitalization involves the transformation of key business benefits in terms of safety, availability, and energy efficiency) and
art international ports, is deemed a necessity. Hence, port cities
operations and affects products, services, and processes, as with ports’ control systems for their OT network (connecting
are being coined “frontline soldiers of globalization” (Ducruet
well as organizational structures and management concepts (Matt RTGs, STS cranes, traffic control and vessel berthing systems,
and Lee, 2006). A strong maritime player, Chinese conglomerate
et al., 2015). Digital transformation of the maritime industry is cargo handling and safety and security systems), this is opening
and port operator COSCO continues to create an unparalleled
under way, challenging existing business models but also offering doors to cybercrime which is recognized as the biggest emerging
global shipping nexus of ports and warehousing infrastructure,
new opportunities. challenge of the maritime industry. Hackers do not discriminate
lately upping their ownership stake of Piraeus Port to 67%, as
The level of adoption is varied in the sector and still lacking, – they are hitting organizations large and small, with or without
well as buying a 35% minority stake at a container terminal in the
compared to other industries, in the proliferation of digitaliza- abundant cybersecurity resources (Vessel Automation 2021).
Port of Hamburg and a 60% stake at Chancay Terminal in Peru,
tion in the entire scope of maritime transport and services. It is The number of cyberattacks in the maritime industry is
making this the first terminal project invested in by Chinese
currently most pronounced in vessel navigation systems and in increasing at an alarming rate in recent years, some targeting
companies in South America.
streamlining cargo handling operations, including cargo optimal facilities and companies ashore whilst others are focusing on the
Nowadays, most maritime services are globalized and often
routing, monitoring, warehousing, and use of AI-powered algo- maritime fleet, resulting in breaches to IT systems, hardware,
located around ship owning companies. Ship finance was among
rithms for optimized stowage plans for container ships. sensors, data confidentiality, with the gain of unauthorized access
the first to globalize, whilst legal services were the least flexible
Other than the improvement and interconnectivity of informa- to manipulate or disrupt business operations. In 2020, cyber-
to move across borders due to national jurisdiction limitations.
tion and cargo flows, and vessel monitoring, some of the other attacks on the maritime industry’s OT systems increased by 900%
English law firms have been the exception, with branches in
digital initiatives are aiming at the automation and centralization since 2017 with 50 significant OT hacks reported in 2017, rising
shipping hubs across the world, since English law is commonly
of internal and external services, such as bookings, orders, and to 120 in 2018 and more than 310 in 2019. In 2020, more than 500
chosen as the jurisdiction in contracts of trade and chartering.
customer support. For example, in June 2020, MSC introduced major cyber security breaches were expected, with substantially
The maritime industry is supported in its globalization efforts
the instant-quote tool to provide easy access to its rates for ocean more going unreported (Vanguard, 2020).
by the technological progress in the transport and transshipment
shipping, to make its customers’ supply chain easier to manage In October 2021, multiple Greek shipping companies were
sectors including cargo unitization, and the wide application of
and improve end-to-end efficiency (UNCTAD, 2020). In April hit by a ransomware attack that spread through the systems of
IT systems in the planning and control of the delivery process.
2020, Maersk’s online application – featuring cargo release, a popular, well-established IT consulting and service provider,
Trading partners and carriers have come to expect a certain
8 9
EVOLVING MARITIME REGULATORY                                               and to promote and incentivize the decarbonization of interna-           this requirement. The Sea Cargo Charter is consistent with the
FRAMEWORK FOR GREEN TRANSFORMATION                                         tional shipping.                                                         IMO’s GHG Strategy.
                                                                              • “Green Deal” drives the EU policy initiatives, intending to
G     lobal concerns about invasion of aquatic organisms, SOx
      emissions and GHG emissions from the shipping industry
have led the IMO to implement three initiatives aimed at limiting
                                                                              achieve a climate-neutral Europe (including ships trading in
                                                                              Europe) by 2050. The shipping industry has estimated that
                                                                                                                                                  WHERE NEXT?
                                                                                                                                                    Considering where the maritime industry has been in recent
                                                                              a 90% reduction in GHG emissions from maritime trans-
the impact of these in recent years. The first two initiatives relate to                                                                          years and where it is heading (for a global reach in an evolving
                                                                              port relative to 1990 is needed by 2050, with an intermediate
ballast water management and the carriage ban of fuel with more                                                                                   maritime regulatory and environmental landscape and bound
                                                                              (and new) overarching EU target for 2030 being 55% (instead
than 0.50% sulphur content unless scrubbers are installed. The                                                                                    for a cyber-sensitive digital transformation), which cities around
                                                                              of the original 40%) reduction relative to 1990. The “Fit for
third initiative is the IMO’s ambitious GHG strategy (adopted in                                                                                  the world will provide the best support, in terms of soft and hard
                                                                              55” package of policy measures is under review by the EU
April 2018) which sets out a vision to reduce GHG emissions from                                                                                  infrastructure and world-class talent, to allow maritime busi-
                                                                              Commission.
international shipping and phase them out as soon as possible in                                                                                  nesses and people to connect and thrive?
                                                                              • “The Poseidon Principles” is an initiative that is being
this century. Regulations around the GHG strategy are expected
                                                                              implemented by financial institutions. Some of the signato-
to be the main challenge for shipowners in the medium to long
                                                                              ries include BNP Paribas, Credit Agricole, Citi, Credit Suisse,
term.
                                                                              ING, SuMi Trust, Nordea, DNB, Danske Bank. The Poseidon
   While the ambitions of the IMO are clear, the road to achieving
                                                                              Principles establish a framework for assessing and disclosing
these ambitions remains less so, e.g., which policy measures can
                                                                              the climate alignment of ship finance portfolios. They set a
the IMO invoke to incentivize the needed change? This is an
                                                                              benchmark for what it means to be a responsible bank in the
ongoing process in the IMO. Different measures were consid-
                                                                              maritime sector and provide actionable guidance on achieving
ered and widely discussed, and the IMO decided to introduce a
                                                                              this. The Poseidon Principles are consistent with the IMO’s
combination of technical and operational measures. Whilst EEXI
                                                                              GHG Strategy.
(Energy Efficiency Existing Ship Index) is a technical measure,
                                                                              • “Sea Cargo Charter” was launched in 2020, applicable to bulk
looking at the design of the ship in a comparable way as EEDI
                                                                              ship charterers with signatories such as Trafigura, Dow, Total,
(Energy Efficiency Design Index) does for newbuildings, the CII
                                                                              Shell, Equinor, Gunvor, LDC, Cargill and AngloAmerican.
(Carbon Intensity Indicator) measure is an operational measure
                                                                              The Sea Cargo Charter will measure GHG emission intensity
considering the actual fuel consumption and distance travelled
                                                                              and total GHG emissions of the signatories’ chartering activi-
for each individual ship in service.
                                                                              ties annually and will assess their climate alignment relative
   In addition to the IMO’s CII Rating Scheme, other organiza-
                                                                              to established decarbonization trajectories. Signatories will
tions – such as the EU, Sea Cargo Charter and financial institu-
                                                                              commit to making compliance with the Sea Cargo Charter
tions – have their own environmental compliance requirements
                                                                              contractual in their new chartering activities. They will use the
(which in some cases are more ambitious than the IMO’s GHG
                                                                              Sea Cargo Charter Clause in charter parties and work together
Strategy) with a goal to align global shipping with society’s goals
                                                                              with shipowners, ship managers and business partners to meet

10                                                                                                                                                                                                                     11
THE LEADING MARITIME CITIES
 OF THE WORLD
CITIES – ENGINES OF INNOVATION AND                                          functioning and performance of multinational firms’ local          variety of players. Over time, many of these actors gather in              cooperation in businesses and R&D, information sharing, and
GROWTH                                                                      and global operations. Knowledge-based industries tend to          specific geographic regions, or cities, thus forming so-called             risk sharing through investments in new markets.
                                                                            centralize in a few leading city regions – San Francisco for       clusters. A maritime cluster can broadly be defined as “a group           Most maritime clusters owe their existence to the city’s past
   Urbanization is one of the strongest global megatrends in this
                                                                            ICT; Boston for biotechnology; Houston for O&G; New York           of industries that are directly and indirectly related to shipping     success in its role as regional port/hub of commerce. But this is
century, with a clear shift in importance from nations to cities
                                                                            for finance; and Singapore for maritime. This is not, however,     and situated within a certain geographic area” (Shinohara, 2010).      not enough, as proven by cities with a declining maritime foot-
(Moretti, 2012; Quartz, 2015). Today, close to 55% of the world’s
                                                                            a “winner-takes-it-all” game. There is room for cities with        Maritime clusters make distinct contributions to the development       print, such as San Francisco, Naples, Liverpool, and New Orleans,
population – 4.2 billion inhabitants – live in cities and this trend
                                                                            leadership in niches of industries, like Geneva in medtech, and    of national or regional economies and provide strong support for       due to decreasing demand for traditional port services amid
is expected to continue so that by 2050, nearly 7 of 10 people
                                                                            London in fintech, or for cities with regional leadership such     innovation and technological development in maritime indus-            fierce competition (Merk, 2013). On the contrary, the operators
in the world will live in cities. More than 80% of global GDP is
                                                                            as Shenzhen in ICT and Singapore’s Biopolis for biomedical         tries (Shi et al., 2019). Their vital role in enabling international   of the Singapore maritime cluster successfully maintained their
generated in cities (World Bank, 2020). Population projections
                                                                            science.                                                           trade and the global supply chain is also evident in their provision   cluster’s relevancy by modernizing their capacity to accommo-
show that virtually all growth over the next 30 years will come
                                                                            • An enabling environment, characterized by the presence           of integrated logistics and maritime services in addition to tradi-    date increasingly large ships and high cargo volumes and to offer
in urban areas. Companies are thus increasingly focusing on city
                                                                            of a culturally diverse body of players, including big corpora-    tional cargo handling-related activities (Zhang and Lam, 2013).        complex, highly specialized logistical services, while catering to
regions when developing their strategies for where to relocate or
                                                                            tions, highly specialized professional talent, and academia. At       Critical success factors for a maritime city may include            specialized needs for maritime finance, insurance, bunkering
expand their operations.
                                                                            their core, these cities possess the capabilities for servicing,   (Monteiro et al., 2013):                                               and other value-added services (Jakobsen et al., 2017). Local
   Three distinct features or common indicators of “global cities”
                                                                            managing, and financing the global operations of firms and            • Acknowledgment of the maritime cluster as a cornerstone of        governmental entities and maritime associations have greatly
are (Goerzen et al., 2013):
                                                                            markets (Sassen, 2001). It is where global firms connect, build       the national and regional economy.                                  contributed to that effect by adopting and implementing pro-
    • High levels of connectivity with other locations, as they
                                                                            relationships and transfer knowledge, maintaining a level of          • Adoption of favorable policies, to allow actors to stay           business policy measures, as well as continuously seeking input
    typically have a good physical information and communica-
                                                                            connectivity, often seen as a means of achieving economic             competitive in a globalized and evolving environment.               and feedback from industry actors, for Singapore to remain an
    tion infrastructure that facilitates the international transfer of
                                                                            development and improving their competitiveness (Pain et al.,         • Engagement with other maritime clusters, utilizing own            attractive location for maritime business establishments (Osman
    goods, people, and information.
                                                                            2015).                                                                strengths and supplementing for shortfalls.                         et al., 2021).
    • Specialized providers of high value-added services, such as
                                                                           Shipping is a global business, encompassing a complex variety          • Involvement of maritime education centers, financial insti-
    financial, legal, and consultancy, which are important to the
                                                                         of actions taken and services performed, by an equally complex           tutions, trade associations and other stakeholders, allowing for

12                                                                                                                                                                                                                                                                                   13
MARITIME COMPANIES – RESTRUCTURING or three global centers characterized as “shipping super cities” – below. top five or top three maritime cities on shipping, finance, tech-
WITHIN A GLOBAL PLAYGROUND one city in each of the eight-hour time zones (Asia, Europe and For the maritime industry in a city to prosper, two conditions nology and port/logistics, together with six other dimensions.
the Americas). This will mean that some of today’s shipping must be satisfied: the companies must be competitive, and the With this data we have created a scoring system based on experts’
Aware of such international competition, cities are developing
centers will lose importance to a few global centers that will act city must be attractive as a host for these companies. These two ranking of cities, where the city ranked first gets 5 points, the city
strategies to enhance their attractiveness to highly productive
as shipping service hubs. Stopford also went further, dividing conditions are mutually dependent: the companies gain their ranked second gets 4 points etc. At the end, the total points under
and innovative companies, and to talented individuals. The more
the cities into cargo port and shipping services ports. Cargo port competitiveness from resources available in the city – for example each ranking were summarized for each city, and these points are
mobile the companies, the stronger the competition among cities
cities, such as Rotterdam and Shanghai, are mainly driven by access to capital, talent, and specialized supplies – and the price used as scores on each subjective indicator in our top 50 ranking.
to attract them. As the maritime industry is global in nature,
their role of transporting cargo to the regional markets. In ship- they must pay for these resources. Accordingly, the attractiveness Detailed information about the composition of experts can be
many maritime companies are mobile entities seeking to take
ping services ports, on the other hand, the port is secondary while of the city increases when competitive companies are present found in Appendix B.
advantage of localization advantages in different countries. This,
offering other services to the international shipping industry will in the city. Hence, the clue is to attract the winners (Jakobsen, The ranking approach is illustrated as follows:
combined with the maritime industry being a high value-added
be key. et al 2003). Over time, the attractiveness of the cities is gradu-
industry, means that the fight to attract maritime companies is
ally shaped by the dynamics of the industry. In an industry with ALL MARITIME CITIES IN THE WORLD
tough, especially for shipping being the most highly mobile sector
DRIVERS OF COMPETITIVENESS strong cluster dynamics, knowledge is continuously improved (pool of 15 000+ cities)
within the maritime industry. This also implies that it may be
and dispersed, upgrading both companies and resources. Finally,
easy to lose maritime business activities. The gains from winning There are many interconnected factors that drive the attractive-
governments play a central role in defining the attractiveness
the location race are hence higher for the less mobile part of the ness of a city and the competitiveness of the industries located
of the city. Through various public policy factors like taxes and
industry. there:
subsidies, they determine the price of capital, labor, and other 50 NOMINATED CITIES
Specialized knowledge-based services are probably the least • Strategic location (Initial ranking – benchmarked on objective indicators
input factors. The quality of the resources is to a large extent
mobile companies in the maritime industry. The reason for this • Favorable and stable political framework only, across 4 pillars)
determined by investments in infrastructure, education, and
is that knowledge-based companies often have links to universi- • Transparent and efficient legal framework
R&D. Key institutions, including cluster facilitators, contribute
ties and are deeply embedded in the local milieu; for example in • Proximity to large, demanding customers
to making a location attractive through active engagement with
their reliance on specialized local competence. Another impor- • Local rivalry – creates incentives for continuous improve-
the maritime industry and introducing initiatives and programs
tant point, following from the fact that firms increasingly split up ments and innovation
based on industry feedback (Osman, 2020). 50 LEADING MARITIME CITIES
their value chains, is that cities compete to attract activities – not • Abundance of suppliers and service providers
The four main elements in the model, public policy factors, (Final ranking – benchmarked on objective and subjective indicators,
companies. Winners will be those cities which are able to attract: • Specialized universities and research institutions across 5 pillars)
the competitiveness of the companies, the attractiveness of the
• Science and higher education • Large pool of talent
cities, and finally, the dynamics of the industry clusters, are meas-
• Owners and headquarters • Rich and open flow of knowledge and ideas
ured and benchmarked for maritime cities across the world. The
• R&D – product and technology development • Relationships based on trust
results for the top 50 cities are presented in this report. Compared to the 2019 edition of the report, several changes
• Financial, legal, and other sophisticated business services • Meritocratic education and career system
were implemented for the 2022 edition, which makes the direct
• Soft location factors – an attractive place to live for families
BENCHMARKING BASED ON OBJECTIVE & comparison of rankings between 2022 and 2019 impossible.
While many cities are important centers in today’s maritime and individuals
SUBJECTIVE INDICATORS However, these changes were deemed crucial to make the overall
industry, some researchers suggest that we may see a future
assessment as comprehensive as possible and aligned with the
concentration of shipping activity (Center for Liveable Cities, Together, these factors produce spirals of self-reinforcing This Leading Maritime Cities report is in its fifth edition. The
global trends in the industry. Furthermore, since the last edition
2014). The international maritime expert Martin Stopford was growth – or decline, if the factors are absent. The mechanisms ranking is based on a combination of objective data from leading
of the report we have gained access to new and more detailed data
one of those who proposed that we will see a development of two that drive industry competitiveness are summarized in the model international sources and subjective expert assessment to evaluate
making it possible to include more cities in the ranking sample
and benchmark the top 50 leading maritime cities. This approach
and increase the data quality for the cities involved. The most
THEORETICAL MODEL OF INDUSTRIAL COMPETITIVENESS offers the advantage of considering both hard facts (objective
important change in this edition is that we have introduced four
indicators) as well as the subjective assessment by nominated
Source: Jakobsen et al, 2003 (Attracting the winners) “green” indicators to reflect the decarbonization of the maritime
maritime business executives, owners and academics from all
COMPANY industry. Although still in its infancy, we find it crucial to start
around the globe. Expert opinions are of particular importance
COMPETITIVENESS measuring the transformation now. Other changes in the indica-
in areas that are difficult to measure with available objective data
tors compared to earlier editions are described in appendix B.
OPERATIONAL EFFICIENCY & at city level (such as regulations, cluster dynamics, technological
STRATEGIC RESOURCES expertise etc.).
The identification of the top 50 maritime cities in the world is
conducted by using a bottom-up approach, whereby all cities with
PUBLIC POLICY some level of maritime activity (a sample of 15,000+ cities) are
CLUSTER DYNAMICS narrowed down to a sample of 50 cities based on a ranking of 25
Fiscal and monetary policy
Demanding customers LONG TERM objective maritime indicators across four (out of five) pillars. The
Local rivalry
Tax & subsidies
Cooperation
RELATIVE four pillars include Shipping, Maritime Finance & Law, Maritime
Regulations INDUSTRY
Labour market Open information and trust Technology and Port & Logistics. These cities are thereafter
Mobility of competence
PERFORMANCE
Education assessed by 280 maritime experts across the world along all five
R&d
pillars, and their assessment in combination with the objective
data is used to rank the sample of 50 cities. This final round of
CITY rankings gives us the top 50 leading maritime cities of the world.
ATTRACTIVENESS Subjective indicators are based on information we have gath-
ered through the “Leading Maritime Cities 2022” survey. In this
(Availability, quality and price)
Talent, capital, infrastructure, connectivity,
survey, maritime experts from all over the world with different
business friendliness, living conditions, etc. backgrounds were asked to provide qualitative assessments on
topics like green transformation, digitalization, competitiveness,
and innovation. Furthermore, the 280 experts have ranked the
14 15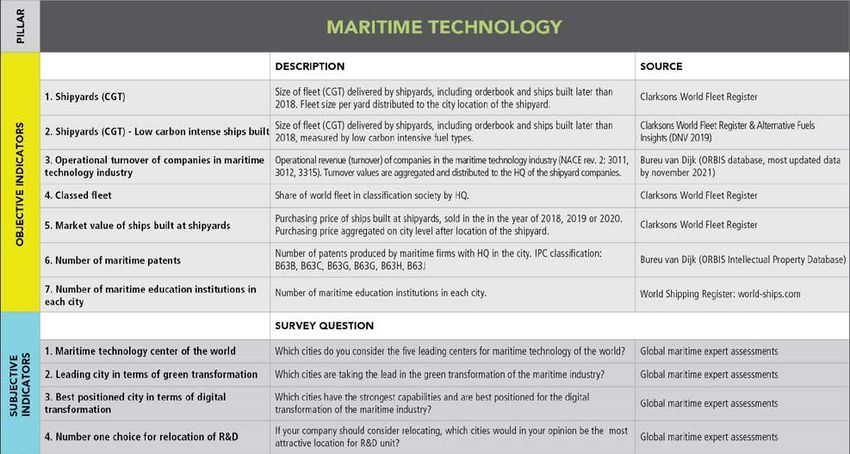
INDICATORS FOR CITY RANKING
     There are numerous ways to assess the strength of the maritime               and managers – from all around the globe. Of the 280 experts called
     cities. Data sources that are widely used and renowned in the industry       upon for this study, around 50% are based in Asia, 25% in Europe, and
     have been used. Methodology and data sources are described in the            the remaining 25% are from America, the Middle East and Africa.
     appendixes.                                                                     The study uses a ranking model consisting of both objective and sub-
        In this year’s report, for the objective assessment, previously used      jective indicators for the top 50 maritime cities across five pillars. Each
     objective indicators were revised to be based on new and updated da-         pillar is weighted equally (a weight of 20%) in the global top 50 city
     tabases whilst new objective indicators were also included. The over-        ranking. The five pillars of the study are the same as in the last edition of
     arching aim has been to ensure that the analysis is replicable and based     the report: Shipping, Maritime Finance and Law, Maritime Technology,
     on reliable, complete and high quality data for the various cities. Hence,   Ports and Logistics, and Attractiveness and Competitiveness. Within
     adjustments to the data sources and/or indicator set have been made          each pillar, all indicators are weighted equally (e.g., if a pillar consists
     where deemed necessary. For the five pillars in this study, a total of 29    of five indicators, all indicators will get a weight of 20%). The full list of
     objective indicators have been used.                                         indicators is described in the tables below.
        For the subjective assessment, this comes in the form of the percep-
     tion and assessment by key business executives – mostly shipowners

16                                                                                                                                                                 17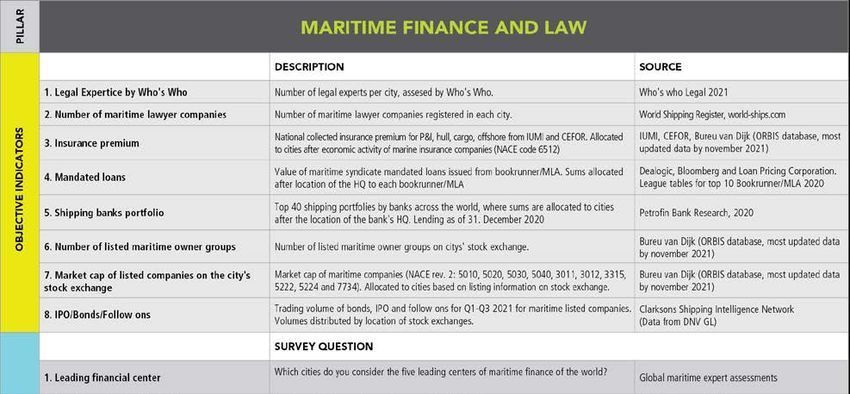
SHIPPING CENTERS                                                                                                 “The strong drive in digitalisation, as well
                                                                                                                  as having key stakeholders in close proximity
                                                                                                                  makes Singapore a global hub for shipping.”
     SUMMARY
                                                                                                                        – CARL SCHOU, CEO, WILHELMSEN SHIP MANAGEMENT

        1 2 3 4 5
     ATHENS              SINGAPORE              TOKYO                  SHANGHAI               HAMBURG

       W       hen assessing the importance of the
               world’s shipping centers, Athens,
       Singapore, and Tokyo take the top three spots
                                                            nant in terms of ownership, though this is grad-
                                                            ually changing, as Asian shipowners have taken
                                                            most of the fleet growth in the decade. Asian
       in the total ranking of the leading shipping         owners have increased their market share to
       centers, with Shanghai and Hamburg following,        42% of the global fleet, up from 36% in 2012 (in
       to complete the top 5 placements.                    terms of GGT), with Chinese owners clustered
          The rankings (when compared to 2019) are          in Shanghai and Hong Kong facilitating most
       in line with the recent growing sentiment and        of this change. The European share of the world
       shift seen in the shipping sector, with more and     fleet, however, has only fallen from 45% to 43%,
       more shipping operational activities moving to       so the remaining shares have been captured
       Asian maritime centers, resulting in traditional     from other continents.
       European shipping centers now populating the            Again, Athens has experienced a contrasting
       lower parts of the top 10 ranking. The excep-        development as fleet ownership and ship
       tion is Athens, whose owners and managers            management levels, in terms of tonnage, have
       have demonstrated high aversion to risk, stem-       increased by about 20% since 2019. The city’s
       ming from political and COVID-19-related             strengths lie in a large and strong ship owning
       economic uncertainties, and now sit firmly in        community, with Greek shipowners having
       the 1st position, ousting industry experts’ long-    played a key role in the industry for decades and
       time favorite, Singapore.                            expected to remain influential in the future. Its
          Globally, there has been a significant rise       maritime cluster also caters to this community,
       in the world’s fleet value in recent years, from     offering top-notch shipping services covering
       USD 873 bn in 2016, to USD 951 bn in 2019, to        shipping operations, and technical and crew
       about USD 1.2 tn in September 2021. The rise         management while employing qualified local
       in value is mostly attributed to the better ship-    talent. However, it is still being perceived as
       ping economic outlook that dominant market           primarily serving the local Greek shipping
       segments, such as the dry bulk and container-        companies and less so international ship-
       ship segments, have been experiencing in 2021,       ping entities, hence the experts have opted
       compared to the previous decade. At a city           to give their vote of confidence to other ship-
       level, the top 10 cities in terms of owned fleet     ping centers, predominantly Singapore and
       value control more than USD 570 bn, which            Shanghai.
       is approaching 50 percent of the world fleet’s          Singapore’s strength lies, to a large extent, in
       value, illustrating the importance of these cities   its geographic location on the East-West trade
       in the global world of shipping.                     lane and in proximity to populous markets,
          European cities have historically been domi-      such as the Chinese and Indian ones, and the

18                                                                                                                                                                 19
EXPERT ASSESSMENT shipping activities, both commercially and opera- They predominantly house Chinese owners and
tionally, and has also been an important meeting managers, but due to their tremendous growth,
Asian production bases. Singapore is a key location companies in Shanghai, empowered by such mecha- When considering the breakdown of the industry place for international shipowners. international players are starting to take notice
for shipping, and an important center for commercial nisms as the local pilot free trade zone, and the increased experts’ assessment for the shipping pillar, it can London may not be perceived as the leading and to consider establishing branches, ranking
management. It is home to the second largest fleet in uptake of digitalization practices in shipping operations, be seen from the figure below that experts per- maritime center anymore, in the eyes of the in- Shanghai 2nd, after Singapore, for choice of relo-
the world owned at city level and the second largest fleet to improve efficiencies and reduce associated costs. The ceive Singapore, London, Athens, Hong Kong, dustry experts, but its long-established and ex- cating shipping operations, and Hong Kong 4th.
and Shanghai as the leading shipping centers tensive maritime cluster continues to attract some Athens places 3rd on the subjective ranking of
managed from a city (both in terms of tonnage), and city is home to the Shanghai Containerized Freight
in the near future. Shipping executives, further- of the most successful shipping companies, as future leading shipping centers, with Greece’s
scores highly among experts on the subjective indica- Index (SCFI). Also appealing to industry experts are the more, indicate that in case their company had well as industry professionals globally. The ex- shipping magnates having emerged largely un-
tors, perceived as the leading shipping center to operate continuous efforts from local administrations poured to move their operational units, they would perts believe that London’s standing as one of the scathed from the country’s financial crisis and
out of, and the prime choice for relocating shipping into improving the city’s modern shipping services, such choose Singapore as the first option, followed by top shipping centers will not be challenged in the one of the shipping industry’s longest downturns
activities. Industry experts have also highlighted the as shipping finance, with vessel leasing quickly gaining Shanghai and Dubai. near future, but high costs associated with office during the 2010s. The city has been developed as
presence of many foreign owners in the city, illustrating traction from global shipowners, maritime arbitration, Unsurprisingly, Singapore’s strong holistic focus operations may disincentivize shipping compa- a principal ship owning and management location
on the maritime sector and the establishment of nies from relocating their operational unit there, due to its historical position as one of the great
Singapore’s global attractiveness. and other legal services.
a leading global maritime cluster grants the city choosing a less costly destination instead, and maritime centers and its highly qualified maritime
Tokyo has been a leading global shipping center for Hamburg has been struggling to keep up with other the top position in both assessments, by a wide thus ranking the city in the 5th place. workforce. However, it is largely perceived as ca-
decades, ranking 3rd in shipping overall in 2021. Tokyo- shipping centers in recent years. The ship owning margin. The city is attractive due to its location, Chinese centers, such as Shanghai and Hong tering mainly to the numerous Greek shipowners/
based owners have been increasingly taking up larger community had to face some unique challenges, the quality of life, and availability of a knowledgeable Kong, are coming up strong in the last decade, managers, and less so to international players,
stakes in key growing shipping segments, for instance reason for this being that a portion of their fleet has been work force. The Singapore government has for due to their proximity to the Chinese production thus it does not score as highly when viewed as a
many years supported this segment both finan- bases, needing streamlined shipping clusters to choice for relocation, ranking 9th overall.
being the top owners of LNG carriers globally and one financed through the KG system, i.e. by single purpose
cially, by establishing a stable, pro-business envi- facilitate the ever-growing export volumes. Thus Dubai has managed to acquire the 3rd place as
of the leading cities in terms of alternative fuel-capable companies with an asset manager (oftentimes related to ronment, and by taking a consultative approach they secure positions in the top 5 as candidates an appealing location for relocating shipping op-
tonnage ownership. They facilitate Japanese and global a technical ship manager) and hundreds of small equity to the sector. It has retained a strong position for for the leading shipping centers of the future. erations, due to the growing trade needs of the
trade by chartering out many of their vessels on long- holders, who had little insight in and control over their Middle East Region and a strong governmental
term contracts with established ship managers or vessel and its operation. Many of the KGs could not focus on providing incentives for attracting inter-
large players in the manufacturing and energy sectors, weather the storms of the global financial and shipping Fig. 1 - Score based on experts’ answers to “Which Fig. 2 - Score based on experts’ answers to “If your national investments. Overall, Dubai ranks 10th,
cities do you consider the five leading centers of company should consider relocating, which cities
ensuring stable sources for their earnings. Despite this, crisis and ultimately collapsed. Many capital holders shipping of the world?” would in your opinion be the most attractive just below some established European maritime
location for opertional units?”
several factors such as high office operational costs were disincentivized to continue investing in ship- Source: Menon Economics & DNV (2021)
Source: Menon Economics & DNV (2021)
centers. It is still not considered a leading shipping
have lessened Tokyo’s attractiveness as a base for ship ping and moved on to other opportunities, which in Score Score center by experts, but it is very quickly gathering
1000
1200
100
200
300
400
500
600
200
400
600
800
management, a sentiment that is also shared by the turn stunted Hamburg’s ship owning tonnage growth. traction among them as the dominant maritime
0
0
SINGAPORE SINGAPORE
industry experts. Regardless, due to their expertise, and proven track cluster in the Middle East Region.
LONDON SHANGHAI
Shanghai has shown phenomenal growth in terms of record, vessel management has remained in Hamburg
OBJECTIVE INDICATORS’ ASSESS-
ATHENS DUBAI
its maritime activities in recent years, forming a cluster for many vessels that changed hands to non-German
MENT
HONG KONG HONG KONG
of Chinese owners and international managers that owners, and the city remains a global hub for ship SHANGHAI LONDON
facilitate the bulk of the Chinese imports and exports, operations, hosting some of the most successful ship- HAMBURG ROTTERDAM
The figures used in this chapter present informa-
managing to edge out the competition from other ship- ping companies, including Hapag-Lloyd in container- OSLO HAMBURG
tion about the top 50 maritime cities globally.
ROTTERDAM MUMBAI
ping centers in the region, most notably Hong Kong. ships, Oldendorff Carriers in the dry bulk segment and There might be some cases where cities not in-
COPENHAGEN ATHENS
Global shipping organizations are taking notice, estab- Bernhard Schulte Shipmanagement. cluded in this sample objectively perform better
DUBAI COPENHAGEN
lishing regional headquarters, branches or other project TOKYO OSLO
on indicators included in this specific pillar.
However, such cities do not perform well enough
NEW YORK LIMASOL
on an overall level to be a part of the list of top
LIMASOL MANILA
MUMBAI KUALA LUMPUR
50 maritime cities globally and are therefore ex-
IMABARI HOUSTON
cluded in this chapter.
To be recognized as a leading center for
20 21shipping, a city must be the registered home to 105 million and 111 million CGT, respectively. depend on said market’s state and outlook. For respective positions relative to each other, have shipowners’/ship managers’ revenues are gener- ALTERNATIVE FUELS CAPABLE FLEET SIZE
a strong number of shipowners and managers, Singapore follows in 2nd place, with about 40% example, cities in the Gulf Area, such as Dubai, occurred. ated primarily from transporting general cargoes
both in terms of their fleet size as well as fleet more managed than owned tonnage, at 83 mil- Abu Dhabi and Doha, possess a high ratio of in the Middle East Region, crude oil or oil product In line with the recently adopted resolution to
value. The number of shipping companies that lion and 52 million CGT respectively, in contrast to offshore vessels, so the offshore market’s state TOTAL ANNUAL TURNOVER OF SHIPPING shipments originating from the local production reduce GHG emissions by 50% by 2050, some
chose to have their headquarters in a particular Tokyo, Imabari and Seoul, where there is close to greatly affects the value of the fleet in those cities. COMPANIES bases or serving the Gulf offshore rigs. Miami’s shipowners have started to install engines capable
city will further impact this city’s ranking in our 50% more owned than managed tonnage, show- Obviously, this phenomenon is weaker for cities score is based on the cruise company Carnival. of using alternative fuels on their newbuild pro-
benchmarking assessment of the objective indi- casing a different approach to successful shipping that showcase a variety of vessels in their owned The total annual turnover of shipping companies Athens, number 1 on the shipping pillar as a jects, such as LNG, LPG, or methanol. However,
cators for the shipping pillar. As a new addition norms and practices. fleets. located in each city can be an important indicator whole, scores poorly on this indicator. This is likely significant barriers still exist on many levels for
to this year’s report, shipping centers will also be Hong Kong and Shanghai have been rap- The world’s total fleet value is concentrated in of the local shipping community’s size and impor- due to lack of reporting of their economic results different fuels – ranging from technical matu-
judged based on their respective ownership, in idly climbing on this indicator in recent years, as Athens, Hamburg and in Asian centers, such as tance to the global shipping markets. It is impor- to the public. rity (of designers, yards, engine/equipment sup-
tonnage, of alternative fuels-capable vessels, a Chinese owners and managers add tonnage to Tokyo, Imabari and Shanghai, and the composi- tant to emphasize, however, that many shipping pliers, ship/cargo owners), fuel availability (from
sector which is expected to shake up the estab- their ranks, at a rate surpassing all other cities. tion of the merchant fleet differs between them. companies prefer not to have equity traded pub- NUMBER OF SHIPPING HEADQUARTERS feedstock suppliers, fuel suppliers and authori-
lished status quo in shipping and become one of Hong Kong has managed to win the 3rd place Athens may be best known for being home to licly and thus tend to keep their financial results ties), infrastructure (by fuel supplier, authorities,
the deciding factors that will make or break future from Hamburg, since 2019, in this combined a large tanker fleet, but the city also has a sub- hidden from the public to maintain their competi- The number of shipping companies located in a bunkering terminals, ports), capital expenditures
shipping companies. ownership/management measurement, but has stantial fleet within the bulk and gas carrying tive edge. These facts, coupled with differences in city may give a different perspective on the ship- (for shipowners, including support from incen-
not achieved Shanghai’s rate of growth. Shanghai segments. Tokyo has a well-diversified fleet con- reporting methods and local legal requirements, ping community than the value of the ships and tive schemes) and regulatory status (from IMO,
has easily surpassed London and now aims to take sisting of bulkers, containerships, ro-ro vessels makes measuring the financial results in each city revenues of the companies. Figure 7 shows the Class, regional and national). Shipowners must
on Tokyo, potentially indicating that it is the city and gas carriers. Hamburg is quite specialized a challenging task. number of shipping companies with headquarters weigh in these factors in their decision to invest
“To increase its attractiveness for mari-
with the potential to win over the bigger piece of within containerships, while Singapore has its The ranking on this indicator reveals a strong in each city, with Jakarta leading this indicator in alternative fuels-capable vessels, where the
time companies, Hong Kong should the Chinese ship management/ship ownership pie strength within tankers, bulkers, offshore and corporate factor, where several businesses might with 233 shipping companies registered there. initial investment costs for new technologies are
improve transparency, maintain the in the future. containerships. be grouped in one large corporation. Chinese Most of these are very small in size, operating high. To lower their investment risks, large ship-
legal system and focus on fairness.” Lastly, Jakarta has managed to land in the 8th Athens and Tokyo have recently added quite a cities, such as Beijing and Shanghai, are good small regional vessels that service the needs of the owners such as Mitsui O.S.K., BW Group and
place on this chart, up 3 places since 2019, de- few vessels to their arsenal, increasing their fleet examples. They showcase high turnover from archipelago islands. Athens follows closely with Angelicoussis Group secure long-term deals,
– Manager of a shipping company, Hong spite Indonesia being severely hampered by the value by about 20% from 2019 to 2021, viewing shipping activities, spread across a relatively small 221 shipping companies, but again the majority ranging from 5 to 15 years, with established char-
Kong COVID-19 pandemic. Its GDP/population growth vessel ownership as a prime form of capital invest- number of companies (with COSCO the largest are predominantly family-owned small enterprises terers like BP and Total, and then undertake alter-
levels, the regional trade volumes growth leading ment, and sit comfortably in the top positions. corporation), mainly due to the booming state of and exhibit low volumes of communication or co- native fuels-capable newbuild projects, with the
to higher needs for shipping tonnage, coupled Hamburg’s large stake in containerships and dry the containership market and the high global de- operation with each other. Singapore ranks 3rd, vessels deployed under charter contracts.
with the low office overheads, formulate a mix of bulk vessels, coupled with the respective markets’ mand for Chinese goods. attracting owners and managers from all around From a cities’ point of view, Athens and Tokyo
SIZE OF SHIPOWNERS’ FLEET AND MAN- favorable conditions for shipping activities. booming state, have elevated the city to the 3rd Copenhagen, London and Marseille also retain the world, servicing every segment of the ship- lead comfortably in terms of alternative fuel-ca-
AGEMENT OF FLEET position in terms of total vessel value. Shanghai high positions in total turnover, mainly due to the ping industry, and the city owes much of its suc- pable tonnage, owning about 1.3 and 1.2 million
VALUE OF CITY-CONTROLLED FLEET houses the bulk Chinese-owned ocean-going presence of very large shipping corporations (AP cess to the incentives provided by Singaporean GT respectively. With less than half of the alterna-
In the figures below, cities are ranked by the size fleet, including the fleet of COSCO Shipping, the Moller-Maersk Group, BP Shipping, CMA CGM Register and the active role of MPA Singapore in tive fuel-capable tonnage compared to Athens or
of total fleet in compensated gross tonnage (CGT) Another means of benchmarking the cities is by largest shipowner in the world in terms of total etc.), of which some are traded publicly on na- attracting shipping companies to the city. There Tokyo, shipowners in Oslo, London and Marseille
based on shipowners and ship managers located considering the value of the fleet owned from gross tonnage, whose aggressive tactics in ship tional or foreign stock markets, and their corpo- are far fewer shipping companies based in the nevertheless demonstrate an increased rate of
in each city. For an international industry like the these cities. As opposed to the size of a fleet, fleet acquisition and ship newbuilding have contributed rate reporting requirements provide a high level trailing cities of Rotterdam, Hamburg, Tokyo, integration. In the rest of the top Asian shipping
shipping business, ownership and management value offers a better reflection of its economic im- to Shanghai taking the 4th place from Singapore, of transparency. Imabari and Shanghai, but these are, for the most centers, such as Seoul, Shanghai and Singapore,
of companies can easily be split up to take advan- portance. This evaluation is based on data from which is now almost in a tie with Imabari for the Tokyo gets the 3rd position and Seoul is ranked part, large corporations, owning a diverse port- local owners have not yet invested significantly
tage of specialized local competence and cost dif- Clarksons World Fleet Register with the estimated 5th position. Copenhagen is following in the next 7th, with companies’ reports indicating that they folio of vessels. Dubai and Istanbul have become in environmentally friendly tonnage compared to
ferentials in different cities. Data was compiled for value of the share of the fleet controlled from the place, to a large extent due to the world’s most generate most of their annual revenues from attractive locations for shipping operations in the European cities.
the entire world fleet and vessels were then as- city. valuable shipping company, Maersk. chartering out their owned vessels to established last decade, with offices being established pri-
signed to the individual cities where their owners The current state and economic outlook of the Cities making up the rest of the top 10 have ship managers worldwide, on medium- to long- marily by local operators active in feedering and
and managers are located. underlying shipping segments play an important all witnessed an upward trend in terms of their term contracts. Hamburg and Oslo follow in the servicing the regional trade requirements (Gulf
On this indicator, Athens comes out strongly role in measuring a vessel’s value, meaning that fleet’s total value since 2019, due to the afore- next places, both with a fairly high number of area, Black Sea, East Mediterranean area), and the
in the 1st position, both in terms of shipowners’ if a city’s fleet is largely concentrated in a specific mentioned favorable state of most shipping mar- medium-size shipping companies. offshore and passenger sectors.
and managers’ operating tonnage, at about segment, then the fleet’s value will also largely kets, but not many individual changes in their Finishing the top 10 is Dubai, where the
Fig. 3 - Size of fleet (CGT) owned by shipmanageres Fig. 4 - Size of fleet (CGT) controlled by shipowners Fig. 5 - Fleet value assigned to cities Fig. 6 - Operational revenue (turnover) for shipping Fig. 7 - Number of shipping companies registered in Fig. 8 - Environmental impact of shipowners’ fleet -
registered in the city registered in the city companies the city with more than 5 vessels measured as share of fleet (in GT) with low carbon
Source: Clarksons Research & Menon Economics (2021)
Source: Clarksons Research & Menon Economics (2021) Source: Clarksons Research & Menon Economics (2021) Source: Bureau van Dijk (2021) Source: Clarksons Research & Menon Economics (2021)
intensive fuel types, including current fleet and
orderbook
Source: Clarksons Research & DNV & Menon Economics (2021)
Million CGT Million CGT Billion USD Billion USD Number of Companies Million GT
1000
1200
1400
120
120
100
120
140
160
100
150
200
250
200
400
600
800
40
80
20
40
60
80
-
-
40
80
20
40
60
80
50
0
0
0
0
ATHENS ATHENS ATHENS BEIJING JAKARTA ATHENS
SINGAPORE SINGAPORE TOKYO SHANGHAI ATHENS TOKYO
HONG KONG TOKYO HAMBURG TOKYO SINGAPORE OSLO
HAMBURG HAMBURG SHANGHAI COPENHAGEN ROTTERDAM LONDON
SHANGHAI HONG KONG IMABARI LONDON HAMBURG MARSEILLE
LONDON SHANGHAI SINGAPORE MARSEILLE TOKYO SEOUL
TOKYO SEOUL COPENHAGEN SEOUL ISTANBUL COPENHAGEN
JAKARTA IMABARI SEOUL HAMBURG IMABARI SINGAPORE
ROTTERDAM LONDON LONDON OSLO SHANGHAI HAMBURG
DUBAI JAKARTA OSLO DUBAI DUBAI KUALA LUMPUR
BUSAN ROTTERDAM ROTTERDAM MIAMI HONG KONG DOHA
LIMASOL COPENHAGEN TAIPEI TAIPEI SEOUL SHANGHAI
COPENHAGEN OSLO GUANGZHOU PANAMA CITY NINGBO HOUSTON
ISTANBUL TAIPEI MARSEILLE SINGAPORE LONDON GUANGZHOU
IMABARI GUANGZHOU MIAMI XIAMEN OSAKA HONG KONG
22 23You can also read