The future of personal wealth and inheritance taxation in Norway - Maciej Pekala - Master Thesis for master students at Economics Department of ...
←
→
Page content transcription
If your browser does not render page correctly, please read the page content below
The future of personal wealth and
  inheritance taxation in Norway

               Maciej Pekala

Master Thesis for master students at Economics
      Department of University of Oslo

                 May 2013

                      i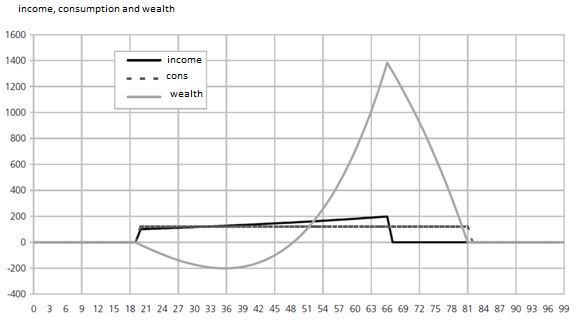
ii
The future of personal wealth and
 inheritance taxation in Norway

                iii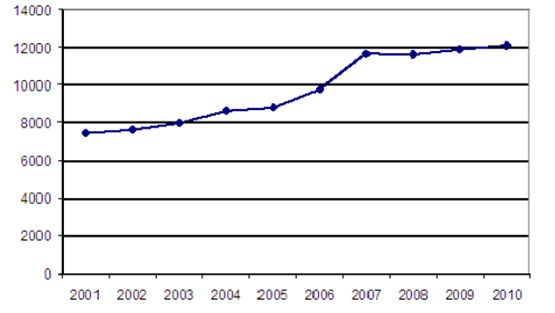
© Maciej Pekala

2013

The future of personal wealth and inheritance taxation in Norway

Maciej Pekala

http://www.duo.uio.no/

Trykk: Reprosentralen, Universitetet

                                             iv
Summary

Many countries have recently abandoned or experienced significant reduction in tax rates and
revenues from personal wealth and inheritance taxation. Today, Norway remains one of the
few countries that still tax annual wealth and intergenerational wealth transfers. Both taxes
however face a substantial opposition and their future remains uncertain. In this paper, a
dynamic microsimulation model MOSART developed by Statistics Norway is used to project
and discuss future revenues and distributional effects of the annual wealth and inheritance
taxes in Norway between year 2010 and 2040. The main questions discussed are: what are the
future revenue effects of these taxes and what effect will they have on the distribution of
wealth. Different scenarios are analysed and compared. The model predicts that average
taxable wealth will significantly increase within the simulation period, which results in
substantial increases in revenues from both wealth and inheritance taxes. In order to measure
distributional effect I look how the average wealth will change across different percentiles
(10 equal size groups divided according to net amount of wealth owned) and I use Gini
coefficient as a measure of wealth inequality. The simulation results show that wealth
inequality measured by Gini coefficient is going to decline between 2010 and 2040. Both
types of taxes have a significant contribution to overall reduction in wealth inequality in the
long run. It is estimated that around 11% of the total decrease in Gini coefficient between
2010 and 2040 under baseline scenario is due to appliance of wealth and inheritance tax.
Moreover, it appears that each year higher proportion of total reduction in Gini coefficient
under baseline scenario can be attributed to wealth and inheritance taxes. Furthermore, I look
what impact the removal of both taxes would have on the wealthiest individuals in Norway.
In a current system of capital taxation (a dual income tax) wealth tax is thought to play an
important supplementary role to ensure high progressivity on top of the income and wealth
distribution. In a direct sense, it appears that removal of both taxes in the long term would
mainly benefit the wealthiest individuals and since a substantial amount of their total tax
comes from annual wealth taxes it would significantly reduce their tax payments. The
likelihood of the projection being correct under this study is however limited to the accuracy
of underlying assumptions and depends on various political decisions on national and
international level.

                                              v
Acknowledgements
I would like to thank my supervisor Thor Olav Thoresen for helping me throughout the
period of writing this paper. I would also like to thank Dennis Fredriksen for helping me with
simulation and explaining how the MOSART model works. I am grateful to both Zofia
Pokomeda and Ciara Gibson for reading this paper and giving me valuable feedback. I would
also like to thank my wonderful family – my mother, my father and my brother for
continuing support.
viContents Page No:
List of Tables
Table 1: Norwegian wealth tax – current rates 3
Table 2: Inheritance tax – current rates 4
Table 3: Wealth tax rule changes over time 5
Table 4: Tax revenues in Norway, 2011 8
Table 5: Changing sources of tax revenues in Norway, 1880-1940 9
Table 6: Wealth tax in the OECD countries 10
Table 7: Effective tax rates on the real income from different assets 18
Table 8: Main underlying assumption with the perspective from 2010 32
Table 9: Regression results – saving equation 35
Table 10: Regression results – the probability of owning a house 36
Table 11: Change in Gini coefficient due to wealth and inheritance taxes 49
Table 12: Top 10% wealth share divided into 10 equal sized groups according 51
to rising wealth (million NOK)
List of Figures
Figure 1: Average wealth taxes payment and proportion of tax payers 6
Figure 2: Wealth tax – revenue by year (million NOK) 7
Figure 3: Revenues from gifts and inheritance taxation in 2010 8
Figure 4: Country ranking by mean and median wealth 12
Figure 5: Deadweight loss 15
Figure 6: Marginal tax on wages and dividends 21
Figure 7: Average assessed tax as a share of gross income 22
viiFigure 8: Top 1% wealth share divided into 10 equal sized groups 23
according to rising wealth
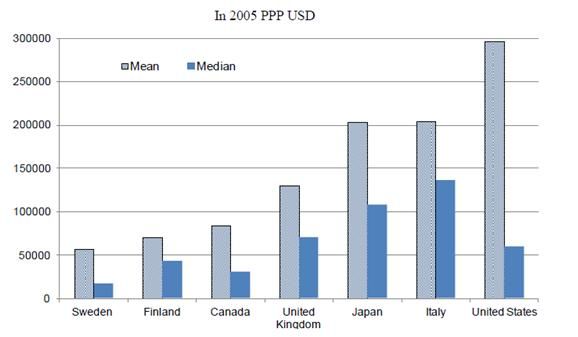
Figure 9: Example of wealth development over the lifecycle model 39
Figure 10: Average wealth by age 40
Figure 11: Pension to labor income ratio 41
Figure 12: Average savings under baseline scenario 42
Figure 13: Wealth tax revenues 43
Figure 14: Number of recipients 44
Figure 15: Tax on private inheritance 45
Figure 16: Changes in average wealth distribution (baseline scenario) 46
Figure 17: Changes in Gini coefficient baseline vs. second scenario 47
Figure 18: Wealth distribution 2010-2040 50
Figure 19: Difference in changing wealth distribution under two assumptions 51
Summary
SECTION ONE: Introduction 1-2
SECTION TWO: Norwegian wealth and inheritance tax 3-13
2.1 Schedules and valuation 3-4
2.2 Wealth tax - development over time 5-6
2.3 Current revenues and relation to other taxes 7-8
2.4 The international perspective 9-10
2.5 Political and international challenges 11-13
SECTION THREE: Efficiency and equity concerns of the current system of wealth and
inheritance taxation 14-24
viii3.1 Theoretical background 14-16
3.2 Current distortion and undesirable characteristics related to wealth and inheritance
taxation 17-19
3.3 Equity concerns - wealth and inheritance taxation under
dual income tax system 20-24
SECTION FOUR: Review of empirical literature 25-28
4.1 Wealth tax - economic implication and indirect effects
4.2 Wealth transfer taxes – economic implication and indirect effects
SECTION FIVE: The future revenues and distributional effects of wealth 29-52
and inheritance taxes
5.1 Dynamic microstimulation introduced 29-31
5.2 The MOSART model 32-38
5.3 Simulation results and discussion 39-52
SECTION FIVE: Conclusion 53-54
List of references 55-59
Appendix 1 60
Appendix 2 51-65
Appendix 3 66-68
ix1. Introduction
Due to widespread criticism and difficulties with taxing capital stocks such as personal
wealth, inheritance and gifts, many countries have recently reduced or fully abandoned
wealth related taxes. Today, Norway remains one of the few countries in the world still
imposing both annual wealth and intergenerational wealth transfer taxes (taxation of
inheritance and gifts). Given however the recent international trends and the number of
difficulties associated with taxing wealth and bequests, the future of both taxes is uncertain.
Norwegian wealth tax is today widely discussed among policy makers and whether it will
survive seems to depend on various outcomes on national and international levels. The
purpose of the present study is to discuss the future of annual personal wealth and inheritance
taxes in Norway. I do this by presenting the contribution from these taxes to tax revenues and
tax burden distributions in coming years. In order to do so, a dynamic microsimulation model
developed by Statistics Norway MOSART is used. When using the empirical measures and
results obtained from the simulation the paper discusses the future economic effects, such as
revenues and impact on wealth distribution in the future. The results obtained in this paper
may be useful information for social planners as future tax revenues and burden distributions
is important information in the planning process.
In addition, the paper outlines the current rates, revenues and latest changes related to both
taxes in Norway. Special attention is paid to current rules governing the taxable individuals
and asset valuation since some of the rules are believed to valuate some of the main
principles of capital taxation. Further, I discuss the wealth and inheritance taxes relation to
overall tax system in Norway and present various arguments pro and against these types of
taxes. It will be argued for example that recent reforms related to the dual income tax system,
with a flat tax rate on capital income and a wealth tax as a supplement, have improved the
redistributive effect of capital taxation. I will also refer to the literature on wealth and
inheritance related taxes, in order to have a better understanding of their overall economic
effects. One of the lessons emerging from this review is that the empirical analysis are not
always providing a unified and clear picture on how these taxes work and what are their
economic impacts. It will be argued that despite the widespread abolition of both taxes in
Europe in recent decade there is still potential for these taxes to be used. Due to highly
skewed net wealth distribution in Norway and most of the other European countries,
combined with aging population and increasing budget deficits, it is important to preserve a
1broad tax base, and to maintain tax redistributional effects. In order to finance the costs of the
crisis and reduce budget deficits wealth-related taxes are being discussed in many European
countries (DB Research, 2012). The simulation results will be used to discuss to what extent
taxes on wealth and inheritance can be used to reduce growing budget burdens and mitigate
highly unequal wealth distribution in Norway.
The rest of the paper is organized as follows: Section 2 gives an overview of current
schedules and valuation rules related to wealth and inheritance taxes in Norway. It examines
the recent changes in both types of taxes and their development over time and outlines both
taxes in an international context. In addition the section discusses current and future political
challenges related to wealth and bequest taxation on national and international level. In
section 3 some of the main weaknesses and distortions of current system are discussed. This
section also discusses the supplementary role of annual wealth taxes in dual income tax
system. Section 4 reviews the most recent empirical studies related to wealth and inheritance
taxes. Section 5 gives a detailed introduction to dynamic microsimulation method, describes
the MOSART model and various necessary underlying assumptions and gives a detailed
description of wealth and inheritance modeling in the program.
Finally simulation results under different underlying assumptions are provided and discussed.
Section 6 summarizes the findings and indicates directions for related future research.
22. Norwegian wealth and inheritance tax
2.1 Schedules and valuation
2.1.1 Wealth tax
In Norway a flat net wealth tax of a total 1.1% (up to 0.7% municipal and 0.4% national) per
year must be paid by citizens with net wealth value above the certain threshold, see Table 1.
A wealth tax is a tax on the accumulated stock of all taxable assets. The assets include, for
example, cash, bank deposits, the value of own house, savings in insurance and pension
plans, corporate assets and financial securities. It is the net wealth minus total financial debt
that is subjected to taxation. The tax is based on the fair market value of the owner’s net
assets, as of 1st of January in the year of the tax assessment.
Table1. Norwegian wealth tax – current rates
Wealth tax – 2013 rates Individuals Married couples
Local
Personal allowance 870, 000 NOK 1, 740, 000 NOK
Rate 0.7% 0.7%
National
Personal allowance 870, 000 NOK 1, 740, 000 NOK
Rate 0.4% 0.4%
Source: Skatteetaten (2013)
While interest bearing accounts and shares are valued at 100%, different rules apply for
example to real estate and individual private pensions (IPS) which are completely exempt.
When it comes to owner occupied and rental housing, only a portion of their value is included
in the tax base (25% and 40% respectively). Married couples without any other assets to own
are permitted to own a debt-free residence worth up to 7 million NOK without having to pay
net wealth tax.
32.1.2 Inheritance and gift tax
Both inheritance and gift taxes apply in Norway and are among the main taxes on capital
stocks. Unlike estate tax which is assessed on the assets of the deceased and is paid by the
donor, inheritance tax is a levy paid by a donee and is assessed on the value of the inherited
assets (Gale et al. 2001). The calculation of inheritance and gift tax is based on the total
assets that are passed on to the heirs of the deceased and is paid by the heirs. In 2013, wealth
transfers and gifts amounting up to 470, 000 NOK are not subject to any taxation. Inheritance
or gifts for the next 330, 000 NOK to parents or children are subjected to 6% tax or 8% to
others. Above this level the rates are 10% and 15% respectively, see Table 2. The tax is
levied when a person dies. Transfers between married or civil partners, whether during
lifetime or on death, are generally exempt, as are gifts to charities. The valuation system of
the inheritance and gift tax is normally based on market value at the time when the recipient
receives the estate or gift. As with annual taxes on wealth, the tax is levied on the net amount
and special schedules apply, for example, to unlisted shares, participations in partnerships or
farms (Denk, 2012). Some of the exemptions and reliefs are listed in Appendix 1. Both
bequests and gifts are accumulated in the calculation of the tax base, otherwise gifts would be
a mean of avoiding inheritance tax. Not all gifts are taxable and Appendix 1 gives a list of
some exemptions.
Table 2. Inheritance tax – current rates
Inheritance tax First 470,000 NOK After next 330,000 Above that
NOK
To each child, foster None 6% 8%
child or parents
To others None 10% 15%
Source: Skatteetaten (2013)
42.2 Wealth tax - Development over time
Annual wealth tax has been subjected to radical changes over the last few years, see Table 3.
Due to the increasing threshold (annual allowance), the number of people affected by the tax
has been constantly declining.
Table 3. Wealth tax rule changes over time
Year Individual allowance Married allowance (NOK) Equity discount
(NOK)
Local (0.4%)/National Local (0.4%)/National
(0.4%) (0.4%)
2005 151,000/540,000 151,000/580,000 35%
2006 200,000/540,000 400,000/1,080,000 20%
2007 220,000/540,000 440,000/1,080,000 15%
2008 350,000/540,000 700,000/1,080,000 0%
2009 470,000/470,000 940,000/940,000 0%
2010 700,000/700,000 1,400,000/1,400,000 0%
2011 700,000/700,000 1,400,000/1,400,000 0%
2012 750,000/750,000 1,500,000/1,500,000 0%
2013 870,000/870,000 1,740,000/1,740,000 0%
Source: Skatteetaten (2013)
In 2013 the threshold increased by 16% to currently applying 870,000 NOK (1 740 000 NOK
for couples) from 750,000 NOK in previous year. According to the Ministry of Finance this
will result in reduction in individuals paying wealth tax by around 50,000. It is estimated that
the above changes will lead to tax reduction for around 590,000 individuals while the
wealthiest individuals affected by the tax will experience higher tax burden. In addition to
changing thresholds, the equity allowance that allowed 35% of the total value of equity
holdings to be excluded from the tax, and an 80% rule where the tax was applied until the
point where the total tax obligations exceeded 80% of the individual’s ordinary income was
abolished in 2009.
In effect, annual wealth tax today is thought to play a more important role in the
redistribution policy. The overall changes in personal allowance and removal of 80% rule has
5shifted the tax burden to more wealthy citizens, resulting in more tax being paid by
individuals at the high end of the wealth distribution but without necessarily reducing the
revenue from wealth taxation, see Figure 1.
Figure 1. Average wealth taxes payment and proportion of tax payers
Source: Ministry of Finance (2013)
In 2013, it is estimated that around 16% of taxpayers will be paying wealth tax. Since 2005
the number of taxpayers affected by the tax has decreased by nearly 50%. According to
Ministry of Finance (2013) there are relatively few people in Norway paying annual wealth
tax. Furthermore, out of 650,000 taxpayers affected in 2011 the vast majority paid a relatively
small amount. There were 571,075 citizens who paid less than 25,000 NOK in form of wealth
taxation (6,214 NOK in average). More than 22% of total tax revenue however is paid by the
wealthiest. In 2011 the wealthiest 852 Norwegian taxpayers paid around 3.3 million NOK on
average. For these few wealthiest citizens wealth tax made up of around 81% of total tax
obligations. Thus, it seems clear that removal of annual wealth tax in Norway would mainly
benefit the wealthiest.
62.3 Current revenues and relation to other taxes
Despite the decreasing number of individuals paying wealth tax in recent years (in 2012 it
was estimated that around 17% of Norwegian tax payers paid wealth tax), the total revenue
from wealth taxation has been increasing during the last ten years, see Figure 2.
Figure 2. Wealth tax – revenue by year (million NOK)
Source: Edson (2012)
In 2011 the wealth tax generated around 13 billion NOK, together with inheritance and gift
taxes the total revenue amounted to around 15 billion NOK. This was slightly more than 1%
of total tax revenues.
7Table 4. Tax revenues in Norway, 2011
A broad tax base (billion NOK)
Income tax 265
Employee's social insurance 98
Tax on Wealth 13
Business 72
Property tax 7
Employee's social contribution 139
VAT 212
Excises and custom duties 102
Petroleum tax 245
Inheritance and gift tax 2
Other taxes 29
TOTAL 1184
Source: Statistics Norway (2013)
The contribution to national budget from inheritance and gift taxes is very modest, see Table
4. In 2011 the tax generated around 2 billion NOK and in terms of overall contribution to the
annual budget the revenues from inheritance taxation are below the Organisation for
Economic Co-operation and Development (OECD) average (Denk, 2012).
Figure 3: Revenues from gifts and inheritance taxation in 2010
Source: Denk (2012)
82.4 The international perspective
The wealth related taxes such as periodic taxes on land, live stocks and other forms of visible
wealth are believed to be among the oldest sources of government revenue. Annual taxes on
wealth were introduced in Scandinavia and then in some other European countries at the
beginning of the 20th century. India has also followed in 1957 and today it is one of the only
countries outside Europe that still imposes tax on net wealth (Glennerster, 2012). Countries
such as Japan or Ireland introduced a wealth tax for a brief period. Other countries such as
USA, UK, Australia or Canada have never had wealth tax. Historically wealth tax has been
often used as an unordinary or emergency tax for financing the war costs or as a way to
mitigate high government debts. It was believed then that wealthy citizens had a duty to
contribute and support their governments under certain circumstances (Rudnick and Gordon,
1996). In later years however the tax became permanent and the rates tended to be relatively
lower. In the mid-eighties, half of the twenty-four OECD countries imposed a net annual
wealth tax. In Norway, at the end of the 19th and beginning of the 20th century property and
wealth as well as inheritance taxes were among the most important budget sources. Since
then income taxes have become more important, see Table 5.
Table 5. Changing sources of tax revenues in Norway, 1880-1940
Source: Stranger (2009)
Recently taxes on annual net wealth have been systematically abolished in most OECD
countries. Austria, Denmark and Germany abandoned them in 1997; Finland, Iceland and
9Luxembourg in 2006, Sweden in 2007 and Spain in 2008. Today, Switzerland, France,
Norway and Spain (Spain reintroduced the tax for a limited period in 2011) are among the
only OECD countries were wealth taxes still apply, see Table 6, (Bertocchi, 2007). In France
so called solidarity tax on wealth has been substantially revised by law in recent years. The
tax is imposed on French and non-French residents located in France whose worldwide assets
are valued at or above €1,300,000 (Ernst & Young, 2012).
Table 6. Wealth tax in the OECD countries
1985 2012
Austria Norway
Denmark France
Finland Switzerland
France Spain (reintroduced in 2011 for a limited
Germany period)
Iceland
Luxemburg
Netherlands
Norway
Spain
Sweden
Switzerland
When it comes to inheritance and gift taxes similar pattern however less drastic can be seen.
Taxes on wealth transfers are thought to exist since the eighteenth century and are believed to
be first imposed in Denmark (Ministry of Finance, 2000). Several countries of the world have
recently abolished or significantly reduced their taxes on bequests. Canada, Australia,
Austria, Russia, New Zealand, Italy (however re-established in 2006) and Sweden have fully
abolished taxes on wealth transfers in recent years and for many others the importance of the
tax in terms of Gross Domestic Product (GDP) and total revenues is now at a historical low
point. Among 27 EU countries, a majority (15) have an inheritance tax. There are also four
EU countries with an estate tax with Denmark as an only country with both taxes (Ernst &
Young, 2012).
102.5 Political and international challenges
So far Norway has not conformed to international trends of removing its annual wealth tax
but rather reformed it so today it only affects individuals with the highest levels of wealth.
The above trends however place the country in a difficult position. First, due to relatively low
revenues from both taxes, budgetary concerns should not be an obstacle to remove or
substantially reduce annual wealth and inheritance taxes if the trade of between equity and
efficiency becomes too unfavorable. Secondly, as fewer countries impose wealth related
taxes the possibility of substantial outflow of capital and discouraged investment can become
significantly higher. Among three other remaining countries imposing annual wealth taxes,
only France (where wealth tax has been causing a lot of controversy in recent years) has
higher rates, while in Switzerland the tax is mainly justified by non-existing capital gain taxes
(Ernst & Young, 2012).
Norwegian wealth tax is today widely discussed in political circles and its future seems uncertain.
The tax is believed to divide Norway equally between its opponents and proponents and
whether individuals are for or against it often depends on their social status and political
belongings (NHO, 2013). If the ambition of Norwegian government will be to retain both
taxes, the future developments on national and international level can be crucially important.
Lately, increasing income and wealth inequality and growing budget deficits in many OECD
countries have spurred the discussion of reintroducing a wealth tax in a number of countries.
In recent years lower marginal tax rates on top labour and capital incomes and removal of
wealth related taxes made the accumulation of wealth easier for the rich. In Norway the
distribution of net wealth between different social and age groups became very uneven.
According to the recent report by Statistics Norway, the distribution of net wealth in Norway
is highly skewed. While average wealth per household is equal to around 1.6 million, the
median net wealth is 900, 000 NOK. The wealthiest 10% of households is estimated to own
around 53% of total wealth and the richest 1% control 21%. Similar imbalances can be also
spotted among different age groups. Here while most of the oldest households hold a
substantial amount of wealth, the net average wealth among households headed by someone
younger than 30 years of age is close to zero (Epland, 2012). In international perspective, the
situation seems even gloomier.
11Figure 4. Country ranking by mean and median net wealth
Source: Bonesmo (2012)
Furthermore, according to OECD study, due to the population ageing and declining fertility a
share of the population older than 65 as a share of population aged “15+” will more than
double in most European countries reaching more than 60% in some cases (Johansson, 2012).
This in effect is likely to add an upward pressure on already high public spending on pensions
and health care and without any tax reforms will further increase public debts.
The above facts raise an obvious question: How according to optimal tax theory should the
social planners respond to higher burden without distorting economic efficiency and still
maintain high level of progressivity? Today in order to finance the costs of the crises, higher
taxes on wealth are being debated in many OECD countries. There is a clear recognition that
austerity measures in their own form might not be enough to combat the deficit crises and
some tax increases are necessary. Here in some of the countries (especially these strongly
affected by the debt crisis) a larger role for general wealth taxes has been advocated
increasingly loudly. In 2011 Spain reintroduced (for a limited period of time) its annual
wealth tax. In countries such as England or Cyprus where apart of wealth transfer taxes, taxes
on annual wealth have never been used the idea of introducing “Mansion tax” or one time
capital levy has been recently proposed (BBC, 2013). Reintroduction of wealth tax in order to
mitigate increasing income and wealth inequality has been also discussed in Sweden,
Denmark and Germany (Bach and Steiner, 2011). Such a policy however often lacks a
12political will as its long term impacts on future fiscal policy are quite uncertain. Nevertheless,
as more countries are struggling to repay their deficits, the role of wealth taxes as an
emergency or eventually permanent means to combat the crises might slowly emerge. If the
political ambition of the Norwegian government will be to retain annual taxes on wealth and
wealth transfer taxes the further development on an international scale will be of crucial
importance. Some of the current rules governing the taxable individuals and asset valuation
might however need to be changed. The attempt of the next section is to discuss current
issues related to efficiency and equity concerning wealth and wealth transfers taxation. The
section will outline both taxes in relation to the current method of capital taxation in Norway
and discuss their supplementary role. I will also refer to various empirical and theoretical
arguments pro and con wealth related taxes to have a better understanding of their direct and
indirect impact on economic performance.
133. Efficiency and equity concerns of the current system of wealth and inheritance
taxation
3.1.1 Theoretical background
The equity – efficiency trade off is one of the main challenges facing social planners when
designing optimal tax structure. The optimal taxes will usually attempt to balance two
conflicting goals of a tax system by achieving smallest efficiency losses with high level of
revenues and redistribution of income and wealth. The tax system should be designed in
accordance with main principles which in addition to efficiency and fairness (equity) include
administrative simplicity, flexibility and political responsibility. Equity implies that people
with greater ability ought to pay higher proportion of their incomes in taxes (vertical equity)
and that people with a similar ability should pay equal amounts (horizontal equity) (Stiglitz,
2000). In addition, taxes should be neutral with respect to various economic decisions; “A
neutral tax can be defined as one which does not change the decisions of the individuals
compared to what they would have decided with a lump-sum tax” (Andersson, 1987 pp.5). In
principle the tax should not distort the allocation of the recourses and the investment in the
economy throughout having an impact on an individual’s decisions. In terms of efficiency,
lump-sum taxes are often described as ideal as no change in behaviour can affect the level of
tax (Hindriks and Gareth, 2006). Such taxes however are almost never used in practice. This
is because in order to achieve high level of redistribution they would have to be imposed
uniformly on each individual according to his/her ability and preferences. Thus, the fact that
lump-sum taxes are levied on private information makes them extremely impractical. Most of
the tax instruments that are used in practice are not lump-sum, and they are likely to create
welfare loses by affecting individual’s behavior and causing various distortions to economic
activities. For example, high progressive taxes on income induce individuals to substitute
labor for leisure; commodity taxes will usually affect consumption patterns by shifting away
from highly taxed goods to low taxed. These marginal responses, which economists call
substitution effects, are thought to be the main causes of tax-induced distortions. The excess
burden (deadweight loss) caused by such taxes is often described as a difference between
total social losses due to tax and the total revenue collected by the government (Hindriks and
Gareth, 2006).
The simple graphical expression such in Figure 5 can be used to approximate and illustrate
the concept of excess burden caused by the tax introduction. Here, the imposition of the tax
14(t) causes price increase from (p) to (q=p+t). This in effect leads to decrease in quantity
demanded dX ( - ) and reduction in consumer surplus from (abc) to (aef). The part of the
consumer surplus has been turned into tax revenue (cdef), the other part however (ebd) is the
deadweight loss (the extent to which reduction in welfare exceeds the revenue raised).
Figure 5. Deadweight loss
Source: (Hindriks and Gareth, 2006).
The following formula can be used to calculate the deadweight loss (bde). First, the triangle
area (bde) is equal to tdX. Second noting that elasticity of demand can be defined as
= implies that dX= dp, where dp=t. By substituting this into the equation for
(bde) it is possible to obtain a formula for deadweight loss which is:
DWL=
The above equation reveals three interesting features. First the excess burden is proportional
to the square of the tax rate (it will rise with the increasing rate as the tax rate is increased),
second the deadweight loss is proportional to elasticity of demand – it will be larger with
more elastic demand. Third, it depends on the size of the market for taxed good. In effect, in
15order to minimise the distortion the tax rates should be as low as possible (a progressive tax
structure is likely to create higher distortions than a flat rate structure). Furthermore, taxes
should be imposed mainly on goods and items which are demand inelastic (for example
necessities that are difficult to substitute). Third, the tax bases should be broaden across wide
range of goods, services, income etc. One of the key questions when designing optimal tax
system is how to minimize this deadweight loss.
3.1.2 Wealth and inheritance taxes in relation to optimal tax theory
Both wealth and inheritance taxes can be judged according to above principles. It is
sometimes argued that taxation of capital stocks such as land or immobile properties is
closely related to lump-sum taxes (Hindriks and Gareth, 2006). Low tax rates imply that
deadweight loss from such taxes should be relatively low. In addition, they are difficult to
substitute, for example in case of estate taxes once the person has died he/she is unable to
choose any other action. Both taxes are also often regarded as optimal supplements to capital
gain taxation by helping to broaden the tax bases across wide range of assets. Thus, on the
efficiency ground, it could be sometimes argued that one should use wealth and inheritance
taxes rather than progressive taxes on capital income. Unlike lump-sum taxes however both
wealth and inheritance taxes are not neutral. Both taxes are likely to affect individual’s
behaviour and shape individual’s investment decisions. They are likely to affect individual’s
labour supply, saving decisions and investment incentives. Moreover, theoretical efficiency
of lump-sum taxes rests on relatively low imposition costs and administrative simplicity. This
is however not the case with annual wealth and inheritance taxes as due to measurement and
valuation difficulties their collection and administrative costs are usually very high
(Anderson, 1987).
The attempt of the next section is to point at some of the distortions and challenges related to
current system of wealth and inheritance taxation in Norway.
163.2 Current distortion and undesirable characteristics related to wealth and inheritance
taxation
3.2.1 The wealth tax
Current rates and valuation methods are believed to be one of the main forces shaping
investment decisions and allocation of assets among Norwegian households (Denk, 2012).
Combination of low property taxes and differential treatment of properties in the valuation of
wealth tax bases are thought to influence individual’s investment and saving decision. The
fact that only a small fraction (25%) of property value is subjected to annual wealth taxation
and difficulties with estimating the real market value of properties encourages investment in
real estates. According to (Epland, 2012, p. 16) “The tax-assessed value of own dwellings
registered in the Tax Return in 2009 was ‘only’ NOK 664 billion NOK which was about 19%
of the estimated market value)”. In 2009 the estimated gross wealth of Norwegian households
amounted to 5,478 billion NOK. The single most important wealth component was the
housing wealth which amounted to almost 65% of total gross wealth (Epland, 2012).
In addition, neutrality of the investments implies that effective tax rate (ETR) should be the
same across different types of assets. However, the differential treatment of certain assets
implies substantial differences in ETR under certain investments. As the recent report by
OECD shows, due to excessive effective tax rates, the wealth tax penalises savings and
investment and thus might have a negative impact on economic growth. If the base of the
wealth tax includes all taxable assets, ETR for wealthy individuals in case of certain
investment types might be twice as high as in case of less wealthy investors. This in effect
contradicts with the current system of capital taxation where capital is taxed at a flat rate
regardless of income and wealth. With 4% nominal rate of return and inflation of 2% the
effective tax rate for investors paying wealth taxes on their full asset value was estimated to
be as high as 113%, see Table 7. ETR above 100% force individuals to seek avoidance and
evasion opportunities and might have strong disincentives to work and savings. Furthermore,
large differences in ETR between different asset types influence investment preferences and
in effect distort resource allocation in the economy.
17Table 7. Effective tax rates on the real income from different assets
Source: Denk (2012)
3.2.2 Inheritance and gift tax
Current method of taxing inheritance and gifts has a number of undesirable characteristics.
Similarly as with annual wealth taxation, due to the valuation difficulties properties are the
most used form of inheritance or gifts in Norway. According to Statistics Norway (2013) in
2010 the value of private properties accounted for 60% of total inheritance taxes. Further, the
tax does not distinguish between different types of recipients, thus a rich person and poor will
in effect pay the same amount of tax. The fact that gifts to persons other than children are tax-
exempt discriminates against children and creates a problem related to tax avoidance. For
example by using a third persons financial gifts can be easily channel to children without tax.
Furthermore, it is often argued that wealthy individuals who are more effective in their tax
planning are most likely to avoid tax payments. Unlike low income households who have
most of their wealth tied up in properties, the wealth of the wealthy households is more
mobile which can be helpful for them to avoid their tax payment by careful tax planning. In
such cases both vertical and horizontal equity principles are being undermined. In addition,
taxing children less than distance relatives encourages concentration of wealth in the hands of
one generation. An equal opportunity approach would however suggest the opposite.
The above issues are currently considered as some of the main weaknesses of the present
system of capital stock taxation in Norway. In order to avoid major distortions in the long
run, important changes to the system will probably be required. Some of the current
weaknesses, for example, these related to inheritance taxation might only require minor
18improvements (See for example Denk (2012)). On the other hand valuation of properties is
often regarded as the core problems in connection with personal wealth taxation. In some
countries such as Germany (where the tax has been declared unconstitutional) difficulties
with property valuation was a primary justification behind the tax removal. In Norway the
government is fully aware of the problem and therefore some attempts have already been
taken to mitigate the distortion. For example, in 2013 the Norwegian government proposes to
increase the taxable value of second homes and commercial properties for the purpose of net
wealth tax from 40% to 50% of estimated market value, (Ministry of Finance, 2012).
Moreover, statistical models that are able to estimate more reliable market values on every
single dwelling are slowly being developed (See for example Epland (2012)). The increased
tax value of dwellings might however cause further distortion. For example, it may affect low
income households and pensioners whose significant portion of wealth is allocated in their
own property and thus undermine the progressivity of the tax system. Removing the tax on
one hand might significantly decrease ETR differences between various assets but on the
other hand due to very low property taxation and lack of other taxes on capital stock it might
further encourage investment in real estates and cause additional distortions. Mitigating the
above distortion however with preservation of current progressive and redistributive function
of both taxes will be a challenging but necessary task for Norwegian social planners in
coming years.
193.3 Equity concerns - wealth and inheritance taxation under dual income tax system
Redistribution arguments are often used in favour of wealth and inheritance taxes. One of the
main justifications of both taxes is to consider them as additional taxes on capital income.
Since 1992, major reforms concerning capital part of taxation have been taking place in
Norway. Since then, the progressivity of the tax system has been clearly strengthened and
wealth related taxes are believed to play an important part in this respect. Before the reforms,
there was a clear recognition that investment and saving allocation were seriously distorted.
This was despite the fact that Norway unlike other Scandinavian countries had already
lowered a top marginal tax rate on capital before applying a new method (Sørensen, 1998).
Under dual income tax (DIT) system that has been used since 1992 income tax is being
imposed differently on general income and personal income. This means that capital income
earned by an individual is subjected to flat tax rate of 28%, while labour (residual incomes)
are taxed progressively. In Norway, these residual incomes consist mainly of labour income,
private and public pensions and other government transfers. Capital income is mainly
composed of interests, dividends, taxable capital gains and imputed returns to the business
assets of the self-employed (Sørensen, 1998). The same 28% tax also applies to limited
companies and other corporate tax payers. In order to distinguish labour incomes from capital
incomes a method of income splitting had to be used. This means that income earned by self-
employed persons, partnerships and limited companies had to be divided between labour and
capital income. The DIT system however was highly criticized. Not only it undermined
vertical equity principle, since income from capital is often concentrated in upper income
brackets but it was also exposed to horizontal equity failures by treating equal individual
unequally and in some extent validated the principle of tax neutrality. The splitting method
required extra administrative costs and there was strong motivation to find a ways to
transform labour income into low-taxed capital income. According to Ministry of Finance
(2006) “over the years, the rate differential between taxes on general and personal income
increased significantly, from 28.1 percentage points in 1992 to 36.7 percentage points ten
years later”. At that time it was clear that the method undermined one of the fundamental
principles of capital taxation and major changes were required (Erlend, 2011). The reform
objective between 2004 and 2006 headed by Skauge Committee was thus to reduce the tax
rate differential between labour and capital income and most likely to abolish the split model
in full or in part (Ministry of Finance, 2006). The idea of the new model (shareholder income
tax model) was to approximate the marginal tax on high share income to a lower marginal
20labour tax in order to remove the motivation for income shifting but at the same time
preserving the low tax on ‘normal’ capital income. The model as it has been shown by
Sørensen (2005) is neutral with respect to investment allocation, choice of funding and the
timing of share realisation (no lock-in effects).
Figure 6. Marginal tax on wages and dividends
Source: Norwegian Ministry of Finance (2011)
After the reform the tax became horizontally more equitable (refer to Bø et al. (2011) for
some examples) and substantial strengthening of income redistribution through the taxation
system has been reported, see Table 6. The evaluation of the reform by Norwegian
government has shown that the new method has substantially strengthened income
progressivity in Norway. As the Figure 7 shows before the reform Norwegian tax code has
failed to achieve high tax progressivity. Between 2001 and 2005 individual on the top of the
income distribution paid almost the same tax in average, as for example the bottom 40%.
After the reform however substantial strengthening in tax progressivity has been achieved.
21Figure 7. Average assessed tax as a share of gross income
Source: Norwegian Ministry of Finance (2011)
Even though the substantial improvements in tax progressivity after 2006 were attributed to
capital flow tax reforms, annual wealth taxes were thought to play an important role in this
aspect. Recent changes aimed to improve redistributive role of wealth taxation has managed
to move the burden towards more wealthy individuals. As a result substantial increases in
average tax payments on top of the income distribution are thought to be achieved with help
of wealth taxation. Figure 8 divides the taxes paid by the highest one percent of income
earners into income tax and wealth tax. It suggests that the wealth tax plays an important part
in ensuring the progressivity at the highest income brackets. For individuals on top of the
income distribution the rather high share of tax payments comes from the wealth tax.
22Figure 8. Top 1% wealth share divided into 10 equal sized groups according to rising
wealth
Source: Norwegian Ministry of Finance (2011)
It is sometimes argued that taxes on capital stocks are inevitable part of the DIT system and if
one wish to mitigate the gaps between marginal tax rates on labour and capital incomes and
counteract excessive concentration of income and wealth, both taxes are more efficient than
higher marginal tax rates on nominal capital incomes. “In a dual income tax system where
capital income is taxed at a uniform rate, wealth taxation may be used as an additional policy
instrument to achieve redistributive objectives” (The Mirrlees Review, (2010) p.776).
Thus, before any attempt to remove the national wealth tax in Norway, the impact on tax
progressivity must be carefully studied as it might highly undermine distributional aspects of
the tax system. According to the Ministry of Finance (2012), in 2011 a personal wealth tax
amounted to 85% of total tax payment for those 10% individuals with the highest net wealth.
Furthermore, the calculations have shown that without the wealth tax, total tax payments for
1,000 most wealthy individuals in Norway would be reduced by nearly 60%. Thus it is clear
that its removal would have beneficial effects mainly on wealthiest individuals. However,
critics of the tax often argue that various indirect economics effects caused by the tax are too
costly in relation to above benefits. For example, it is believed that without the tax, wealthy
individuals may be induced to increase their labour supply or hide less of their wealth abroad
which in effect would lift revenues from personal and capital taxation (Denk, 2012). The
indirect impacts are however difficult to measure and justify. The aim of the next section is to
23review the most recent theoretical and empirical studies related to wealth and inheritance
taxes in order to have a better understanding of their indirect effects.
244 Review of empirical literature
Both wealth and inheritance taxes are widely discussed in political circles however they are
rarely mentioned in textbooks and academic journals. The empirical research concerning
taxation of wealth and wealth transfers is limited and there seems to be a clear lack of
consensus among economists about the impact they have on economic performance. The aim
of this section is to look at previous empirical findings in order to evaluate different
arguments in support and against these taxes.
4.1 Wealth tax – economic implication and indirect effects
The most widespread criticism of taxing wealth stocks concerns its impact on economic
efficiency such savings, investments, double taxation, tax wages, tax evasion and the outflow
of wealthy individuals. Proponents on the other hand often argue that both taxes are an
effective way to even out wealth in society and promote equality of opportunity.
4.1.1 Does annual wealth tax lower economic growth?
One important empirical question is to what extent annual wealth tax affect economic growth.
Pichet (2007) examines the economic consequences of French “Solidarity wealth tax”.
According to the paper wealth tax has probably reduced GDP growth by 0.2% per annum and
caused an annual fiscal shortfall of around 7 billion Euro. The arguments however are not
empirically proven. One of the first studies attempting to empirically examine the impact of
annual wealth tax on general economic performance was conducted by Hanson (2002). The
author empirically estimates the relationship between the wealth tax and economic growth.
Using the data for 20 OECD countries covering period of 20 years and instrumental variable
approach in order to control for endogeneity, the author finds supportive evidence that wealth
taxes distort economic growth. However, as the author emphasises “the estimated magnitude,
is somewhat less alarming than popular account” (Hanson, 2002 p.17).
4.1.2 Does wealth tax reduce investment and entrepreneurial activities?
The wealth tax might also affect economic growth indirectly, for example, by effectively
reducing successful entrepreneurship. In order to illustrate it, Hanson (2006) empirically
investigates the issue. Using a model of the choice between becoming an entrepreneur or an
employee and difference in difference estimation (taking advantage of wealth tax
abolishment in recent years) the author investigates the impact of annual wealth taxes on
25entrepreneurship activities. Here simple comparison between 22 OECD countries suggests
that “countries that do not tax wealth have systematically higher self-employment than
countries that do tax individual wealth” (Hanson, 2006 p.12). However, difference in
difference estimation indicates that the removal of the tax on wealth has very small positive
impact on the boost in self-employment.
Edson (2012) investigates to what extent wealth tax reduces the incentives of business
owners to invest in Norway by examining whether firms affected by wealth taxation are more
dependent on external credit markets and therefore more vulnerable to capital constrains. The
author splits businesses into two samples: those affected by the tax and those not. He
determines the difference in capital constrains between two samples by using two models
developed for detecting capital constrains among firms. According to the studies “the
negative capital constraining effects of the wealth tax are minimal and the tax affects only the
private firms least reliant on internal financing” (Edson, 2012, p.28).
4.1.3 Does annual wealth tax influence tax avoidance and outflow of capital?
According to Pichet (2007) wealth tax impoverishes France forcing many wealthy tax payers
to leave the country and shifting the tax burden onto other taxpayers. The author claims that
total capital flight since the ISF wealth tax’s creation in 1988 amounted to approximately 200
billion euro. Seim (2012) investigates the impact of wealth tax in Sweden on tax avoidance.
The author argues: “The wealth tax base, involves an element of self-reporting, which makes
the wealth tax susceptible to lower compliance rates and tax evasion” (Seim, 2012 p.3).
Using a panel dataset, comprising about 58 million observations of individual taxpayers, the
author finds supportive evidence, that before it was abolished the Swedish annual wealth tax
was subject to evasion. His results indicate that increase in annual wealth tax is likely to
stimulate evasion rather than deter savings. In addition to that his findings show that high-
skilled individuals who have a better understanding of the tax system are more likely to avoid
the annual wealth taxes.
4.1.4 Empirical studies relating wealth tax to future revenues and wealth inequality
Empirical studies relating wealth tax and its future impact on revenues and wealth
distribution seems to be limited. Before being removed Cabre and More (2001) attempted to
analyse to what extent wealth tax was able to reduce wealth inequality in Spain. The authors
conclude that the tax failed to reduce vertical inequality in Spain due to mainly small
revenues and compliments. Bach et al. (2011) evaluate the revenue and distributional effects
26of a one-time levy on personal net wealth in Germany using a microsimulation model. The
authors suggest that due to strong wealth concentration such a levy could raise substantial
revenue even with high personal allowances.
4.2 Wealth transfer taxes – economic implication and indirect effects
Any theoretical analysis concerning wealth transfer taxation is usually based on various
bequest motives which are thought to be the key building blocks for theoretical analysis of
these types of taxes. The literature is also focused on various behavioral responses such as
impact on labor supply of the recipient, tax avoidance or savings and investment.
4.2.1 Bequest motives
Four main motives (accidental, strategic, altruistic and joy of giving motive) behind capital
accumulation and bequests are often described in literature and understanding these motives
is thought to reveal theoretical conclusions regarding these taxes. The standard models of
optimal taxation of capital income differ considerably when one assumes different bequest
motives. For example, in cases where bequests are accidental (unintended) saving is
exclusively motivated by consumption smoothing and retirement concerns. The analysis
shows that accidental bequests can be heavily taxed without generating distortion since taxing
those does not affects the donor’s behavior (Cremer, 2009). However, if people are motivated
to work and save with an intention to make a transfer to their children the tax will be
distortive. Nevertheless, despite the large literature on different bequest motives there seems
to be little consensus among economists as to which motive dominates. Kopczuk (2010)
gives a brief review of existing theory and evidence concerning bequest taxation. The author
concludes that understanding of the nature of bequest motive is essential to understand
optimal transfer taxation.
4.2.2 Estate vs. inheritance taxes
The total economic impact may also different substantially depending on the types of bequest
being used. There are two basic types of wealth transfers. One of them is estate tax (often
called the dead tax or donor based), which is levied on the entire property and monetary value
of the deceased, and is paid by the donor. The other, inheritance tax, is based on the amount
received by each heir, and the amount received depends on the number of times the estate is
divided into. While donor based system is often regarded as simpler and easier to
administrate, donee based method currently used in Norway seem more appropriate on
27fairness grounds (The Mirleess Review, 2010). Due to the rate being progressive, the current
system encourages the donor to spread his wealth to many individuals. Therefore, the donee
based system may be more efficient to mitigate high concentration of wealth and to equalize
opportunities in society.
4.2.3 Wealth redistribution
Probably the most widespread support for taxing bequests is their positive redistributive
impact. Pikketty (2007) examines the impact of estate and gifts taxes in US on tax
progressivity. The paper shows that before being significantly reduced both taxes contributed
around 23.4% to the overall average of 74.6% ETR payments from the top 0, 01% individuals
in income distribution. In 2004 however the contribution fell to just 2.5% and the average
ETR was only 34.7%. According to the author the decline in tax rates from estate and gifts
taxes accounted for half of the change in ETR.
4.2.4 Do bequest taxes reduce labour supply and saving?
It is often argued that inheritance makes donees less productive members of society. The
Carnegie conjecture showing that large inheritances decrease a person’s labour supply is
widely studied phenomenon. Kopczuk (2010) gives an overview of empirical studies
demonstrating the impact of inheritances on labour supply. The effect is widely supported by
empirical studies which show that large bequests are likely to affect labour participation.
Holtz-Eakin et al. (1993) gives an overview of empirical evidence of Carnegie conjecture.
The evidence shows, for example, that a single person receiving an inheritance of $150, 000
is roughly four times more likely to leave the labour force than a person with lower or no
inheritance. In addition, there appears to be a general presumption that higher inheritance
taxes reduce savings and aggregate capital accumulation. Gale et al. (2001) discusses the
issue in accordance to US estate tax. Their key findings suggest that the effect of estate tax on
savings is not clear and depends crucially on the donor’s motives for bequests and wealth
accumulation. “The overall effect requires analysis of both donor and the potential recipient;
and in surprising number of cases, higher estate taxes appear to rise savings” (Gale et al.,
2001, p.235). This however might raise some doubts about the conventional wisdom that
estate taxes always reduce wealth.
285. The future revenues and distributional effects of wealth and inheritance tax
5.1 Dynamic microsimulation introduced
Microsimulation as a tool for simulating economic reforms has been in use since the 1950s.
Nevertheless, due to initial computer constrains and shortage of reliable data, the model's
usefulness and precision have been mainly recognised in the past couple of years. With
improved data availability over the last decade, the number of microstimulation models has
been used in order to study complex real life events such as population growth and impact of
policy change on macro and micro level (Fredriksen, 1998). Some of the models recently
developed include: PENSIM developed in UK which models the treatment of pensioners by
the social security system across the income distribution; DYNASIM – dynamic
microsimulation model for USA; NATSEM – developed in Australia; DESTINE – a dynamic
microsimulation model for France or MOSART for Norway (Zaidi and Rake, 2011).
Microsimulation is often used as a tool to evaluate a certain effect of intervention before it is
implemented. In social science the process of microsimulation uses widely available micro
data set in order to provide useful projections at the aggregate level. The data are usually
drawn from survey based microdata or are collected by various government institutions. Both
sample units and the whole population can be simulated (Fredriksen, 1998). Compared with
‘macro’ models, ‘micro’ models are thought to reveal more information on individual’s
behaviour and are often used as a tool when individual’s heterogeneity is complex to
overcome. Thus, microsimulation enables social planner to explore heterogeneity and socio-
economic diversity within the stimulated population. The models are widely used by
government and various public institutions around the world.
The way the data are simulated can be categorised as static or dynamic aging (Fredriksen,
1998). Static models are usually arithmetic models and the units are simply aged by
reweighting. In such models constant behaviour is assumed. Static models are widely used
for prediction of immediate effects of policy changes. Arithmetical simulation can be, for
example, used to evaluate the changes of tax rates or individual allowances and their impact
on aggregate financial or welfare effects (who is better and who is worse of). An example of
static model currently being used at Statistics Norway is LOTTE. In the long term projections
however the static microsimulation is thought to be of little help (Fredriksen, 1998). In the
dynamic aging, the characteristics and circumstances of treated units change over time and
can be affected by given policy change. The individuals are allowed to change their
29You can also read