The Digital Divide: Examining High-Speed Internet and Computer Access for Washington Students - Education Insights - WSAC
←
→
Page content transcription
If your browser does not render page correctly, please read the page content below
Education Insights

The Digital Divide: Examining High-
Speed Internet and Computer Access
for Washington Students

Authors:
Isaac Kwakye
Emma Kibort-Crocker
Mark Lundgren
Sarah Pasion
May 2021
Acknowledgements
This report was a collaborative effort, and the authors would like to acknowledge the individuals who
helped with research efforts and provided insights to advance the work in Washington. We are grateful
to Tom Allison and his team at the State Council of Higher Education for Virginia for sharing their digital
divide analysis and documentation. We would also like to thank Danica Mitchell (Washington Student
Achievement Council) for her research assistance and Jim Schmidt (Education Research and Data Center)
for his thorough review and continued strategic partnership with the WSAC Research Division.

Washington Student Achievement Council                                                      Page 2 of 30
Contents

Acknowledgements                                                                               2
Executive Summary                                                                              4
Introduction                                                                                   5
What do high-speed internet and computer access look like for Washington students?             6
  Examining differences in digital access by race                                              6
  Examining differences in digital access by household income                                  9
  Examining differences in digital access by geographic region                                12
What do we know about internet and computer access for students during the COVID-19 pandemic? 16
Discussion                                                                                    17
Conclusion                                                                                    18
Methodology Notes                                                                             20
References                                                                                    21
Appendix A.                                                                                   22
Appendix B.                                                                                   23
Appendix C.                                                                                   24
Appendix D.                                                                                   27

Washington Student Achievement Council                                               Page 3 of 30
Executive Summary
The widespread shift to remote learning during the COVID-19 pandemic has amplified the need for
digital technology at home. Students without adequate internet and computer access have experienced
challenges participating in remote learning. Local efforts during the pandemic to help students access
the digital tools needed for remote learning may have accelerated internet and computer access.
However, examining existing data about internet and computer access for students in Washington can
help illustrate patterns in the digital divide that may help identify issues. This report presents
information and insights about the digital divide for students in Washington.

Addressing digital divide issues will ensure that all students have access to high-speed internet and
computers to be successful in K-12 and postsecondary education. Analysis of data from the U.S. Census
American Community Survey before the pandemic reveals that about 84 percent of all students in
Washington had high-speed internet connections. Analysis also shows that about 95 percent lived in
households with a desktop, laptop, or tablet computer. However, K-12 students were slightly less likely
to have high-speed internet or a computer at home than postsecondary students. And overall, access to
high-speed internet was less common than the availability of a computer at home.

Although Washington generally has higher rates of digital access for students than the national average,
there are significant disparities for some student sub-groups when examining the data by race,
household income, and geographic region. In general, students of color, students with lower household
incomes, and students living in more rural areas have lower rates of access to digital tools at home.

              Access to high-speed internet at home varied by sub-group for students in Washington

                                                          Asian       90.3%
                                                                                                                                         Geographic Region
                                                          White       86.7%
                                             Two or More Races        86.5%
 Race

        Native Hawaiian and Other Pacific Islander                   82.4%
                                       Black or African American     81.3%
                 American Indian or Alaska Native                  72.4%
                                                       Hispanic    72.0%

                                              $200,000 or More         93.6%
                    Household Income

                                          $150,000 to $199,999        91.2%
                                          $100,000 to $149,999        88.8%
                                             $75,000 to $99,999      85.7%
                                             $50,000 to $74,999      81.5%
                                             $35,000 to $49,999     76.6%
                                             $10,000 to $34,999    69.8%
                                              Less Than $10,000    67.8%
Source: American Community Survey (ACS) 2015-2019 PUMS data. Sample excludes students living in group quarters, such as college dormitories or juvenile detention centers.

Federal and state measures to help provide access to the internet and devices for remote learning
during the pandemic provided necessary assistance to students and likely increased digital access for
many households in Washington. Ensuring students have access to high-speed internet and have
adequate devices at home should continue to be a priority, even as they return to in-person learning.
Promoting access to high-speed internet and computers for all Washington households can help ensure
educational access and equity that can help increase postsecondary attainment in the state. Closing the
digital divide may be a critical step to opening educational opportunities and social and economic
wellbeing for all Washington residents.

Washington Student Achievement Council                                                                                                                          Page 4 of 30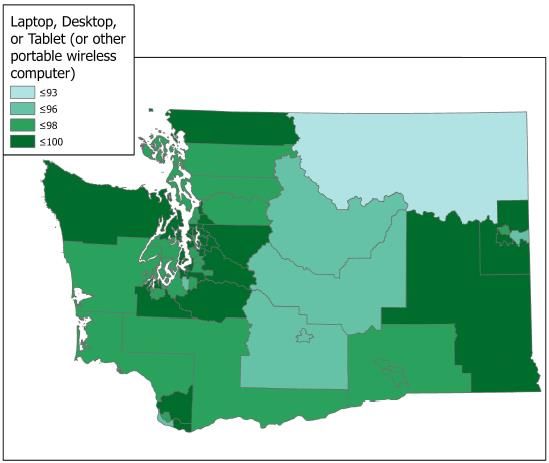
Introduction
Access to digital technology is fundamental to many aspects of society—including communications,
services, and information sharing. Digital access has become increasingly central to daily life during the
COVID-19 pandemic as more activities have been conducted online. However, data show that just 79
percent of United States households had a broadband subscription in 2019.1 The findings from the data
mean that more than one in five households in the U.S. did not have broadband access at home.
Additionally, there are disparities in broadband access for different sub-populations in the U.S. For
instance, roughly 79 percent of households in large urban areas had a broadband subscription in 2019,
compared to only about 73 percent of rural households. We also see differences in internet users
depending on income—89 percent of individuals in the top quartile of the income distribution were
internet users, compared to 71 percent of individuals in the bottom income quartile (OECD, 2021).2
These findings help illustrate the existing digital divide and suggest that many individuals do not have
access to the internet at home in the U.S.

Digital technology is also an increasingly important aspect of educational access and equity. Students of
all ages use the internet for educational purposes and rely on computers to complete assignments.
There is some evidence that students with computers at home have better educational outcomes,
including high school graduation rates (Fairlie et al., 2010). But a growing body of research has shown
that many students still lack sufficient internet and computer access to complete homework and school
assignments at home. National research suggests that approximately a quarter of K-12 students in the
U.S. do not have broadband access or a computer or tablet at home, and rates of digital access are
lower for students of color and students from lower-income households (NEA, 2020).3

The widespread shift to remote learning during the COVID-19 pandemic has amplified the issue as
students without adequate internet and computer access have experienced challenges participating in
remote learning. Local efforts during the pandemic to help students access the digital tools needed for
remote learning may have accelerated internet and computer access. However, examining existing data
about internet and computer access for students in Washington can help illustrate patterns in the digital
divide that may help identify issues. Addressing digital divide issues will ensure that all students have
access to high-speed internet and computers to be successful in K-12 and postsecondary education.

This report utilizes data from the U.S. Census American Community Survey (ACS) to provide a picture
of high-speed internet and computer access for students in Washington. We present data for K-12 and
postsecondary students and breakdowns by race, household income, and geography to identify gaps in
access that may contribute to inequities in education. We then provide some emerging evidence of the
impact of the digital divide on students during the COVID-19 pandemic. We conclude with a discussion
of efforts to close the digital divide, highlighting the importance of internet and computer access for
educational attainment in our state.

1 Broadband refers to a high-speed internet connection through a fixed broadband (DSL, cable, fiber, satellite, terrestrial, and other fixed-wired
technologies) or a mobile broadband connection offering speeds of 256 Kbps or higher. Data reported on U.S. trends come from OECD.
2 Internet users includes adults ages 16-64 who used the internet in the last 3 months at the time of data collection. The bottom income

quartile represents individuals with incomes in the lowest 25 percent of the income distribution.
3 Throughout the report, data reported on national K-12 trends in digital access come from U.S. Census American Community Survey 2018 data

presented in the National Education Association’s (NEA) Digital Equity for Students and Educators report.

Washington Student Achievement Council                                                                                        Page 5 of 30
What do high-speed internet and computer access look like for Washington
students?
Data from the U.S. Census American Community Survey (ACS) can help us understand the extent to
which digital technology is available in the households of Washington students. In this section, we
examine the prevalence of high-speed internet connections and computers in the homes of
Washington’s K-12 and postsecondary students, with particular emphasis on identifying groups of
students with lower rates of access to these resources.4 Data about high-speed internet and computer
access are collected at the household level and exclude students living in group quarters, including
college dormitories and juvenile detention centers.5

Survey responses to the ACS show that access to digital technology in the home is available for most
students in Washington. Overall, about 84 percent of all students in Washington had high-speed
internet connections (table 1), and about 95 percent lived in households with a desktop, laptop, or
tablet computer (table 2). However, K-12 students in Washington were slightly less likely to have access
to high-speed internet (83 percent) and a computer at home (94 percent) than postsecondary students
(86 percent had high-speed internet and 98 percent had a computer at home). And overall, access to
high-speed internet was lower than access to a computer at home.

Table 1. High-speed internet access at home for Washington students

                                                                      All Students                                  K-12                               Postsecondary
       High-Speed Internet Access
                                                                    Number     Percent                         Number Percent                         Number Percent
                            Yes                                    1,328,643                83.5%              973,299               82.7%            355,344                85.7%

       No (no high-speed internet)                                  175,410                 11.0%              137,748               11.7%             37,662                9.1%
        N/A (no paid access to the
                                                                     87,002                  5.5%               65,609                5.6%             21,393                5.2%
                internet)
                           Total                                   1,591,055                100%             1,176,656                100%            414,399                100%
Source: American Community Survey (ACS) 2015-2019 PUMS data. Sample excludes students living in group quarters, such as college dormitories or juvenile detention centers.

Table 2. Computer access at home for Washington students

                                                                      All Students                                  K-12                               Postsecondary
              Computer Category
                                                                    Number     Percent                         Number Percent                         Number Percent
       Laptop, Desktop, or Tablet                                  1,509,588                94.9%            1,104,057               93.8%            405,531                97.9%

             No Computer Access                                      81,467                  5.1%               72,599                6.2%              8,868                2.1%

                           Total                                   1,591,055                100%             1,176,656                100%            414,399                100%
Source: American Community Survey (ACS) 2015-2019 PUMS data. Sample excludes students living in group quarters, such as college dormitories or juvenile detention centers.

4 All Washington data reported in this section come from the American Community Survey (ACS) 2015-2019 PUMS dataset. These data were
collected prior to the COVID-19 pandemic and the widespread shift to remote learning. During that period, schools put in place programs and
policies to make sure that all students were equipped with a computer and internet access so they could engage in remote learning. These
actions may have had a significant effect on the number of students who have access to internet and computers at home in the state.
5 The ACS estimates show 3,884 K-12 students and 43,687 postsecondary students living in group quarters. These students constitute less than

one percent of the K-12 student population and a little less than ten percent of the postsecondary student population.

Washington Student Achievement Council                                                                                                                          Page 6 of 30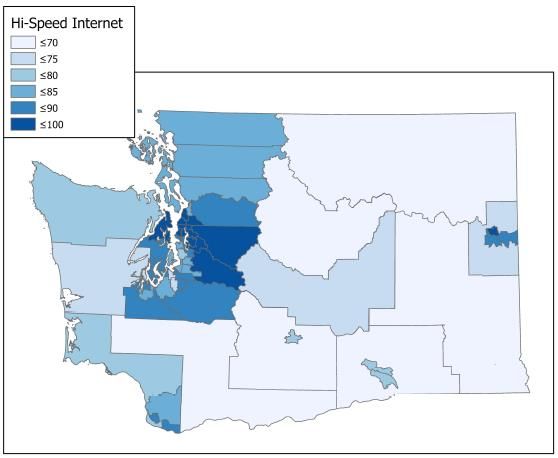
Examining differences in digital access by race
Although high-speed internet connections and computers are broadly available in the households of
Washington students, access to these digital resources is not universal, and there were significant
differences in access between racial groups (figure 1).6 For example, access to high-speed internet at
home ranged from over 85 percent for Asian and White students to around 72 percent for Hispanic and
American Indian/Alaska Native students.

Figure 1. Washington students with high-speed internet access at home by race

                                                        Asian                                                   90.3%

                                                       White                                                  86.7%

                                    Two or More Races                                                         86.5%

    Native Hawaiian and Other Pacific Islander                                                              82.4%

                           Black or African American                                                        81.3%

                                     Non-resident Alien                                                   78.5%

                American Indian or Alaska Native                                                       72.4%

                                                    Hispanic                                          72.0%

                                                                 0%                                                                                                          100%
Source: American Community Survey (ACS) 2015-2019 PUMS data. Sample excludes students living in group quarters, such as college dormitories or juvenile detention centers.

The disparities show a similar pattern but are more significant for K-12 students (figure 2). Among K-12
students, about 92 percent of Asian students and 86 percent of White students lived in households with
high-speed internet access. In contrast, only about 71 percent of American Indian/Alaska Native and
Hispanic students did. Although high-speed internet access tends to be higher in Washington than
national averages, the patterns in the Washington data are similar to national disparities. Nationally, K-
12 students who are White (81 percent) or Asian (87 percent) were more likely to like in a household
with high-speed internet access than students who are American Indian/Alaska Native (54 percent),
Black (69 percent), or Hispanic (70 percent) (NEA, 2020).

The internet access trends for postsecondary students in Washington were similar (figure 3). The highest
high-speed internet access rates among postsecondary students were among students of two or more
races, White, and Asian students. Like K-12 students, Hispanic and American Indian/Alaska Native
postsecondary students had the lowest rate of high-speed internet access at around 80 percent.

6
    Appendix A presents the racial distribution of students in Washington who are included in this analysis.

Washington Student Achievement Council                                                                                                                          Page 7 of 30
Figure 2. Washington K-12 students with high- Figure 3. Washington postsecondary students
speed internet access at home by race with high-speed internet access at home by
race
Asian 92.0%
Two or More Races 87.6%
White 86.4%
White 87.3%
Two or More Races 86.3%
Asian 87.0%
Native Hawaiian and
Other Pacific Islander
81.8% Native Hawaiian and
Other Pacific Islander
84.5%
Black or African
American
80.4% Black or African
American
83.7%
Non-resident Alien 75.1%
Non-resident Alien 82.0%
American Indian or
Alaska Native
70.7%
Hispanic 80.2%
Hispanic 70.5%
American Indian or
Alaska Native
79.9%
0% 100%
0% 100%
Source: American Community Survey (ACS) 2015-2019 PUMS data. Sample excludes students living in group quarters, such as college dormitories or juvenile detention centers.
Computers in the household were much more common than high-speed internet access, but differences
between racial groups remain (figure 4). For example, about 98 percent of White students and 97
percent of Asian students in Washington lived in a household with a computer. However, only about 86
percent of Hispanic students and 84 percent of Native Hawaiian/Pacific Islander students did.
Figure 4. Washington students with computer access at home by race
White 97.6%
Asian 97.3%
Two or More Races 96.6%
Black or African American 94.0%
Non-resident Alien 92.3%
American Indian or Alaska Native 91.4%
Hispanic 85.9%
Native Hawaiian and Other Pacific Islander 84.2%
0% 100%
Source: American Community Survey (ACS) 2015-2019 PUMS data. Sample excludes students living in group quarters, such as college dormitories or juvenile detention centers.
There was considerable variation in rates of home computer access among racial groups in the K-12
population (figure 5). At the low end of the range, only about 82 percent of Native Hawaiian/Pacific
Islander students and 84 percent of Hispanic students had a computer in the home. Asian and White
Washington Student Achievement Council Page 8 of 30students had the highest rates, at 97 percent in each case. Nationally, K-12 students who are American
Indian/Alaska Native (75 percent), Black (83 percent), or Hispanic (85 percent) were less likely to have an
adequate device at home than their White (95 percent) and Asian peers (96 percent) (NEA, 2020).
The prevalence of computers in the household among postsecondary students showed less variation by
race (figure 6). However, White and Asian students were still more likely to have a computer at home
than other racial groups. On the other hand, Native Hawaiian/Pacific Islander postsecondary students
were the least likely to have a computer at home (92 percent).
Figure 5. Washington K-12 students with Figure 6. Washington postsecondary students
computer at home by race with computer at home by race
Asian 97.3% Two or More Races 98.9%
White 97.3% White 98.4%
Two or More Races 96.1% Non-resident Alien 97.5%
Black or African American 93.1% Asian 97.3%
American Indian or Alaska American Indian or Alaska
Native 90.1% 96.8%
Native
Non-resident Alien 87.3% Black or African American 96.2%
Hispanic 84.0% Hispanic 96.1%
Native Hawaiian and Other
Pacific Islander 81.6% Native Hawaiian and Other
Pacific Islander 92.2%
0% 100%
0% 100%
Source: American Community Survey (ACS) 2015-2019 PUMS data. Sample excludes students living in group quarters, such as college dormitories or juvenile detention centers.
Examining differences in digital access by household income
Household access to resources can vary with income, and it is not surprising that we see the most
disparate rates of internet and computer access among income sub-groups. Among all students in
Washington, students living in households with lower incomes tended to have lower rates of high-speed
internet access at home than those living in households with higher incomes (figure 7).7 In the total
student population, only 68 percent of those living in households earning less than $10,000 per year had
a high-speed internet connection at home. The rate was only about 70 percent of students in
households in the $10,000-$34,999 income range. The rate rises steadily along with income to almost 94
percent for households with annual incomes of $200,000 or more.
7
Appendix B presents the household income distribution of students in Washington who are included in this analysis.
Washington Student Achievement Council Page 9 of 30Figure 7. Washington students with high-speed internet access at home by household income
$200,000 or More 93.6%
$150,000 to $199,999 91.2%
$100,000 to $149,999 88.8%
$75,000 to $99,999 85.7%
$50,000 to $74,999 81.5%
$35,000 to $49,999 76.6%
$10,000 to $34,999 69.8%
Less Than $10,000 67.8%
0% 100%
Source: American Community Survey (ACS) 2015-2019 PUMS data. Sample excludes students living in group quarters, such as college dormitories or juvenile detention centers.
Variation in high-speed internet access by income is significant for K-12 students (figure 8). Only about
61 percent of K-12 students living in households earning less than $10,000 had home access to high-
speed internet. However, the rate rises with income to almost 94 percent for those in households
earning $200,000 or more. National data show similar disparities—K-12 students whose households fell
below the federal poverty level were less likely to have high-speed internet access at home (58 percent)
than those who were above the federal poverty level (81 percent) (NEA, 2020).
Disparities in high-speed internet access were less pronounced for postsecondary students than K-12
students in Washington (figure 9). About 78 percent of students in the lowest income group had high-
speed internet access. Rates of high-speed internet access rose steadily for each income group, reaching
almost 93 percent for households earning $200,000 or more.
Figure 8. Washington K-12 students with high- Figure 9. Washington postsecondary students
speed internet access at home by household with high-speed internet access at home by
income household income
$200,000 or More 93.9% $200,000 or More 92.7%
$150,000 to $199,999 91.5% $150,000 to $199,999 90.5%
$100,000 to $149,999 88.6% $100,000 to $149,999 89.1%
$75,000 to $99,999 85.1% $75,000 to $99,999 87.5%
$50,000 to $74,999 80.6% $50,000 to $74,999 83.8%
$35,000 to $49,999 73.9% $35,000 to $49,999 84.9%
$10,000 to $34,999 66.1% $10,000 to $34,999 78.0%
Less Than $10,000 60.5% Less Than $10,000 78.0%
0% 100% 0% 100%
Source: American Community Survey (ACS) 2015-2019 PUMS data. Sample excludes students living in group quarters, such as college dormitories or juvenile detention centers.
Washington Student Achievement Council Page 10 of 30Computer access was more common for Washington students, but there were differences in access by
income (figure 10). As with internet connections, the prevalence of computers in the home increased
with income. Among all students in households earning less than $10,000 per year, about 86 percent
had a home computer. The rate rises steadily as income rises, reaching over 99 percent for households
earning $200,000 or more.
Figure 10. Washington students with computer access at home by income
$200,000 or More 99.5%
$150,000 to $199,999 98.8%
$100,000 to $149,999 98.3%
$75,000 to $99,999 96.9%
$50,000 to $74,999 94.5%
$35,000 to $49,999 91.4%
$10,000 to $34,999 85.9%
Less Than $10,000 85.5%
0% 100%
Source: American Community Survey (ACS) 2015-2019 PUMS data. Sample excludes students living in group quarters, such as college dormitories or juvenile detention centers.
Disparities in computer access by income level were significant for K-12 students in Washington (figure
11). For example, only about 78 percent of students in households earning less than $10,000 had access
to a computer at home, compared to more than 99 percent of students in households with the highest
incomes. Nationally, K-12 students from households with incomes below the federal poverty level were
also significantly less likely to have an adequate device at home (75 percent) than students about the
federal poverty level (94 percent) (NEA, 2020).
Computer access at home was more common for postsecondary students than K-12 students overall
(figure 12). However, those with lower household incomes were less likely to have a computer at home
than those with higher incomes. Computer access ranged from 96 percent for postsecondary students in
households below $10,000 in annual income to over 99 percent for students in the highest income
groups.
Washington Student Achievement Council Page 11 of 30Figure 11. Washington K-12 students with Figure 12. Washington postsecondary students
computer access at home by income with computer access at home by income
$200,000 or More 99.5% $200,000 or More 99.2%
$150,000 to $199,999 98.9% $150,000 to $199,999 98.8%
$100,000 to $149,999 98.1% $100,000 to $149,999 99.0%
$75,000 to $99,999 96.3% $75,000 to $99,999 98.4%
$50,000 to $74,999 93.4% $50,000 to $74,999 97.4%
$35,000 to $49,999 89.6% $35,000 to $49,999 96.9%
$10,000 to $34,999 81.3% $10,000 to $34,999 96.2%
Less Than $10,000 77.9% Less Than $10,000 96.0%
0% 100% 0% 100%
Source: American Community Survey (ACS) 2015-2019 PUMS data. Sample excludes students living in group quarters, such as college dormitories or juvenile detention centers.
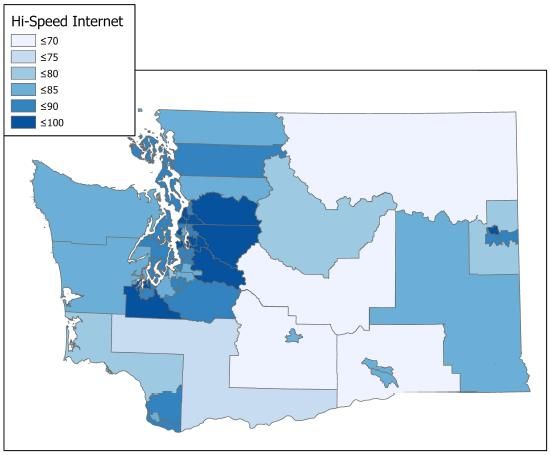
Examining differences in digital access by geographic region
Disparities in household income, local infrastructure, and other characteristics of households and their
environments produce some disparities in digital access in different geographic regions of Washington
(figure 13). Areas that may be considered more rural tended to have lower rates of students with access
to high-speed internet at home than more urban areas of the state. For instance, the proportion of all
students with high-speed internet access at home ranged from 55 percent in the northeastern corner of
the state to more than 95 percent in some areas of King County. In general, students living in the Puget
Sound region and around Spokane tended to have higher rates of high-speed internet access at home
than students living in more rural areas. See Appendix C for a detailed geographic breakdown of high-
speed internet access for students in Washington.
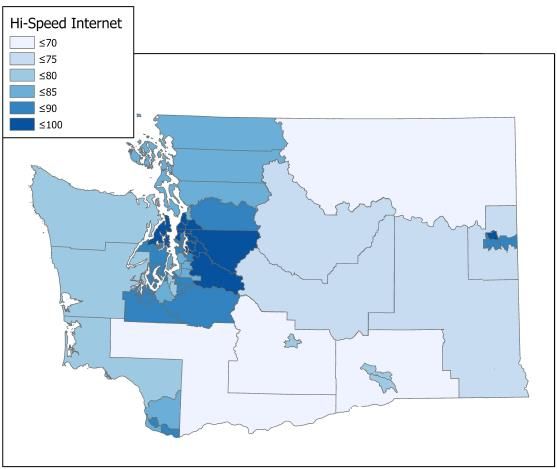
Washington Student Achievement Council Page 12 of 30Figure 13. Washington students with high-speed internet access at home by region Source: American Community Survey (ACS) 2015-2019 PUMS data. Sample excludes students living in group quarters, such as college dormitories or juvenile detention centers. Geographic regions shown are U.S. Census Public Use Microdata Areas (PUMAs). K-12 students were less likely to have high-speed internet access at home overall, and disparities between regions were more pronounced (figure 14). For instance, high-speed internet access ranged from 55 percent in the northeastern corner of the state (including Stevens, Okanogan, Pend Oreille, and Ferry Counties) to almost 97 percent in parts of King County. This Washington data corresponds with national data findings that suggest that students living in metropolitan locations were more likely to have high-speed internet access at home (80 percent) than those living in nonmetropolitan locations (66 percent) (NEA, 2020). Postsecondary students across the state tended to be more likely to have access to high-speed internet, but notable disparities by region remained (figure 15). For example, in the northeastern corner, just 59 percent had high-speed internet access, compared to almost 95 percent in parts of King County. Washington Student Achievement Council Page 13 of 30
Figure 14. Washington K-12 students with Figure 15. Washington postsecondary students
high-speed internet access at home by region with high-speed internet access at home by
region
Source: American Community Survey (ACS) 2015-2019 PUMS data. Sample excludes students living in group quarters, such as college dormitories or juvenile detention centers. Geographic
regions shown are U.S. Census Public Use Microdata Areas (PUMAs).
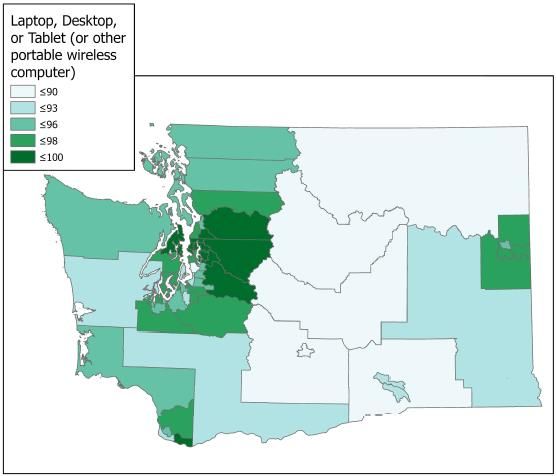
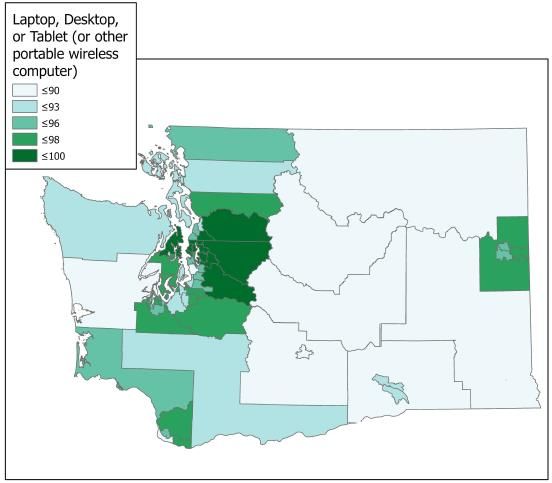
Computer access in the state also varied by geographic region, but the disparities were less significant
than for high-speed internet access (figure 16). For example, rates of computer access for all students
ranged from about 82 percent in parts of Yakima County to more than 99 percent for parts of King
County. See Appendix D for a detailed geographic breakdown of computer access for students in
Washington.
Figure 16. Washington students with computer access at home by region
Source: American Community Survey (ACS) 2015-2019 PUMS data. Sample excludes students living in group quarters, such as college dormitories or juvenile detention centers. Geographic
regions shown are U.S. Census Public Use Microdata Areas (PUMAs).
Washington Student Achievement Council Page 14 of 30There was significantly more variation in computer access by geographic region for K-12 students than for postsecondary students (figure 17). For instance, computer access at home ranged from about 80 percent for K-12 students in parts of Yakima County to nearly 100 percent for K-12 students in parts of King County. National data findings also suggest disparities in computer access by geography—students living in metropolitan locations were more likely to have an adequate device at home (91 percent) than those living in nonmetropolitan locations (87 percent) (NEA, 2020). Among postsecondary students, the northeastern corner of the state (including Stevens, Okanogan, Pend Oreille, and Ferry Counties) was the only area with computer access rates below 93 percent. More areas had computer access rates above 98 percent (figure 18). Figure 17. Washington K-12 students with Figure 18. Washington postsecondary students computer access at home by region with computer access at home by region Source: American Community Survey (ACS) 2015-2019 PUMS data. Sample excludes students living in group quarters, such as college dormitories or juvenile detention centers. Geographic regions shown are U.S. Census Public Use Microdata Areas (PUMAs). While many Washington students live in households with high-speed internet access and a computer, some sub-groups lack some digital resources. Overall, K-12 students have lower rates of access to high- speed internet and computers than postsecondary students in Washington, and racial, income, and regional disparities are greater for K-12 students as well. Addressing disparities in high-speed internet and computer access for K-12 students of color, students with lower household incomes, and students living in more rural areas can help close the digital divide. Although postsecondary students in Washington tended to have higher rates of high-speed internet and computer access, there are still some disparities among student sub-groups. In particular, lower-income students and some students of color have lower rates of access to high-speed internet and computers at home that are critical for educational access and success. These disparities in digital resources may further exacerbate educational inequities that exist in our state. Therefore, addressing disparities in high-speed internet and computer access for all students in Washington is critical to ensuring educational access to help increase our state’s educational attainment. Washington Student Achievement Council Page 15 of 30
What do we know about internet and computer access for students during the
COVID-19 pandemic?
Data from the ACS provides a picture of digital access before the pandemic. However, the onset of the
COVID-19 crisis and widespread shift to remote learning in Spring 2020 heightened students' need for
digital access. Although more current data is limited, findings from national research indicate that many
students faced challenges with digital access they needed to participate in remote learning.

At the beginning of the pandemic, a nationally representative survey found that roughly one in five
parents of school-aged children reported that their children would not be able to complete their
schoolwork because they did not have adequate internet access at home. The same survey showed that
parents of lower-income backgrounds were more likely to report that their children would need to do
their homework on a cellphone (43 percent) than upper-income parents (10 percent). Lower-income
households were also more likely to report a concern about paying for home broadband and cellphone
bills (52 percent) than upper-income households (9 percent) (Vogels et al., 2020).8 These findings
suggest that digital access posed challenges for students during the shift to remote learning that
disproportionately impacted students from lower-income families.

Teachers also reported challenges associated with students’ digital access during the pandemic. A
national survey found that 20 percent of teachers reported concerns about students’ technology access,
including a lack of internet access, device access, or challenges using technology. Teachers working in
schools in towns and rural areas, schools with a higher proportion of students of color, and schools
serving a higher proportion of low-income students were significantly more likely to report that some of
their students did not have internet access at home. And teachers whose students had a lower rate of
internet access at home reported lower levels of students completing assignments, and a lower
likelihood of communicating with families during remote learning (Stelitano et al., 2020).9 These findings
help illustrate technology access issues and the potential consequences for students during the
pandemic.

College students have also reported issues with digital access during the pandemic that affected their
course participation. A national survey of college students found that while the majority of students had
internet access at home, internet connectivity issues interfered with their ability to participate in their
courses at least occasionally for almost half of students surveyed (44 percent). Nearly a quarter of
students (23 percent) had hardware and software issues, which sometimes interfered with their ability
to participate in their courses. The survey also found disparate technology access issues by student
groups. Hispanic and Black students were more likely to experience internet connectivity issues and
hardware or software issues than White students. Low-income students were also more likely to have
technology access issues than higher-income students (Means and Neisler, 2020).10 Digital access issues
have impacted postsecondary students’ course participation during the pandemic. Specifically, issues
have disproportionately affected some students of color and low-income students, potentially
exacerbating existing inequities in higher education access and attainment.

8
  Pew Research Center survey of 4,917 U.S. adults conducted April 7-12, 2020. Sample was randomly selected and survey results were weighted
to be representative of the U.S. adult population.
9 American Instructional Resources Survey of 5,978 teachers and school leaders conducted May-June 2020. Sample is nationally representative.
10 Digital Promise and Langer Research Associates survey of 1,008 students at 2-year and 4-year institutions conducted May 13-June 1, 2020.

Sample was randomly selected.

Washington Student Achievement Council                                                                                Page 16 of 30
Several initiatives in Washington have emerged to help provide internet and computers to students who
otherwise would not have access. For example, during the spring of 2020, the Office of Superintendent
of Public Instruction (OSPI) spent $8.8 million to implement the K-12 Internet Access Program that
offered students of low-income families the ability to connect to the internet through the end of the
2020-2021 school year for free if they don’t have access (OSPI, 2020). And in October 2020, Governor
Inslee allocated $24 million of the state’s federal CARES Act funds to purchase computing devices for
approximately 64,000 students and school staff across the state who did not already have a device (WA
Governor’s Office, 2020). These statewide measures provided necessary assistance to students and
expedited access to digital resources to ensure continued access to education during the pandemic.
Ensuring students have access to high-speed internet and have adequate devices at home should
continue to be a priority, even as students return to in-person learning after the pandemic.

Discussion
Data and research suggest that many students lack access to the digital resources needed to fully
participate in online educational activities from home, which has been especially important during the
period of widespread remote learning during the pandemic. In response to the need for remote
learning, decision-makers adopted several initiatives to provide students with internet and devices
during the pandemic that may have improved digital access. But it is possible that some students are still
struggling with the digital divide and will lose access once temporary supports dissipate after the return
to in-person learning. Therefore, ensuring internet and computer access for students across the state
will continue to be an essential priority for educational access and equity.

Technology also has the potential to expand access to postsecondary education opportunities. Without
readily available access to physical or online higher educational opportunities, communities tend to
have lower postsecondary enrollment and completion rates and educational attainment rates than
those with higher education opportunities (Rosenboom and Blagg, 2018). For Washington residents who
don’t live near a physical campus, ensuring that they have adequate computer and internet access can
provide them with opportunities to gain a postsecondary credential. Creating sustainable solutions to
address the digital divide is critical to improving educational attainment for all Washington residents.

Statewide and national efforts have aimed to increase broadband access for more households. For
instance, the Washington Community Economic Revitalization Board’s Rural Broadband Program
provides grants and loans to local governments and tribes to build infrastructure to provide high-speed,
open-access broadband service to rural underserved communities.11 Additionally, recent Washington
State legislation gives public utility districts and ports new authority to provide broadband internet.12

Nationally, the Biden Administration’s American Jobs Plan proposes to invest $100 billion to bring
affordable, reliable, high-speed broadband to all Americans.13 And in May 2021, the U.S. Department of
Education and the FCC launched an outreach campaign to inform K-12 students who receive free or
reduced-price lunch and postsecondary students who receive Pell Grants that they are eligible for the

11 See: https://www.commerce.wa.gov/building-infrastructure/community-economic-revitalization-board/rural-broadband/
12 See Engrossed Substitute House Bill 1336: https://app.leg.wa.gov/billsummary?BillNumber=1336&Initiative=false&Year=2021 and 2nd
Substitute Senate Bill 5383: https://app.leg.wa.gov/billsummary?BillNumber=5383&Initiative=false&Year=2021
13
   See: https://www.whitehouse.gov/briefing-room/statements-releases/2021/03/31/fact-sheet-the-american-jobs-plan/

Washington Student Achievement Council                                                                              Page 17 of 30
temporary Emergency Broadband Benefit Program.14 The program offers a $50 discount per month for
broadband services ($75 for households on qualifying Tribal lands) and a one-time $100 discount to
purchase a connected device, including a laptop, desktop, or tablet computer.

Other states have also invested resources to improve the digital divide, including increasing broadband
infrastructure and addressing affordability barriers to broadband service and adequate devices for
students. Some states have implemented policies to extensively measure the availability of broadband
infrastructure. For example, Georgia’s Achieving Connectivity Everywhere Act created detailed maps of
broadband access to show unserved areas in the state and inform future internet access expansion
efforts. The maps helped identify unserved areas that the FCC did not previously identify. Other states
have aimed to strengthen broadband infrastructure and accessibility. For instance, in Tennessee, efforts
to increase broadband infrastructure have been coupled with programs designed to increase
subscription rates, like low-income assistance and digital literacy initiatives. Combining assistance
programs with infrastructure expansion efforts can help expand the impact of infrastructure
investments. Some states have also focused on increasing access to devices. For instance, Illinois,
Michigan, and Mississippi implemented statewide programs to expand access to home devices for
students during the pandemic. Some efforts, like those in New York City, prioritized providing devices to
students with the highest need—including students who live in shelters or temporary housing or foster
care settings, students with disabilities, multilingual learners, and students who qualify for free and
reduced-price lunch (Kelley and Sisneros, 2020). These policies help illustrate some of the ways that
states across the country are working to narrow the digital divide to increase internet and computer
access for students.

Access to technology is critical to participating in coursework, especially during the widespread remote
learning period during the COVID-19 pandemic. Access to technology is also essential for college
students and may expand the reach of online postsecondary opportunities for individuals who cannot
attend programs on physical campuses. The digital divide issue—especially for students of color, low-
income households, and those living in more rural areas—was amplified during the pandemic. However,
it will continue to be an important issue in educational access and equity even after the pandemic.

Conclusion
Digital resources, including high-speed internet and computer access at home, are integral to
educational access. Students of all ages rely on the internet for academic assignments and need
adequate devices to engage with their coursework while at home. In Washington, research from before
the pandemic shows that approximately 17 percent of K-12 students and 14 percent of postsecondary
students did not have access to high-speed internet at home. Roughly 6 percent of K-12 students and 2
percent of postsecondary students did not have a computer at home. Statewide initiatives during the
pandemic have provided internet and computers to students who lacked access so they could
participate in remote learning during the pandemic. These initiatives have likely accelerated digital

14The Emergency Broadband Benefit Program provides support for internet and devices to help low-income households stay connected during
the COVID-19 pandemic and will end when the fund is expended or 6 months after the end of the public health emergency. See:
https://www.fcc.gov/emergency-broadband-benefit-program and https://www.ed.gov/news/press-releases/department-education-launches-
outreach-campaign-millions-k-12-students-and-federal-pell-grant-recipients-now-eligible-monthly-discounts-broadband-internet-service.

Washington Student Achievement Council                                                                             Page 18 of 30
access and possibly narrowed the digital divide for Washington students. Ensuring that these supports
are sustained beyond the pandemic should be a continued priority in our state’s efforts to increase
educational access and attainment.

Digital resources may also help increase access to postsecondary education opportunities, especially for
Washington residents who do not live near a physical campus. Data suggest that high-speed internet
and computer access rates are lower for some more rural areas of the state. Without high-speed
internet and computers at home, individuals living in these more rural areas may have challenges
accessing online postsecondary education opportunities. Promoting access to digital resources, including
high-speed internet and computers, for all Washington households can help ensure educational access
and equity that can help increase postsecondary attainment in the state. Closing the digital divide may
be a critical step to opening educational opportunities and social and economic wellbeing for all
Washington residents.

Washington Student Achievement Council                                                  Page 19 of 30
Methodology Notes
The report uses U.S. Census American Community Survey (ACS) sample surveys conducted in the five
years from 2015 through 2019. The data are weighted to estimate population headcounts. The analysis
for the report selected records for students from Kindergarten through graduate school. The selection
resulted in estimates of household and personal characteristics for 1,591,055 students, of whom
1,176,656 were K-12 and 414,399 were in postsecondary institutions. Students living in group quarters
are excluded from the sample because the questions are asked only of family or individual households
and exclude people living in group quarters, including college dormitories.

We focus attention on responses to two sets of questions. One asks if there is high-speed internet
access in the household. The other asks whether there is a laptop or desktop computer in the home or if
there is a tablet or other mobile computer. We combine responses to these two questions to estimate
students living in households with some type of computer.

Washington Student Achievement Council                                                 Page 20 of 30
References
Digital Equity for Students and Educators. (2020). National Education Association (NEA) prepared by Public Policy Associates, Inc.
           https://www.nea.org/sites/default/files/2020-10/NEA%20Report%20-
           %20Digital%20Equity%20for%20Students%20and%20Educators_0.pdf

Fairlie, R. W., Beltran, D. O., & Das, K. K. (2010). Home Computers and Educational Outcomes: Evidence from the NLSY97 and CPS. Economic
             Inquiry, 48(3), 771–792. https://doi.org/10.1111/j.1465-7295.2009.00218.x

Inslee announces technology investment for Washington students and staff. (2020, October 30). WA Governor’s Office.
           https://medium.com/@WAStateGov/inslee-announces-technology-investment-for-washington-students-and-staff-9a10a05a9a25

Kelley, B., & Sisneros, L. (2020). Broadband Access and the Digital Divides. Education Commission of the States. https://www.ecs.org/wp-
            content/uploads/Broadband_Access_and_the_Digital_Divides-1-1.pdf?utm_source=ECS+Subscribers&utm_campaign=e265bdbe24-
            ED_CLIPS_5_17_2021&utm_medium=email&utm_term=0_1a2b00b930-e265bdbe24-53613579

Means, B., & Neisler, J. (2020). Suddenly Online: A National Survey of Undergraduates During the COVID-19 Pandemic. Digital Promise and
           Langer Research Associates. https://doi.org/10.51388/20.500.12265/98

OECD Going Digital Toolkit. (2021). Organization for Economic Cooperation and Development. https://goingdigital.oecd.org/

OSPI News Release: K–12 Internet Access Program Allows More Students to Learn from Home. (2020). Washington Office of Superintendent of
          Public Instruction. https://content.govdelivery.com/accounts/WAOSPI/bulletins/2a3ba61

Rosenboom, V., & Blagg, K. (2018). Disconnected from Higher Education (p. 9). Urban Institute.

Stelitano, L., Doan, S., Woo, A., Diliberti, M., Kaufman, J., & Henry, D. (2020). The Digital Divide and COVID-19: Teachers’ Perceptions of
            Inequities in Students’ Internet Access and Participation in Remote Learning. RAND Corporation. https://doi.org/10.7249/RRA134-3

Vogels, E. A., Perrin, A., Rainie, L., & Anderson, M. (2020). 53% of Americans Say the Internet Has Been Essential During the COVID-19 Outbreak.
            Pew Research Center. https://www.pewresearch.org/internet/2020/04/30/53-of-americans-say-the-internet-has-been-essential-
            during-the-covid-19-outbreak/

Washington Student Achievement Council                                                                                     Page 21 of 30
Appendix A.
Table A. Distribution of students in Washington by race
All Students K-12 Postsecondary
Race
Number Percent Number Percent Number Percent
American Indian or
18,219 1.2% 14,701 1.3% 3,518 0.9%
Alaska Native
Asian 100,422 6.3% 67,003 5.7% 33,419 8.1%
Black or African
59,869 3.8% 42,448 3.6% 17,421 4.2%
American
Hispanic 274,208 17.2% 231,706 19.7% 42,502 10.3%
Native Hawaiian and
10,075 0.6% 7,630 0.7% 2,445 0.6%
Other Pacific Islander
White 908,139 57.1% 659,277 56.0% 248,862 60.1%
Other Race 3,381 0.2% 2,617 0.2% 764 0.2%
Two or More Races 128,147 8.1% 106,064 9.0% 22,083 5.3%
Non-resident Alien 88,595 5.6% 45,210 3.8% 43,385 10.5%
Total 1,591,055 100.0% 1,176,656 100.0% 414,399 100.0%
Source: American Community Survey (ACS) 2015-2019 PUMS data. Sample excludes students living in group quarters, such as college dormitories or juvenile detention centers.
Washington Student Achievement Council Page 22 of 30Appendix B.
Table B. Distribution of students in Washington by household income
All Students K-12 Postsecondary
Income
Number Percent Number Percent Number Percent
Less Than $10,000 61,660 3.9% 35,885 3.1% 25,775 6.2%
$10,000 to $34,999 208,774 13.1% 143,926 12.2% 64,848 15.7%
$35,000 to $49,999 157,066 9.9% 118,249 10.1% 38,817 9.4%
$50,000 to $74,999 254,426 16.0% 188,908 16.1% 65,518 15.8%
$75,000 to $99,999 227,842 14.3% 171,814 14.6% 56,028 13.5%
$100,000 to $149,999 320,476 20.1% 241,670 20.5% 78,806 19.0%
$150,000 to $199,999 162,523 10.2% 121,595 10.3% 40,928 9.9%
$200,000 or More 198,288 12.5% 154,609 13.1% 43,679 10.5%
Total 1,591,055 100.0% 1,176,656 100.0% 414,399 100.0%
Source: American Community Survey (ACS) 2015-2019 PUMS data. Sample excludes students living in group quarters, such as college dormitories or juvenile detention centers.
Washington Student Achievement Council Page 23 of 30Appendix C.
Table C. Washington students with high-speed internet access at home by geographic region
All K-12 Postsecondary
Geographic Region
Students Students Students
Benton & Franklin Counties--Pasco, Richland
76.6% 75.6% 80.9%
(North) & West Richland Cities
Benton County (East Central)--Kennewick &
79.1% 78.1% 83.5%
Richland (South) Cities
Chelan & Douglas Counties 70.4% 68.8% 78.3%
Clallam & Jefferson Counties 76.9% 76.0% 80.0%
Clark County (North)--Battle Ground City &
84.6% 83.9% 88.3%
Orchards
Clark County (Southeast)--Vancouver (East),
87.8% 87.6% 88.7%
Camas & Washougal Cities
Clark County (Southwest)--Vancouver City (West
81.6% 79.9% 86.8%
& Central)
Clark County (West Central)--Salmon Creek &
88.4% 89.8% 83.7%
Hazel Dell
Cowlitz, Pacific & Wahkiakum Counties 76.9% 76.8% 77.2%
Grant & Kittitas Counties 71.6% 72.2% 69.9%
Grays Harbor & Mason Counties 75.1% 73.7% 81.6%
King County (Central)--Renton City, Fairwood,
87.6% 86.8% 89.9%
Bryn Mawr & Skyway
King County (Central)--Sammamish, Issaquah,
93.9% 94.1% 93.2%
Mercer Island & Newcastle Cities
King County (Far Southwest)--Federal Way, Des
83.5% 81.8% 89.5%
Moines Cities & Vashon Island
King County (Northeast)--Snoqualmie City,
93.4% 93.1% 94.6%
Cottage Lake, Union Hill & Novelty Hill
King County (Northwest Central)--Greater
95.6% 96.6% 92.7%
Bellevue City
King County (Northwest)--Redmond, Kirkland
94.3% 96.5% 89.0%
Cities, Inglewood & Finn Hill
King County (Northwest)--Shoreline, Kenmore &
91.9% 93.0% 89.3%
Bothell (South) Cities
King County (Southeast)--Maple Valley,
91.7% 91.4% 92.8%
Covington & Enumclaw Cities
King County (Southwest Central)--Kent City 84.7% 83.0% 89.2%
King County (Southwest)--Auburn City & Lakeland
82.3% 81.8% 83.7%
King County (West Central)--Burien, SeaTac,
81.0% 78.8% 87.5%
Tukwila Cities & White Center
Kitsap County (North)--Bainbridge Island City &
92.4% 93.5% 89.0%
Silverdale
Washington Student Achievement Council Page 24 of 30All K-12 Postsecondary
Geographic Region (cont’d)
Students Students Students
Kitsap County (South)--Bremerton & Port Orchard
89.0% 89.6% 87.2%
Cities
Lewis, Klickitat & Skamania Counties 68.5% 66.9% 74.6%
Pierce County (Central)--Tacoma City (Central) 75.5% 74.2% 78.3%
Pierce County (East Central)--Puyallup City &
89.2% 89.5% 88.3%
South Hill
Pierce County (North Central)--Tacoma (Port) &
86.2% 86.6% 84.7%
Bonney Lake (Northwest) Cities
Pierce County (Northwest)--Peninsula Region &
88.8% 89.0% 88.2%
Tacoma City (West)
Pierce County (South Central)--Tacoma City
77.5% 74.6% 85.9%
(South), Parkland & Spanaway
Pierce County (Southeast)--Graham, Elk Plain &
85.8% 85.4% 87.3%
Prairie Ridge
Pierce County (West Central)--Lakewood City &
83.9% 83.5% 84.8%
Joint Base Lewis-McChord
Seattle City (Downtown)--Queen Anne &
89.2% 88.8% 89.5%
Magnolia
Seattle City (Northeast) 87.0% 91.7% 83.6%
Seattle City (Northwest) 92.6% 93.5% 91.4%
Seattle City (Southeast)--Capitol Hill 88.5% 88.3% 88.8%
Seattle City (West)--Duwamish & Beacon Hill 86.3% 84.1% 92.1%
Skagit, Island & San Juan Counties 82.1% 80.9% 86.5%
Snohomish County (Central & Southeast)--Lake
89.4% 89.0% 91.0%
Stevens & Monroe Cities
Snohomish County (Central)--Everett City (Central
84.7% 83.4% 88.3%
& East) & Eastmont
Snohomish County (North)--Marysville &
84.3% 84.3% 84.3%
Arlington Cities
Snohomish County (South Central)--Bothell
92.8% 92.5% 94.1%
(North), Mill Creek Cities & Silver Firs
Snohomish County (Southwest)--Edmonds,
90.5% 90.3% 90.9%
Lynnwood & Mountlake Terrace Cities
Snohomish County (West Central)--Mukilteo &
91.7% 90.8% 94.0%
Everett (Southwest) Cities
Spokane County (East Central)--Greater Spokane
85.4% 85.3% 85.7%
Valley City
Spokane County (North Central)--Spokane City
90.5% 90.4% 91.0%
(North)
Spokane County (Outer)--Cheney City 73.8% 71.1% 79.9%
Spokane County (South Central)--Spokane City
85.9% 86.0% 85.6%
(South)
Washington Student Achievement Council Page 25 of 30All K-12 Postsecondary
Geographic Region (cont’d)
Students Students Students
Stevens, Okanogan, Pend Oreille & Ferry Counties
55.4% 54.7% 59.4%
Thurston County (Central)--Olympia, Lacey &
85.4% 84.3% 88.2%
Tumwater Cities
Thurston County (Outer) 88.2% 86.8% 92.6%
Walla Walla, Benton (Outer) & Franklin (Outer)
66.5% 66.0% 68.3%
Counties
Whatcom County--Bellingham City 81.3% 81.2% 81.5%
Whitman, Asotin, Adams, Lincoln, Columbia &
73.5% 65.9% 82.9%
Garfield Counties
Yakima County (Central)--Greater Yakima City 76.7% 75.3% 82.2%
Yakima County (Outer)--Sunnyside & Grandview
61.6% 61.0% 65.7%
Cities
Source: American Community Survey (ACS) 2015-2019 PUMS data. Sample excludes students living in group quarters, such as college dormitories or juvenile detention centers.
Note: Geographic regions listed are U.S. Census Public Use Microdata Areas (PUMAs), which are non-overlapping, statistical geographic areas that partition each state or equivalent entity into
geographic areas containing no fewer than 100,000 people each. The Census Bureau defines PUMAs for the tabulation and dissemination of decennial census and American Community Survey
(ACS) Public Use Microdata Sample (PUMS) data.
Washington Student Achievement Council Page 26 of 30Appendix D.
Table D. Washington students with computer access at home by geographic region
All K-12 Postsecondary
Geographic Region
Students Students Students
Benton & Franklin Counties--Pasco, Richland
91.7% 90.7% 96.3%
(North) & West Richland Cities
Benton County (East Central)--Kennewick &
92.6% 91.4% 97.8%
Richland (South) Cities
Chelan & Douglas Counties 86.7% 84.9% 95.3%
Clallam & Jefferson Counties 93.5% 91.9% 99.1%
Clark County (North)--Battle Ground City &
97.2% 96.9% 98.6%
Orchards
Clark County (Southeast)--Vancouver (East),
98.2% 97.9% 99.5%
Camas & Washougal Cities
Clark County (Southwest)--Vancouver City (West
91.2% 89.8% 95.7%
& Central)
Clark County (West Central)--Salmon Creek &
95.6% 95.1% 97.1%
Hazel Dell
Cowlitz, Pacific & Wahkiakum Counties 94.4% 93.8% 96.6%
Grant & Kittitas Counties 88.9% 86.4% 95.8%
Grays Harbor & Mason Counties 90.5% 88.9% 97.8%
King County (Central)--Renton City, Fairwood,
95.5% 94.5% 98.4%
Bryn Mawr & Skyway
King County (Central)--Sammamish, Issaquah,
98.2% 98.1% 98.9%
Mercer Island & Newcastle Cities
King County (Far Southwest)--Federal Way, Des
92.4% 90.7% 98.6%
Moines Cities & Vashon Island
King County (Northeast)--Snoqualmie City,
98.6% 98.4% 99.4%
Cottage Lake, Union Hill & Novelty Hill
King County (Northwest Central)--Greater
99.2% 99.1% 99.5%
Bellevue City
King County (Northwest)--Redmond, Kirkland
99.3% 99.8% 98.0%
Cities, Inglewood & Finn Hill
King County (Northwest)--Shoreline, Kenmore &
98.6% 98.4% 99.0%
Bothell (South) Cities
King County (Southeast)--Maple Valley,
99.0% 99.3% 98.1%
Covington & Enumclaw Cities
King County (Southwest Central)--Kent City 94.4% 93.2% 97.6%
King County (Southwest)--Auburn City &
94.5% 93.6% 97.4%
Lakeland
King County (West Central)--Burien, SeaTac,
88.6% 85.9% 96.7%
Tukwila Cities & White Center
Kitsap County (North)--Bainbridge Island City &
98.6% 98.7% 98.0%
Silverdale
Washington Student Achievement Council Page 27 of 30All K-12 Postsecondary
Geographic Region (cont’d)
Students Students Students
Kitsap County (South)--Bremerton & Port
96.6% 96.3% 97.4%
Orchard Cities
Lewis, Klickitat & Skamania Counties 92.9% 91.9% 96.9%
Pierce County (Central)--Tacoma City (Central) 94.0% 91.9% 98.6%
Pierce County (East Central)--Puyallup City &
97.2% 97.2% 97.2%
South Hill
Pierce County (North Central)--Tacoma (Port) &
97.3% 96.9% 98.9%
Bonney Lake (Northwest) Cities
Pierce County (Northwest)--Peninsula Region &
97.4% 97.3% 97.5%
Tacoma City (West)
Pierce County (South Central)--Tacoma City
92.5% 91.7% 94.8%
(South), Parkland & Spanaway
Pierce County (Southeast)--Graham, Elk Plain &
97.2% 96.6% 100.0%
Prairie Ridge
Pierce County (West Central)--Lakewood City &
93.2% 91.7% 97.1%
Joint Base Lewis-McChord
Seattle City (Downtown)--Queen Anne &
99.0% 98.9% 99.0%
Magnolia
Seattle City (Northeast) 98.8% 98.2% 99.3%
Seattle City (Northwest) 99.0% 99.3% 98.6%
Seattle City (Southeast)--Capitol Hill 96.2% 96.0% 96.5%
Seattle City (West)--Duwamish & Beacon Hill 96.1% 95.3% 98.2%
Skagit, Island & San Juan Counties 93.8% 92.7% 97.8%
Snohomish County (Central & Southeast)--Lake
98.3% 98.4% 97.8%
Stevens & Monroe Cities
Snohomish County (Central)--Everett City
94.2% 92.8% 98.2%
(Central & East) & Eastmont
Snohomish County (North)--Marysville &
97.3% 97.1% 97.9%
Arlington Cities
Snohomish County (South Central)--Bothell
98.5% 98.5% 98.5%
(North), Mill Creek Cities & Silver Firs
Snohomish County (Southwest)--Edmonds,
96.1% 95.2% 97.6%
Lynnwood & Mountlake Terrace Cities
Snohomish County (West Central)--Mukilteo &
96.1% 95.5% 97.6%
Everett (Southwest) Cities
Spokane County (East Central)--Greater Spokane
96.4% 96.5% 96.0%
Valley City
Spokane County (North Central)--Spokane City
95.2% 94.6% 97.2%
(North)
Spokane County (Outer)--Cheney City 97.1% 96.3% 98.9%
Spokane County (South Central)--Spokane City
97.0% 95.6% 99.7%
(South)
Washington Student Achievement Council Page 28 of 30You can also read