The Changing Nature of Visibility Impairment - NESCAUM
←
→
Page content transcription
If your browser does not render page correctly, please read the page content below

Visibility in the MANE-VU Region by Sharon Davis, David Healy, and Alexandra Karambelas

              The Changing Nature
             of Visibility Impairment
                    in the Mid-Atlantic/Northeast
                  Visibility Union (MANE-VU) Region

MANE-VU Class 1 Areas (clockwise from top left): Moosehorn Wilderness Area (ME), Roosevelt Campobello International Park
(New Brunswick, Canada), Lye Brook Wilderness Area (VT), Brigantine Wilderness Area (NJ), Presidential Range–Dry River
Wilderness Area (NH), and in the center, Acadia National Park (ME).

                            by Sharon Davis, David Healy, and Alexandra Karambelas

          Assessing the progress made in improving visibility at federally protected Class I
          areas located in MANE-VU states, the changing nature of regional haze in the
          Northeast, and the steps needed to continue progress in visibility improvement
          across the MANE-VU region.

                                   em • The Magazine for Environmental Managers • A&WMA • April 2022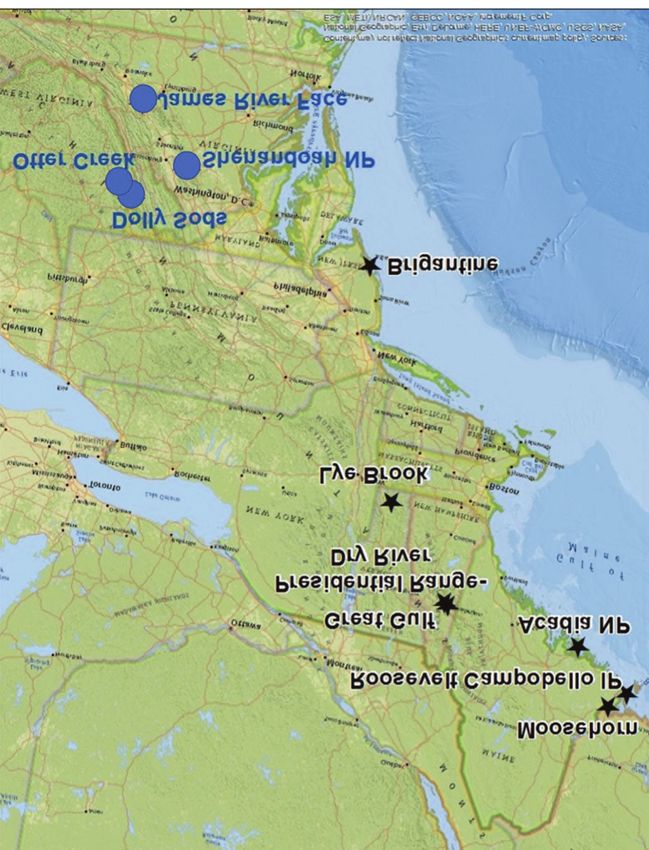
Visibility in the MANE-VU Region by Sharon Davis, David Healy, and Alexandra Karambelas

Under the U.S. Clean Air Act, Class I designation was           The first round of SIPs, due in 2008, assessed the milestone
given to 156 national parks, wilderness areas, memorial         year of 2018. For states in the Mid-Atlantic/Northeast Visibility
parks, and international parks across the United States.        Union (MANE-VU) region (see Figure 1), these SIPs identified
The U.S. Environmental Protection Agency (EPA) promul-          sulfur dioxide (SO2) as the predominant precursor to visibility
gated the 1999 Regional Haze Rule (RHR) that set goals          impairment. Thus, the reductions implemented for the first
for states to achieve natural visibility conditions (i.e., no   10-year planning period focused on reducing SO2 emissions
human-caused visibility impairment, in Class I areas by         from sources such as power plants and large industrial boilers.
2064). Per the RHR, all states—even those without Class I
areas—are required to develop a State Implementation Plan       MANE-VU states recently completed the second phase of
(SIP) to outline how they intend to contribute to progress      RH planning, which covers the period 2018–2028. As part
toward natural visibility conditions by 2064. States with       of this phase, the MANE-VU states evaluated emissions
Class I areas are further required to establish reasonable      inventory trends and regional haze metric trends from
progress goals for Class I areas within their borders. States   the baseline period of 2000–2004 to the most current
must submit a regional haze SIP revision every 10 years,        period. Measurements confirmed that large SO2 emissions
along with corresponding five-year progress reports, to          reductions were achieved, and that other pollutants, mainly
document reasonable progress towards the 2064 goal of           nitrates, are now more important contributors, changing the
natural visibility conditions.                                  nature of haze in the region.

                                                                                        Emissions Trends
                                                                                        Visibility impairment is primarily
                                                                                        caused by light scattering and ab-
                                                                                        sorption from aerosols. Aerosols may
                                                                                        be emitted by anthropogenic sources
                                                                                        such as combustion processes or by
                                                                                        natural sources such as lightning-
                                                                                        caused wildfires, or they may be
                                                                                        formed through secondary reactions
                                                                                        in the atmosphere. Secondary
                                                                                        aerosols in MANE-VU often result
                                                                                        from emissions of SO2 and oxides of
                                                                                        nitrogen (NOX) reacting with ammo-
                                                                                        nia to form ammonium sulfate and
                                                                                        ammonium nitrate, respectively.
                                                                                        MANE-VU uses data from emissions
                                                                                        inventories and in situ observations to
                                                                                        assess progress toward natural visibil-
                                                                                        ity in Class I areas.

                                                                                        Figure 2a shows the trend in annual
                                                                                        MANE-VU state total SO2 emissions
                                                                                        for 2002–2017 from EPA’s National
                                                                                        Emissions Inventory (NEI) and from
                                                                                        sources such as power plants and
                                                                                        large industrial facilities that report
                                                                                        directly to EPA’s Air Markets Program
                                                                                        Database (AMPD) (hatched bars).
                                                                                        There is a clear downward trend in
                                                                                        total SO2 emissions that is largely
                                                                                        driven by a decline in SO2 emissions
                                                                                        from AMPD sources, which are an
  Figure 1. Map of MANE-VU region. Class I areas indicated with
                                                                                        overwhelming contributor to total
  black stars. Nearby Class I areas outside of MANE-VU indicated with
                                                                                        SO2 emissions. Because large point
  blue circles.
                                                                                        source emission reductions were a

                              em • The Magazine for Environmental Managers • A&WMA • April 2022
Visibility in the MANE-VU Region by Sharon Davis, David Healy, and Alexandra Karambelas

The Mid-Atlantic/Northeast Visibility Union (MANE-VU)
MANE-VU includes 11 states—Maine, Vermont, New Hampshire, Rhode Island, Massachusetts, Connecticut,
New York, New Jersey, Pennsylvania, Delaware, and Maryland—as well as the District of Columbia, the
Penobscot Nation (ME), and the St. Regis Mohawk Tribe (NY). The MANE-VU Regional Planning Organization
was formed to coordinate actions necessary to improve visibility at national parks and wilderness areas in the
Northeast and Mid-Atlantic region. MANE-VU provides support to its member agencies by facilitating technical
assessments, evaluations of regional air pollution, forums for discussion, and coordination with other regions.
A Technical Support Committee assesses the nature of regional haze, the sources that contribute to regional
haze, and the technical tools that states can use to develop their programs.

focus of the first regional haze planning phase, federal and        effort was focused on reducing SO2 emissions and AMPD
state regulations to reduce these emissions contributed to a       sources are a moderate contributor to NOX. Further,
decline in coal use. This, in turn, led to reductions in SO2       former and current stationary source NOX emission
emissions at AMPD sources. Further, the economics of natural       control programs, such as the NOX SIP Call, the Clean
gas availability have likely contributed to recent reductions in   Air Interstate Rule, and the Revised Cross State Air Pollution
SO2 emissions, and state interest in renewable energy initia-      Rule Update, are mainly focused on reducing ozone
tives may be contributing to the decline in coal use and the       pollution; therefore, most of the associated NOX reductions
associated reduction in SO2.                                       occur during the summer ozone season. To address regional
                                                                   haze, MANE-VU has found that year-round NOX controls
Similarly, annual NOX emission trends for state total and          are needed.
AMPD contributions (hatched bars) in the MANE-VU region
show a clear downward trend between 2002 and 2017 (see             The impact of the reduced SO2 and NOX emissions can
Figure 2b), though declines are not quite as steep as for          be seen in the sulfate and nitrate measurements from the
SO2. This is, in part, because the first regional haze planning     Interagency Monitoring of Protected Visual Environments

     White Paper Offers
       Illegal Dumping
    Prevention, Mitigation                                                    Best Practi
                                                                                         ce
                                                                             Dumping O s In Addressing Illeg
                                                                                                                al
                                                                                          f Durable W
           Strategies                                                        For Policy

                                                                            Correspon
                                                                            Secondary
                                                                                        Makers
                                                                                      ding Autho
                                                                                                      aste – A G

                                                                                                 r: Dr. Calvin
                                                                                                                 uide

                                                                                                               Lakhan
                                                                                      Author: Na
                                                                                                 na Adjei

      In Best Practices in Addressing Illegal Dumping of                   Faculty of
                                                                                        Environmen
                                                                                                        tal and Ur
                                                                                                                   ban Chan
      Durable Waste authors, Dr. Calvin Lakhan and Nana                                                                     ge

      Adjei of York University, identify the drivers of illegal
      dumping of durable, often bulky items, as well as
      approaches to address the problem. Topics include:
      •   Improving access to proper disposal options
      •   Raising awareness
      •   Physical prevention strategies
      •   Strengthening enforcement

                                                                                Download Your FREE Copy
                                                                     MattressRecyclingCouncil.org/Illegal-Dumping

                               em • The Magazine for Environmental Managers • A&WMA • April 2022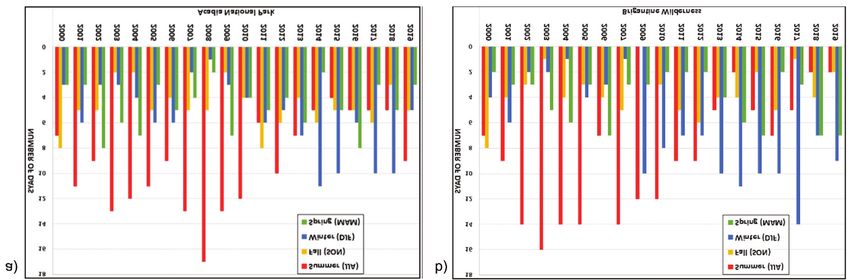
Visibility in the MANE-VU Region by Sharon Davis, David Healy, and Alexandra Karambelas

                                                                                    (IMPROVE) visibility monitoring
                                                                                    network. Sulfate concentrations
                                                                                    (µg/m3) decline considerably from
                                                                                    2000 to 2020 for all MANE-VU
                                                                                    Class I areas (see Figure 3a).
                                                                                    Nitrate concentrations trended
                                                                                    downward to a trough around
                                                                                    2010 and then generally leveled
                                                                                    off until 2020 at all Class I areas
                                                                                    except Brigantine Wilderness
                                                                                    Area, which did not reach a low
                                                                                    point and level off until 2017 (see
                                                                                    Figure 3b). In general, sulfate
                                                                                    peaks in summer (see Figure 3c)
                                                                                    while nitrate peaks in winter (see
                                                                                    Figure 3d). In the winter, nitrogen
                                                                                    dioxide (NO2), a component of
                                                                                    NOX, exhibits a longer lifetime
                                                                                    due to colder temperatures and
                                                                                    increases the potential for conver-
                                                                                    sion to nitrate rather than being
                                                                                    removed from the atmosphere.
                                                                                    Nitrate is also more stable under
                                                                                    cooler conditions, leading to
                                                                                    higher concentrations.

                                                                                    Regional Haze
                                                                                    Metric Trends
                                                                                    Progress toward natural visibility
                                                                                    conditions is evaluated using data
                                                                                    collected from the IMPROVE visi-
                                                                                    bility monitoring network. EPA
                                                                                    guidance requires regional haze
                                                                                    SIPs to focus on improving visibil-
                                                                                    ity on the 20% most impaired
Figure 2. (a) Statewide total SO2 emissions (height of bar) and SO2                 days—that is, the 20% worst
emissions from EPA Air Markets Program Data (AMPD) sources                          visibility days accounting only for
(hatched area) in the MANE-VU states (2000–2017). (b) Statewide total               anthropogenic sources of visibility
NOX emissions (height of bar) and NOX emissions from AMPD sources                   impairment.1 Since 2000, there
(hatched area) in the MANE-VU states (2002–2017).                                   has been a seasonal shift in the
                                                                                    20% most impaired days. From

                                                To address regional haze, MANE-VU has found
                                                that year-round NOX controls are needed.

                       em • The Magazine for Environmental Managers • A&WMA • April 2022
Visibility in the MANE-VU Region by Sharon Davis, David Healy, and Alexandra Karambelas
Figure 3. Annual average (a) sulfate and (b) nitrate concentrations (µg/m3) at MANE-VU Class I areas
(2000–2020). Monthly average (c) sulfate and (d) nitrate concentrations (µg/m3) at MANE-VU Class I
areas (January 2018–December 2020). In all panels, observations at Acadia are shown in dark blue,
Brigantine are in orange, Great Gulf Wilderness are in gray, Lye Brook are in yellow, and Moosehorn
are in light blue. In (b), some of the Class I area 2019 nitrate concentrations may be artificially low due
to missing January data.
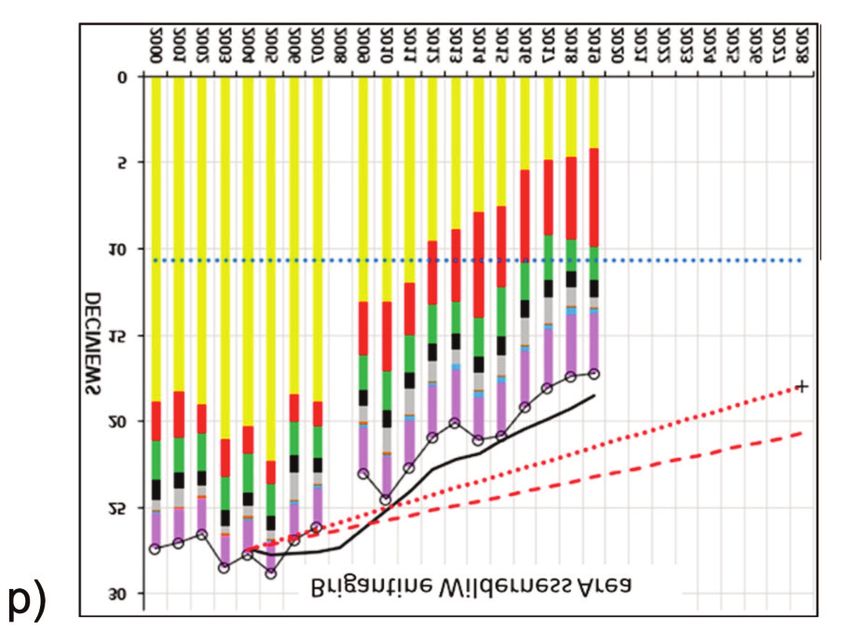
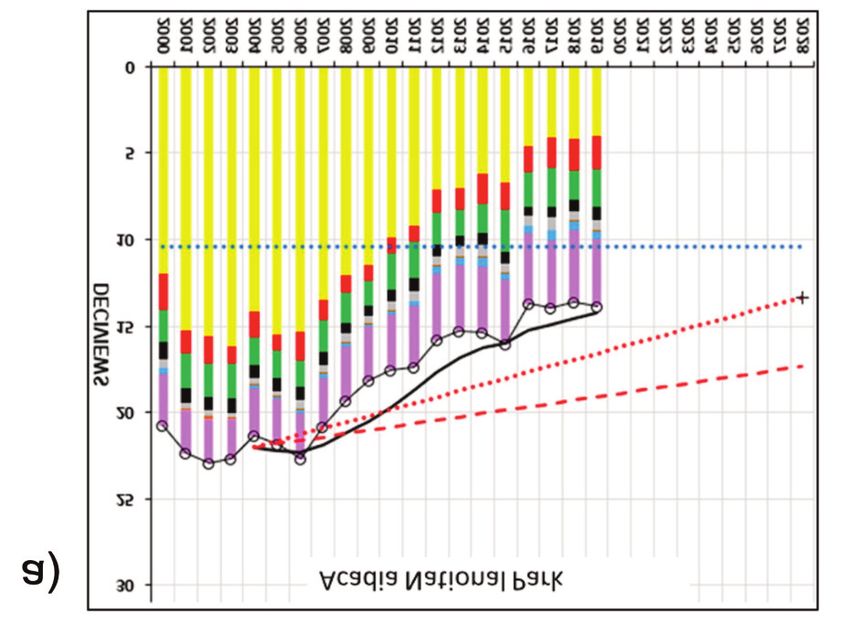
2000 through 2012 for most MANE-VU Class I areas, most from baseline 2000–2004 visibility levels to the 2064
of the 20% most impaired days occurred during the sum- natural visibility conditions goal. However, current five-year
mer months (see Figure 4, red bars), when sulfates tend to average haze indices for the 20% most impaired days are
dominate the aerosol fraction. However, since 2013, most not at or below the level of the 2028 RPGs. Therefore,
have occurred during winter months (see Figure 4, blue further progress is needed to achieve 2028 RPGs at all
bars), when the nitrate fraction contribution increases. Spring MANE-VU Class I areas. While not all MANE-VU states’
and fall contributions to 20% most impaired days fluctuate RH SIPs have been finalized, MANE-VU used photo-
year to year and don’t exhibit a notable trend. chemical modeling to establish RPGs for 2028.2
Annual and five-year rolling average haze indices, measured Conclusions
in deciviews, at MANE-VU Class I areas are compared to MANE-VU Class I areas are realizing visibility improve-
Uniform Rate of Progress (URP, red dashed line) and Rea- ments, but states in the region are no longer able to
sonable Progress Goal (RPG, black crosshatch at 2028 and prioritize emission reductions for one pollutant alone.
red-dotted glide path) projections in Figure 5. URP and Haze indices on the 20% most impaired days have
RPGs are calculated metrics used in regional haze SIPs to decreased considerably since 2000, primarily due to
evaluate progress toward the goal of natural visibility condi- decreases in sulfate concentrations. However, nitrate
tions. Annual haze indices (black line with circles) at repre- contributions are collectively becoming a larger factor in
sentative MANE-VU Class I areas are below the URP, visibility impairment, reflecting a seasonal shift such that
meaning that current haze indices for the 20% most im- a majority of 20% most impaired days in the MANE-VU
paired days are already below the level of the glide path region occur during winter months.
em • The Magazine for Environmental Managers • A&WMA • April 2022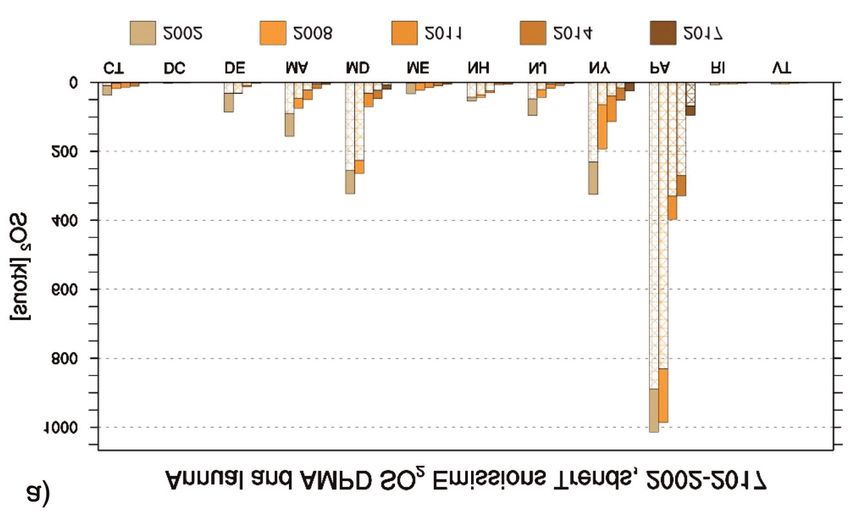
Visibility in the MANE-VU Region by Sharon Davis, David Healy, and Alexandra Karambelas

  Figure 4. Seasonal contributions to 20% most impaired days 2000–2019 at two MANE-VU Class I
  areas: (a) Acadia National Park and (b) Brigantine Wilderness Area.

  Figure 5. Visibility metric trends for 20% most impaired days 2000–2019 for two MANE-VU Class I areas:
  (a) Acadia National Park and (b) Brigantine Wilderness Area. Glide-paths for the URP are shown in red
  dashed lines, and RPGs are shown in red dotted lines. The black line is the five-year average Haze Index.

Reductions in sulfate and nitrate concentrations over time,        et al.4 found that if SO2 emissions were to decrease while
although significant, are not as steep as the downward trends       NOX emissions remained at 2015 levels, projected nitrate
in their precursor SO2 and NOX emissions across sites in           concentrations may even increase in the future. Therefore,
MANE-VU Class I areas. Recent research into the reduction          concurrent reductions of NOX and SO2 emission are needed
of gaseous emissions in the eastern United States found that       during the winter to realize meaningful decreases in winter-
although SO2, NO2, and particulate sulfate have declined           time nitrate concentrations. It is important to move forward
considerably, particulate nitrate concentrations in the winter-    with a multi-pollutant, year-round focus to achieve the 2028
time have remained largely unchanged.3,4 In one case, Shah         RPGs in Class I areas across the MANE-VU states to continue

                              em • The Magazine for Environmental Managers • A&WMA • April 2022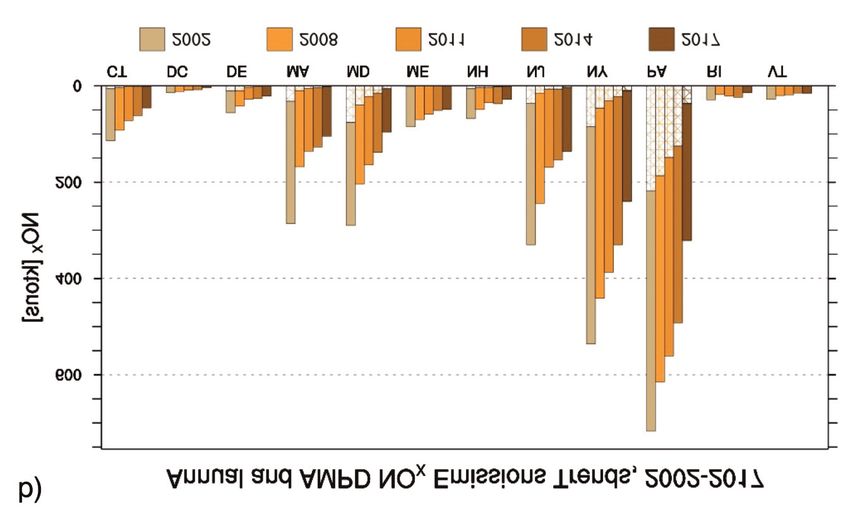
Visibility in the MANE-VU Region by Sharon Davis, David Healy, and Alexandra Karambelas

making progress towards the 2064 goal of reaching natural                                  called for implementation of this measure in its own states as
visibility conditions. For these reasons, the MANE-VU states                               well as upwind states that contribute to visibility impairment at
included as a measure in their second regional haze planning                               MANE-VU Class I areas. MANE-VU will continue to support
SIPs the year-round operation of existing NOX controls for                                 more year-round NOX control measures, as well as measures
large sources such as coal-fired power plants.5 MANE-VU                                     that will reduce SO2 emissions. em

   Sharon Davis is the Manager of the Bureau of Evaluation and Planning at the New Jersey Department of Environmental Protection
   and is Co-Chair of the MANE-VU Technical Support Committee. Email: Sharon.davis@dep.nj.gov. David Healy
   is a Senior Scientist at the New Hampshire Department of Environmental Services and is Co-Chair of the MANE-VU Technical Support
   Committee. Email: David.s.healy@des.nh.gov. Alexandra Karambelas, Ph.D., is an environmental analyst with Northeast States
   for Coordinated Air Use Management (NESCAUM), a regional organization providing technical and policy advice to the air quality
   agencies of eight northeastern states. Email: akarambelas@nescaum.org.

   Disclaimer: The views and opinions expressed in this article are those of the authors and do not represent the official views of the
   participating agencies.

   Acknowledgment: Portions of the work described in this article were developed by Tom Downs, Chief Meteorologist, Maine Depart-
   ment of Environmental Protection, and are jointly supported by the state air quality agency members of MANE-VU. Data collected for
   MANE-VU can be accessed at https://otcair.org/manevu/.

References
1. U.S. Environmental Protection Agency (EPA). Guidance on Regional Haze State Implementation Plans for the Second Implementation Period, August 10, 2019;
   https://www.epa.gov/visibility/visibility-guidance-documents.
2. Mid-Atlantic/Northeast Visibility Union (MANE-VU). Ozone Transport Commission/Mid-Atlantic Northeastern Visibility Union 2011 Based Modeling Platform
   Support Document – October 2018 Update, October 18, 2018; https://otcair.org/MANEVU/Upload/Publication/Reports/OTC%20MANE-
   VU%202011%20Based%20Modeling%20Platform%20Support%20Document%20October%202018%20-%20Final.pdf.
3. Feng, J.; Chan, E.; Vet, R. Air quality in the eastern United States and Eastern Canada for 1990–2015: 25 years of change in response to emission reductions
   of SO2 and NOX in the region; Atmospheric Chemistry and Physics 2020, 20 (5), 3107-3134; https://doi.org/10.5194/acp-20-3107-2020.
4. Shah, V.; Jaeglé, L.; Thornton, J.A.; Lopez-Hilfiker, F.D.; Lee, B.H.; Schroder, J.C.; Campuzano-Jost, P.; Jimenez, J.L.; Guo, H.; Sullivan, A.P.; Weber, R.J.; Green,
   J.R.; Fiddler, M.N.; Bililign, S.; Campos, T.L.; Stell, M.; Weinheimer, A.J.; Montzka, D.D.; Brown, S.S. Chemical feedbacks weaken the wintertime response of
   particulate sulfate and nitrate to emissions reductions over the eastern United States; Proceedings of the National Academy of Sciences 2018, 115 (32), 8110-
   8115; https://doi.org/10.1073/pnas.1803295115.
5. Mid-Atlantic/Northeast Visibility Union (MANE-VU). Statement of the Mid-Atlantic/Northeast Visibility Union (MANE-VU) States Concerning a Course of
   Action Within MANE-VU Toward Assuring Reasonable Progress for the Second Regional Haze Implementation Period (2018–2028), August 25, 2017;
   https://otcair.org/MANEVU/Upload/Publication/Formal%20Actions/MANE-VU%20FLM%20Final%20Ask%208-25-2017.pdf.

                                                              39TH INTERNATIONAL CONFERENCE
                                                              ON THERMAL TREATMENT TECHNOLOGIES
                                                              & HAZARDOUS WASTE COMBUSTORS
                                                                            May 5-6, 2022 • West Palm Beach, FL

         Attend the premier conference on thermal treatment technologies!
    Now in its 39th year, IT3/HWC provides a forum for the discussion of                         Panels and technical sessions will cover:
    state-of-the-art technical information, regulations, and public
                                                                                                   • Keynote – Recasting the Role of Municipal Solid
    policy on thermal treatment technologies and their relationship to
                                                                                                     Waste Incineration in the Future of Integrated Solid
    air emissions, greenhouse gases, sustainability, and climate change.
                                                                                                     Waste Management
     Attend the technical tour to the Solid Waste Authority of Palm                                • PFAS Thermal Treatment Perspectives
     Beach County on Wednesday, May 4!                                                             • Combustion of Fluorinated Organic Compounds
                                                                                                   • PFAS and Waste Incineration
     Sponsorship and display opportunities are still available. Choose                             • PFAS Emission Control Strategies
     from various levels to meet your company’s needs.                                             • Aspects of Waste Incineration
                                                                                                   • Advancements in Air Pollution Control Technologies
                               Thank you to our Gold Sponsors!
                                                                                                 A pre-conference virtual course will be offered
                                                                                                 on April 26 and 28 on Air Pollution Control.

       Register now and find the complete conference program at www.awma.org/IT3.

                                       em • The Magazine for Environmental Managers • A&WMA • April 2022
You can also read