The Business of Seafood - A Snapshot of Ireland's Seafood Sector - BIM.ie

 
CONTINUE READING
The Business of Seafood - A Snapshot of Ireland's Seafood Sector - BIM.ie
The Business of Seafood
A Snapshot of Ireland’s Seafood Sector

2021                                     bim.ie
The Business of Seafood - A Snapshot of Ireland's Seafood Sector - BIM.ie
€1.26
                                                    BILLION
                                                                                   1,993                     160                   319                        16,647
                                                                             Number of Registered      Number of Seafood        Number of                  Total number of
                                                                               Fishing Vessels            Processors         Aquaculture Sites            people employed

                                                                            DOMESTIC SALES VALUE

THE IRISH SEAFOOD ECONOMY 2021                                              €418M                                          €318m
                                                                                                                           Retail Value
                                                                                                                                                       €100m
                                                                                                                                                       Foodservice Value

                    Value of
                  Aquaculture
                                           Value of
                                        Irish Seafood
                                                                            TOP SELLING SPECIES                                                          GDP
                                                                                                                                                        Growth
                                                                                                                                                    +15%
                                                                            SALMON (Up 2%) COD (Down 8%)

                  €175M
                  -2% Growth
                                        €619M
                                        +1% Growth
                                                                            €122M                             €42M
                                                                                                                           -57%
                                                                                       €281M                               €83M                  UK IMPORT
                                                                                                                                                 SHARE 2021
                                                                                                                                                                     UK IMPORT
                                                                                                                                                                    SHARE 2020
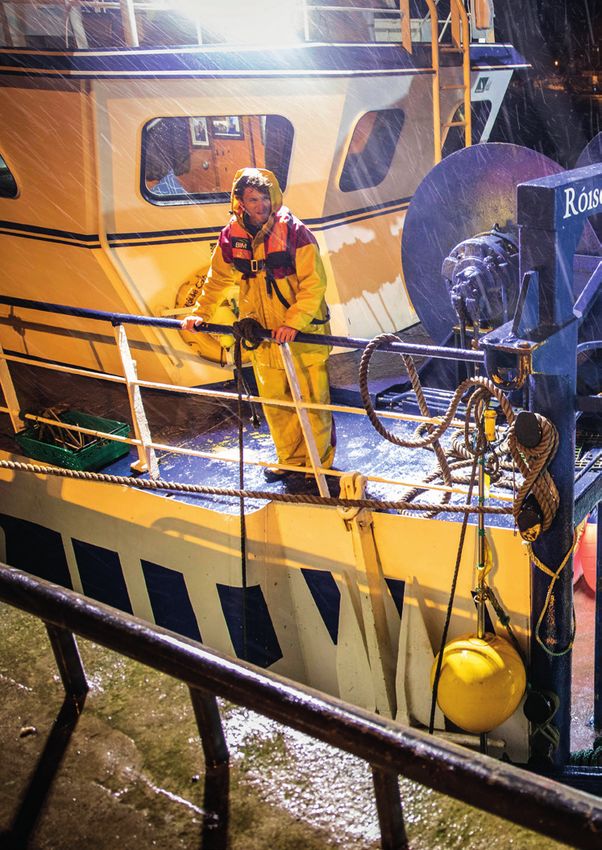
Our Biggest Fishing Ports
                                                                            worth of seafood
                                                                            was imported into
                                                                                                               worth of seafood
                                                                                                               was imported from
                                                                                                                                                   30%                 58%

                                €444M
(Value of Landings)
                                                                            Ireland in 2021                    the UK in 2021
           Killybegs                                       +2%
       €121M
                                of seafood was landed by Irish and
                                non-Irish vessels into our ports in 2021:
                                                                             €674M                    +11%            IRELAND’S
                                                                                                                      MAIN
                                                                                                                                    +17%

                                                                                                                                           EU €397M
        Castletownbere

       €112M                    IRISH LANDINGS: €293M                        Export Value           Value Growth
                                                                                                                      EXPORT
                                                                                                                                    +48%
                                                                                                                                           ASIA €80M
                                NON-IRISH LANDINGS: €151M                                                             MARKETS       -13%
                                                                                                                                           UK €79M
2 // Bord Iascaigh Mhara                                                                                                                           The Business of Seafood 2021 // 3
The Business of Seafood - A Snapshot of Ireland's Seafood Sector - BIM.ie
Chartering New Territory

Despite the ongoing challenges presented by the Covid-19 pandemic
and the additional impacts of the Trade and Cooperation Agreement
agreed between the EU and the UK, 2021 saw the Irish seafood
industry recover from the trading difficulties experienced in 2020.
Overall, the value of the sector to the economy rose to €1.26 billion,
up from €1.09 billion in 2020. This is the highest value on record and
represents a growth in GDP of 15.3% compared to 2020.

The main driver of growth was from exports with     This comprised 8,705 employed directly in
an increase in value of 11% to €674 million in      fisheries, aquaculture and processing and a
2021. Purchases of seafood within the hospitality   further 7,942 in downstream employment in
sector increased by 14% in 2021, following from     ancillary and support sectors. Employment
a decline of 53% in 2020. Domestic consumption      remains high in coastal regions, reaching 16% in
grew by 3% to €418 million, while the seafood       Donegal, 7% on the southern and eastern coasts
balance of trade (exports – imports) grew by        and 6% in Galway-Clare, generating significant
45% following strong export growth, particularly    socioeconomic value in these areas.
in EU markets. Overall investment in the sector
increased during 2021 to €454 million (+8%),        Employment in the burgeoning seafood-tech
showing a renewed confidence in the sector.         sector comprising companies involved in high
                                                    value-adding techniques and processes using
While overall volumes of seafood production         seafood has continued to increase. In 2020, the
reduced by 10%, largely as a result of the quota    latest figures available, 741 people were employed
transfers to the UK TCA agreement, higher prices    in the sector in 52 companies, an increase of 71%
for wild caught seafood and significant growth in   since 2015. Turnover has increased by 126% in
the farmed shellfish                                the same period and the opportunities for further
sector saw the value of production increase         expansion are significant.
to €619 million.

Employment in the sector also remained stable       An increase in the value of
in 2021 despite the challenges. A total of 16,647   the Seafood economy to
people were employed directly and indirectly
within the sector, an increase in overall
employment of 1%.
                                                                     €1.26                Led mainly

                                                                      BILLION             by growth
                                                                                          in exports

                                                                          The Business of Seafood 2021 // 5
The Business of Seafood - A Snapshot of Ireland's Seafood Sector - BIM.ie
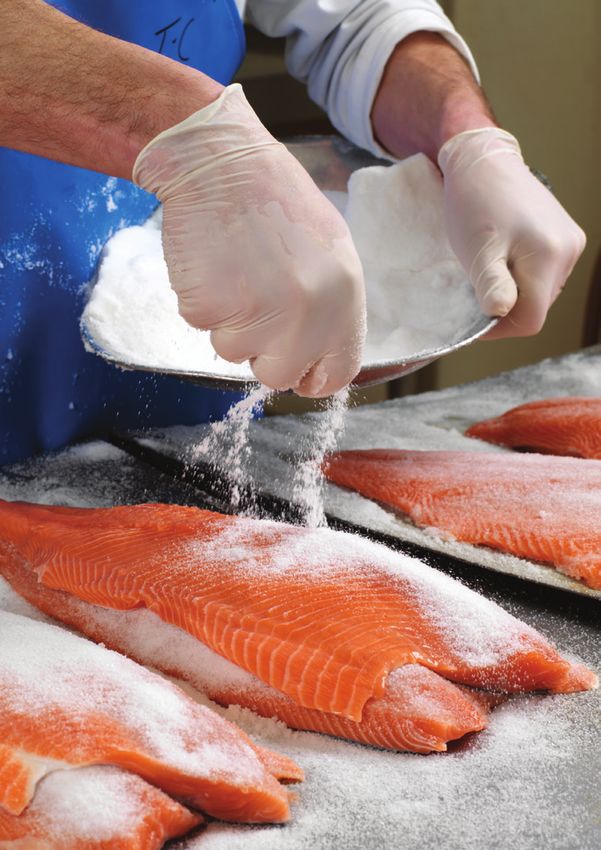
Seafood Consumption remains                           In 2021, Government                                     In contrast to wild caught production, the value
                                                      investment in the                                       of the farmed finfish sector decreased by 14%,
steady
                                                      seafood sector                                          mainly due to lower prices for farmed salmon. The                           Private investment, after
                                                                                                              farmed shellfish sector fared much better with                              falling quite significantly
Demand for Irish seafood increased in 2021            continued to grow,                                      production of oysters, rope and seabed cultured
although growth was modest, with consumption          amounting to                                                                                                                        in 2020, increased by
                                                                                                              mussels increasing significantly in value and
of seafood in increasing by 3% to €418 million. The
                                                      €233 million                                            volume. The oyster sector saw a 22% increase
                                                                                                                                                                                          €10 million (+5%),
hospitality sector was the main contributor to this
growth, with increased sales of 12% (€100 million),
                                                      AN INCREASE OF 11%
                                                                                                              in value and 13% increase in volume as EU
                                                                                                              foodservice outlets opened during the year. Both
                                                                                                                                                                                          TOTALLING €221 MILLION
despite the continued uncertainty in seafood
                                                                                                              mussel sectors – rope and seabed cultured – also        Private investment was also aided by the
consumption worldwide due to Covid-19. Sales of
                                                                                                              saw increases in value of 24% and 31% compared          continued availability of grant aid through the
seafood into the retail sector declined by 3% in
volume but grew by 1% in value to €318 million in     Seafood Production recovers                             to 2021.                                                EMFF and government grants. These financial
2021, reflecting the challenging market situation                                                                                                                     injections were critical to sustaining the
at the start of the year.
                                                      The value of seafood production rose in 2021            Renewed confidence in the sector                        industry and ensuring businesses remained
                                                      by 1% to €619 million, an increase of €7 million
                                                      compared to 2020. Overall volume fell by 10% to
                                                                                                              as investment grows                                     viable, given the many obstacles they needed
Overall, the volume of exports increased by 10%,                                                                                                                      to overcome during the period.
with value increasing by 11% to €674 million          356,600 tonnes mainly due to reduced quotas as
                                                                                                              In 2021, Government investment in the seafood
                                                      a result of the TCA deal with the UK, which saw
mainly driven by a resurgence in the main EU
                                                      quotas transferred from the EU to the UK. Prices,
                                                                                                              sector continued to grow, amounting to €232             The fallout from Brexit
markets in Spain, Italy and France in the latter                                                              million, an increase of 11%. Support from the
half of the year. The value of exports of salmon      that had fallen in 2020 due to the lack of market
                                                                                                              European Maritime and Fisheries Fund (EMFF)             While the overall outlook for 2021 is positive, the
to France, UK, Germany and Belgium continued to       demand and the closure of the food service sector,
                                                                                                              along with a national investment programme              EU/UK Trade & Cooperation Agreement (TCA)
increase in 2021, with total growth to all markets    picked up in 2021, increasing for most species. This
                                                                                                              contributed to a wide range of projects including       deal agreed at the end of 2020 brought a sudden
of 13% with a total value of €129 million. Exports    resulted in a 2% increase in the value of wild-caught
                                                                                                              the improvement of infrastructure in fishing ports      and dramatic shift in the landscape for the entire
of Dublin Bay prawns also increased in value by       fish to €444 million, an increase of €11 million. By
                                                                                                              and harbours, grant aid for fishers, fish farmers       Irish seafood sector. The deal saw quota transfers
26% in 2021, reflecting the re-opening of the         volume, both Irish and non-Irish landings fell 7%
                                                                                                              and fish processors, R&D and innovation projects,       across EU member states to the UK, totalling
markets in Italy and France for frozen at sea         and 20% respectively, due largely to Covid-19 and
                                                                                                              as well as direct supports to the sector to offset      almost €200 million. The main impact on the
prawns. The shellfish sector likewise saw increased   new rules regarding UK vessels landing into Ireland
                                                                                                              the impacts of Covid-19.                                Irish fleet is for Ireland’s two biggest fisheries
value in exports of oysters (+40%) and mussels        following from Brexit. Killybegs and Castletownbere
                                                                                                                                                                      - mackerel and Dublin Bay prawns - which saw
(+10%) mainly into the EU market. For the pelagic     continued to be the top two Irish ports in volume       Private investment, after falling quite significantly   quota reductions of 26% and 14% respectively.
species, there was an increase in both the volume     and value terms. Non-Irish landings were important      in 2020, increased by €10 million (+5%), totalling      The impact on the fishing fleet of reduced quotas
and value of exports of mackerel (16% in volume       to these two ports as well as to Dingle in the south-   €221 million, reflecting renewed confidence of the      and for the processing sector as a result of less
and 10% in value) and blue whiting (82% in volume     west, where non-Irish landings made up 36% of the       sector as it emerged from the Covid-19 pandemic         raw material being available is evident and will
and 62% in value).                                    total volume of landings into the port.                 and the effects of Brexit. This confidence in the       continue to be a factor for the foreseeable future.
                                                                                                              seafood sector was shared by financial lending          Vital seafood trade routes, primarily through
Imports of seafood increased by 7% in volume          Among the most important species for Irish
                                                                                                              institutions and helped to encourage private            the ‘land-bridge’ via the UK, have been curtailed,
terms but fell in value by 16%. Salmon, shrimps       vessels, mackerel and Dublin Bay prawns
                                                                                                              investment to continue to invest where in a             particularly since the beginning of 2021. By the
and prawns, cod and tuna continued as the main        continued as the most valuable species landed.
                                                                                                              position to do so. However, private investment          end of 2021, a new trading pattern for seafood
imported species in 2021. There was a marked          However, following from the quota transfers
                                                                                                              remains well below pre-Covid-19 levels in 2018          has emerged with altogether less reliance on the
reduction in the UK import share which almost         under the TCA between the EU and the UK,
                                                                                                              and 2019, when this figure was at a level of €250       UK markets and a shift to European and further
halved, down from 58% to 30%. The dramatic            the volume and value of landings of mackerel
                                                                                                              million.                                                afield market opportunities.
decline was almost certainly associated               decreased by 18% and 23% respectively. Prices
with the impacts of Brexit and the new costs          for mackerel also fell for the first time in several
                                                                                                                                                                      The potential impacts of the wider Brexit deal
                                                      years. Conversely, despite the quota transfers, the
associated with trading with the UK.                                                                                                      The value of seafood        on the Irish seafood industry prompted the
                                                      volume and value of Dublin Bay prawns’ landings
                                                      increased 11% and 16% respectively, reflecting
                                                                                                                                          production rose in          establishment of a Seafood Task Force to consider
                                                                                                                                          2021 by 1% to €619          measures to mitigate these impacts. The Task
                                                      the re-opening of the EU food service sector in
                                                                                                                                                                      Force recommended some 16 funding schemes,
                  Seafood balance                     the second half of the year. Prices for Dublin Bay                                  million, an increase
                                                                                                                                                                      with a proposed overall funding requirement of
                   of trade                           prawns overall increased by 4% in 2021 compared                                     of €7 million               €423 million. Amongst the recommendations

      45%
                                                      to 2020. Whitefish species such as haddock, hake,                                   compared to 2020.           were longer-term fleet re-structuring measures,
                           (exports                   whiting and megrim showed a similar pattern
                                                                                                                                                                      including voluntary decommissioning that aim
                           imports)
                           grew
                                                      with increases in volume and value in 2021 as the
                                                      market situation improved during the year and                                       PRODUCTION ROSE             to restore balance between fishing capacity and
                                                                                                                                                                      available fishing opportunities.
                           by 45%                     prices increased.                                                                   IN 2021 BY 1%
6 // Bord Iascaigh Mhara                                                                                                                                                                    The Business of Seafood 2021 // 7
The Business of Seafood - A Snapshot of Ireland's Seafood Sector - BIM.ie
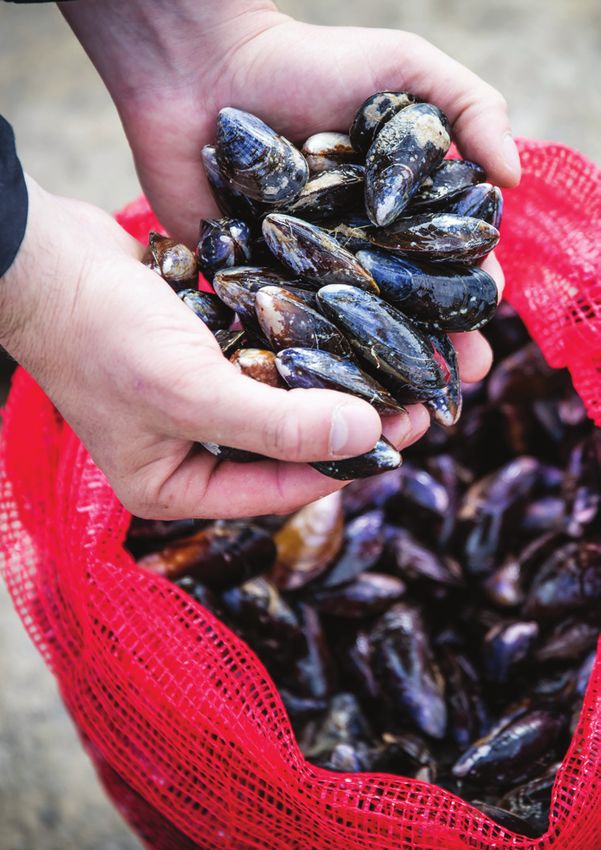
Short-term supports for the catching and
processing sectors to mitigate the immediate
impacts of the TCA were also proposed, in the
form of temporary cessation and liquidity aid
schemes. While longer-term initiatives in the
areas of processing, aquaculture, public marine
infrastructure, and Blue Growth that will help to
strengthen and enhance coastal communities
especially dependent on the seafood industry
were further recommended, at a projected cost of
€280 million.

Rising costs - the new challenge
There is no doubt that the initiatives
recommended by the Seafood Task Force
represent a significant level of investment that
will help to rebalance and reshape the industry.
However, the developments in the Ukraine in early
2022 have created a whole new set of challenges,
which are immediate and threaten the viability
of the whole sector. The price of marine diesel
has increased exponentially since the start of the
Ukrainian crisis, while the price and availability of
materials and equipment has also risen sharply.
Coming so soon after the economic shocks of
Covid-19 and Brexit, the resilience of the sector
is going to be tested to the full during 2022 and
beyond. It will require a collective effort from
the industry backed with financial and technical
support from BIM and Government to withstand
this new challenge and remain profitable.

8 // Bord Iascaigh Mhara                                The Business of Seafood 2021 // 9
The Business of Seafood - A Snapshot of Ireland's Seafood Sector - BIM.ie
Breakdown of Seafood - Gross Domestic Product                                                                 Breakdown of Employment by Region

 GDP Components             2017    2018        2019      2020        2021        Growth      % of Seafood
                                                                                 Rate 2020     Economy

 Domestic Consumption        470     486        494        406         418            +3%         33%

 Private Investment          220     267        257        211         221            +5%         18%
                                                                                                                      NORTH 16%
 Government Investment       170     170        185        209         233         +11%           18%

 Exports - Imports           345     316        291        271         393         +45%           31%                 NORTH WEST 4%
                                                                                                                      WEST 6%
 GDP                        1,205   1,239       1,227     1,097       1,265        +15%          100%

                                                                                                                      SOUTH WEST 4%
The Irish Seafood Economy 2021                                                                                        SOUTH 7%
                                                                                                                      SOUTH EAST 5%
             Exports                                                                    Domestic
            - Imports                                                                  Consumption                    NORTH EAST 7%
         31%                                                                            33%
                                            THE IRISH
                                            THE IRISH
                                            SEAFOOD
                                            SEAFOOD
                                            ECONOMY
                                            ECONOMY
                                              2020
                                            2021
        Government                                                                        Private
        Investment                                                                      Investment

         18%                                                                            18%                   Region                  Total
                                                                                                                                    Population
                                                                                                                                                  Coastal
                                                                                                                                                 Population
                                                                                                                                                               Coastal
                                                                                                                                                              Employed
                                                                                                                                                                            Direct
                                                                                                                                                                           Seafood
                                                                                                                                                                                       Downstream
                                                                                                                                                                                         Seafood
                                                                                                                                                                                                         Share of
                                                                                                                                                                                                          Coastal
                                                                                                                                                                         Employment    Employment       Employment

                                                                                                              North                  159,192       74,989      27,488      1,938           4,327             16%

                                                                                                              North West             292,630       64,059      25,328       602            1,065             4%
Direct Employment in the Irish Seafood Sector           Total Employment in the Irish Seafood Sector
                                                                                                              West                   376,875       64,704      27,034      1,017           1,751             6%

    2,848                                                                     8,705                           South West             342,606       90,323      36,718       922            1,523             4%
Fisheries                                               Direct Total Employees                                South                  542,868      115,533      49,815      1,823           3,526             7%

 1,984                                                                   7,942                                South East             808,737       91,681      36,467      1,108           1,845             5%
Aquaculture                                             Indirect Total Employees                              North East            2,238,957      83,775      36,139      1,295           2,609             7%

         3,873                                                                                       16,647   Republic of Ireland   4,761,865     585,064     238,989      8,705          16,647             7%
Processing                                              Direct and Indirect Total Employees

                            8,705
Direct Total Employees

10 // Bord Iascaigh Mhara                                                                                                                                                             The Business of Seafood 2021 // 11
The Business of Seafood - A Snapshot of Ireland's Seafood Sector - BIM.ie
Source
Where does Irish seafood come from?

In 2021 the volume of seafood produced by the Irish seafood sector
fell by 10% to 357,000 tonnes. However strong growth in wild-caught
fish prices lead to an overall increase in the total value of seafood
by 1% to €619m. This is the highest value of seafood produced
recorded in the Business of Seafood series.

The volume of landings into Irish ports fell by 12%      Mackerel was the most valuable species landed
in 2021, to 315,000 tonnes, with this decline being      by the Irish fleet in 2021, with over 60,000 tonnes
driven by the non-Irish fleets which decreased by        worth €73m. This was a decrease in value of
20%. Landings from the Irish fleet decreased by          23% on 2020 due to combined decreases in
7%, largely due to the quota transfers under the         volume and price of -18% and -5% respectively.
TCA (Trade & Co-Operation Agreement) with the            Landings of Dublin Bay prawn increased by 16%
UK.                                                      to €53m following good volume and value growth
                                                         throughout the year. Strong price increases were
In terms of value, however, both Irish and non-Irish     seen in shellfish species particularly crab, lobster
fleets increased the value of their landings. This       shrimps and razor clams (+20%).
was achieved by increased average fish prices.
Most ports suffered decreased landing volumes,           Aquaculture production increased volumes by
but the value of landings increased into most            11%. However, the value of the sector fell by 2%
ports.                                                   to €175m. The salmon sector saw the biggest
                                                         decline in value with volumes produced stable
Killybegs and Clogherhead were the only ports            at 13,400 tonnes. Difficult market conditions led
to see declines in value, both volume-driven.            to price falls and the value declining by 14% to
Castletownbere saw reduced volumes by non-               €109m. Strong performances were seen in the
Irish fleets of -20%. However, the value of these        other aquaculture sectors with increased volumes
landings were equal to 2020, due to price inflation.     and value generated. The oyster sector increased
The value of landings increased significantly in         volumes by 13% to nearly 10,000 tonnes, with the
Dunmore East, Howth and Ros an Mhíl -mainly from         value increasing by 22% to €45m. Rope mussels
the Irish fleet - while high-value landings from non-    increased volumes by 14% with a similar price
Irish and Irish fleets led to strong growth in Dingle.   increase leading to value growth of 31% to over
                                                         €8m, while seabed cultured mussels increased in
                                                         value by 24% to €9m.

                The oyster sector                         Rope Mussels
                increased value                           increased value
                by 22%                                    growth of 31%

€45M +22% €8M
value increase                                            value increase
                                                                                        +31%
                                                                               The Business of Seafood 2021 // 13
The Business of Seafood - A Snapshot of Ireland's Seafood Sector - BIM.ie
THE SOURCE OF                                                                     REGIONAL VALUE / VOLUME                                                            Greencastle

IRISH SEAFOOD                                                                     DOMESTIC FISH LANDINGS
                                                                                                                                      Killybegs

                                                                                    €444M
                     By Value (€)                    By Volume (tonnes)

                                                                                                                                                                             Clogherhead

                     €619M                              356,600
                                                                                    IN 2021                                               Ros a Mhíl
                                                                                                                                                                                 Howth

                            +1%                              -10%
                                                                                    314,600 TONNES

                                                                                        +2%
                                                                                                                                                         Dunmore
                                                                                                                                   Dingle                East
                                                                                                                                                                       Kilmore
                                                                                                                                                                       Quay

                                          SEA-
                                                                                      VALUE GROWTH                         Castletownbere         Union Hall

                     €444M               CAUGHT          314,600
                            +2%           FISH               -12%
                                                                                  Value of Landings - €M                                       Volume of Landings - Tonnes
                  Irish: €293m / +2%                    Irish: 203,800 / -7%
                                                                                                                   Non-            Share of                 Non-                   Share of
                 Non-Irish €151m / +3%                Non-Irish: 110,800 / -20%   Port                     Irish           Total                 Irish                   Total
                                                                                                                   Irish           Non-Irish                Irish                  Non-Irish

                                                                                  Killybegs                 85      36      121      30%       114,000      83,300     197,300        42%

                                                                                  Castletownbere            27      85      112      76%        11,200      20,000      31,200        64%
                                          FARMED
                     €111M                FINFISH
                                                         13,900                   Dingle                    9       13      22       59%         6,500      3,600       10,100        36%

                            -14%                              -1%                 Dunmore East              16      3       19       16%        10,700       500        11,200        4%

                                                                                  Kilmore Quay              13      0       13       0%          4,100        -          4,100        0%

                                                                                  Ros A Mhil                13      0       13       0%          2,200        -          2,200        0%

                                                                                  Clogherhead               11      0       11       0%          1,600        -          1,600        0%

                                                                                  Howth                     10      1       11       9%          2,800       200         3,000        7%

                                                                                  Greencastle               8       1        9       11%         3,200       300         3,500        9%
                                          FARMED
                       €64M              SHELLFISH
                                                         28,100                   Union Hall                8       1        9       11%         1,900       200         2,100        10%

                            +26%                             +17%                 Other Ports               93      11      104      11%        45,600      2,700       48,300        6%

                                                                                  Total                    293     151     444       34%       203,800     110,800     314,600        35%

14 // Bord Iascaigh Mhara                                                                                                                                    The Business of Seafood 2021 // 15
The Business of Seafood - A Snapshot of Ireland's Seafood Sector - BIM.ie
BREAKDOWN OF TOP 20 LANDED SPECIES BY IRISH FLEET
                            €73M                                  60,700
  1. Mackerel               -23%                                  Tonnes

                            €53M                        6,400
  2. Dublin Bay Prawn       +16%                        Tonnes

                            €21M               7,300
  3. Crab                   +42%               Tonnes

                            €18M             4,100
  4. Monkfish                -6%             Tonnes

                            €16M            18,900
  5. Horse Mackerel         +35%            Tonnes

                            €11M       5,700
  6. Haddock                +40%       Tonnes

                            €10M      3,900
  7. Hake                   +14%      Tonnes

                            €9M       39,000
  8. Blue Whiting            -6%      Tonnes

                            €9M       2,800
  9. Megrim                 +15%      Tonnes

                            €9M       500
  10. Lobster               +63%      Tonnes

                            €8m      2,900
  11. Tuna                   +2%     Tonnes

                            €7M      4,900
  12. Whelk                 -15%     Tonnes

                            €6M     2,700
  13. Scallop               +59%    Tonnes
                                                           Total Landed Value
                            €5M     3,200
  14. Whiting               +29%    Tonnes

                            €4M    200
  15. Shrimps               +27%   Tonnes

                                                        €293M
                            €3M    600
  16. Razor Clam            +12%   Tonnes

                            €3M    14,200
  17. Sprat                  -2%

                            €3M
                                   Tonnes

                                   11,900
                                                                 +2%
  18. Boarfish              -13%   Tonnes

                            €3M    200
  19. Sole                  +61%   Tonnes                Volume (Tonnes)

  20. Herring
                            €3M
                             -4%
                                   5,500
                                   Tonnes                 203,800
                            €19M              8,200
  21. Others                 +5%              Tonnes

16 // Bord Iascaigh Mhara
The Business of Seafood - A Snapshot of Ireland's Seafood Sector - BIM.ie
THE IRISH FISHING FLEET                                                                                                            AQUACULTURE PRODUCTION
   3000
                                                                                                                                   BY VALUE / VOLUME
                                                                                                                                   Aquaculture production by value (€M)

                                                                                                                                   Salmon                                                              Ropes Mussels
   2000

                                                                                                                                    €109M                                                                      €8M
                                                                                                                                   -14%                                                                           +31%
   1000
                                                                                                                                   Irish Rock Oysters                      TOTAL VALUE                    Other Finfish

        0
              2009    2010    2011    2012    2013    2014    2015    2016    2017    2018    2019    2020    2021    2022
                                                                                                                                    €45M
                                                                                                                                   +22%

                                                                                                                                   Seabed Cultured Mussels
                                                                                                                                                                          €175M-2%
                                                                                                                                                                                                               €2M
                                                                                                                                                                                                                     -9%

                                                                                                                                                                                                       Other Shellfish
Polyvalent Segment:                                                Beam Trawler Segment:
This segment contains the vast majority of the fleet.              Vessels dedicated to beam trawling, a simple trawling            €9M                                                                        €2M
These vessels are multi-purpose and include small                  method used predominantly in Irish inshore waters
inshore vessels (netters and potters), and medium                  except in the southeast, where it is used to catch              +24%                                                                         +123%
and large offshore vessels targeting whitefish,                    flatfish such as sole and plaice.
pelagic fish and bivalve molluscs.
                                                                   Aquaculture Segment:
Specific Segment:                                                  These vessels must be exclusively used in the
Vessels which are permitted to fish for bivalve                    management, development and servicing of
molluscs and aquaculture species.                                  aquaculture areas and can collect spat from wild
                                                                                                                                   Aquaculture production by volume (Tonnes)
                                                                   mussel stocks as part of a service to aquaculture
Refrigerated Seawater (RSW) Pelagic Segment:                       installations.
Vessels engaged predominantly in fishing for pelagic                                                                               Salmon                                                              Ropes Mussels
species (herring, mackerel, horse mackerel and blue
whiting, mainly).                                                                                                                   13,400                                                              11,800
                                                                                                                                   0%                                                                             +14%
                                                                                                                                                                          TOTAL VOLUME
                 2009       2010   2011    2012    2013    2014    2015    2016    2017    2018    2019    2020    2021    2022

 Aquaculture         67      81      87      96     106     107     109     102      97     100      91      92      97      97    Irish Rock Oysters                                                     Other Finfish
 Beamer

 Pelagic

 Polyvalent
 General
                     11

                     23

                 1,305
                             11

                             23

                          1,356
                                     12

                                     24

                                   1,401
                                             12

                                             23

                                           1,434
                                                     13

                                                     23

                                                   1,466
                                                             13

                                                             23

                                                           1,431
                                                                     13

                                                                     23

                                                                   1,411
                                                                             14

                                                                             23

                                                                           1,421
                                                                                     13

                                                                                     23

                                                                                   1,381
                                                                                             14

                                                                                             23

                                                                                           1,420
                                                                                                     14

                                                                                                     23

                                                                                                   1,417
                                                                                                             13

                                                                                                             23

                                                                                                           1,417
                                                                                                                     10

                                                                                                                     23

                                                                                                                   1,391
                                                                                                                             10

                                                                                                                             23

                                                                                                                           1,386
                                                                                                                                    9,900
                                                                                                                                   +13%

                                                                                                                                   Seabed Cultured Mussels
                                                                                                                                                                          42,000
                                                                                                                                                                               +11%
                                                                                                                                                                                                                500
                                                                                                                                                                                                                   -11%

                                                                                                                                                                                                       Other Shellfish
 Polyvalent
                 491        492    488     487     490     489     477     440     395     435     359     358     329     331
 Potting

 Specific        147        156    149     150     148     139     134     146     142     153     134     129     146     146
                                                                                                                                    5,800                                                                       600
                                                                                                                                   +33%                                                                           +80%
 Grand Total    2,044 2,119 2,161 2,202 2,246 2,202 2,167 2,146 2,051 2,145 2,038 2,032 1,996 1,993

18 // Bord Iascaigh Mhara                                                                                                                                                                The Business of Seafood 2021 // 19
Processing
Irish Seafood Processing

As Covid-19 restrictions eased from April 2021 onwards, the
consequent opening up of food service channels was a welcome
boom, particularly for shellfish processors.

This resulted in buoyant exports to well-established   The impact of the UK’s departure from the EU
European markets. In terms of Asia, impressive         was evident in the drop in exports, but was even
sales of mackerel and shellfish were achieved in       more marked in the fall in imports. This meant
China, and likewise there was strong export growth     the UK was no longer the dominant import
for pelagics to Japan. In contrast, the dominance in   source for Irish processors. The resumption of
demand from west Africa in 2020 waned, as pelagic      meaningful processing activity and trade was
processors diverted from Nigeria and pursued           a major relief for processors. However, logistics
higher value options in Asia and Europe. Whitefish     constraints, escalating fuel, energy, and other
processors struggled to regain their position in       supply-chain costs coupled with labour sourcing
key markets in the early part of 2021, as many         issues continued to present real challenges for the
European customers opted for national supply           processing sector.
options fostered during the pandemic.

                                                                            The Business of Seafood 2021 // 21
Number of Seafood Processing Companies by Revenue                                      Breakdown by Revenue and by Main Seafood Category

                                                                                        Category                     < €1M            €1M - €10M            > €10M            Total              Growth 2019

          86                           45                  29
                                                                             Total      Whitefish                      40                  20                 15               75                     +4%

         Companies
           < €1m
                                    Companies
                                    €1m - €10m
                                                          Companies
                                                           > €10m
                                                                           160
                                                                           Companies
                                                                                        Shellfish

                                                                                        Salmonids
                                                                                                                       31

                                                                                                                       13
                                                                                                                                           12

                                                                                                                                           10
                                                                                                                                                              4

                                                                                                                                                              2
                                                                                                                                                                               47

                                                                                                                                                                               25
                                                                                                                                                                                                      +3%

                                                                                                                                                                                                     -15%

                                                                                        Pelagic                            2                3                 8                13                     +2%

                                                                                        Total                          86                  45                29               160                     0%

                                                                                        Breakdown of Industry         54%                  28%               18%             100%

Irish Seafood Processing Companies by Region

 Region          No. of Companies   Total Employed
                                                                                        Average Turnover per Processing Sector
 North                  23               853

 North West

 West                   22
                            8            205

                                         303                          23               €15m
                                                                                                                Pelagics       Shellfish        Salmonids     Unspecified / Whitefish       Grand Total

 South West             15               395

 South                  29               899

 South East             31               374                                           €12m
 North East

 Total
                        32

                       160
                                         844

                                        3,873                8                          €9m

                                                                           32
                                                              22
                                                                                        €6m

                                                                                        €3m

                                                     15                    31           €0m
                                                                                                     2015                  2016                 2017               2018               2019                2020
                                                            29

22 // Bord Iascaigh Mhara                                                                                                                                                           The Business of Seafood 2021 // 23
Total Value of Irish Processing Sector 2015 - 2020

  €M
 800

 700

 600

 500

 400

 300

 200

 100

    0
              Pelagics             Shellfish       Salmonids          Whitefish / Unspecified          Grand Total

                            2015           2016   2017         2018             2019            2020

 Total Volume of Irish Processing Sector 2015 - 2020

‘000 Tonnes
 400

 350

 300

 250

 200

 150

 100

   50

    0
              Pelagics             Shellfish       Salmonids          Whitefish / Unspecified          Grand Total

                            2015           2016   2017         2018             2019            2020

24 // Bord Iascaigh Mhara
Seafood Consumption
In 2021 the consumption of seafood in Ireland grew modestly
by 3% to €418m with the hospitality sector being the main
contributor. After a collapse in hospitality spending in 2020 of
54%, the sector grew in 2021 by 12%.

Food Consumption – Retail                              Food Consumption – Hospitality
Sales of seafood in the retail sector declined by      The foodservice sector was again impacted
3% in volume, but grew by 1% in value to €318m in      severely in 2021, being one of the most affected
2021, crystalising the significant gains made in the   sectors in Ireland, due to the continued lockdowns
sector in the previous year. Fresh sales increased     in the early part of the year. The most severe
by 2%, while frozen sales increased by 1%. Tinned      restrictions were in place for the first five months,
seafood products saw a significant decline of 8%       with only take-away and delivery food available.
having increased strongly in 2020.                     From May onwards, restrictions were eased until
                                                       December when following a further surge in
Sales of salmon increased by 6% in volume, with        Covid infections, restrictions on the hospitality
lower prices leading to a decrease in value of 2%.     sector were re-introduced. Overall, purchases of
Cod sales were also down 9% in volume and 8%           seafood in the hospitality sector increased by 14%
in value. Higher volumes led to an 11% increase        after the decline of 53% in 2020. In the medium
in the value of prawns sales, despite prices only      term, the share of seafood in overall hospitality
increasing marginally. Strong growth was seen          purchases is showing a consistent decline, falling
in sales of domestically caught haddock, crab          by over 15% since 2016.
and farmed mussels (+20%, +49% and +15%
respectively).

+12% growth                                            Prawn sales increased in

€418M
                                                       value despite prices only
                                                       increasing marginally

estimated value of
seafood consumed
in Ireland                                             11%               VALUE
                                                                         INCREASE
                                                                             The Business of Seafood 2021 // 27
All Ireland Foodservice Turnover (€B)

       €418M                              €318m               €100m
                                                                                      €10B

        estimated value of                   the value of     estimated value of
        seafood consumed                   seafood retailed   seafood consumed                                                                                        €2.2B
             in Ireland                       in Ireland      in the foodservice       €8B
                                                                                                                                               €2.2B
                                                                    sector                                                     €2.1B
                                                                                                      €2.2B

Top Retail Species by Value 2021
                                                                                       €6B                                                                            €6.3B
  1. Salmon                        €122M                         +2%                                                                           €6.0B
                                                                                                                               €5.6B

  2. Cod                           €32M                -8%                                            €5.4B
                                                                                                                                                                                                                €1.4B

  3. All Prawns                    €28M              +11%
                                                                                                                                                                                            €1.2B
                                                                                       €4B

  4. Tuna                          €21M             -3%
                                                                                                                                                                                                                €3.7B
                                                                                                                                                                                            €3.3B
  5. Pollock                       €21M             -2%

  6. Haddock                       €14M         +20%                                   €2B

  7. Hake                          €10M        +5%

  8. Mackerel                      €8M        0%

                                   €8M        +1%                                         0
  9. Fish Mix                                                                                         2016                     2017             2018                  2019                   2020               2021

  10. Trout                        €5M       +26%                                                                                             Ireland          Northern Ireland

  11. Coley                        €4M       -17%

                                   €2M      +29%                                   Foodservice Purchase Growth (Seafood) 2020 - 2021
  12. Sea Bass

  13. Whiting                      €2M      +3%                                         SEAFOOD           -53%                                                                        14%
                                                                                          BACON               -52%                                                                          17%
  14. Whitefish                    €2M      +43%
                                                                                            BEEF                         -43%                                                 2%
  15. Crab                         €2M      +49%                                           LAMB                      -53%                                                      8%
                                                                                           PORK                         -45%                                                         13%
  16. Mussels                      €1M      +15%
                                                                                        POULTRY                  -49%                                                                                       35%

                                   €1M      -37%                                           TOTAL                     -47%                                                              16%
  17. Pangasius
                                                                                               -60%       -50%              -40%       -30%    -20%        -10%        0%           +10%          +20%   +30%       +40%
  18. Other Species                €25M              -5%

                                                                                                                                                        2020   2021

28 // Bord Iascaigh Mhara                                                                                                                                                                     The Business of Seafood 2021 // 29
Food-service Operator Purchase Share 2016-2021

             Seafood        Bacon     Beef   Lamb   Pork     Poultry   Fruit & Vegetables      Total
  115

  110

  105

  100

    95

    90

    85

    80
              2016             2017          2018          2019        2020                 2021

30 // Bord Iascaigh Mhara
Trade
Imports and Exports of Seafood

In 2021 exports grew by 10% in volume and 11% in value, led by
increased volumes of Irish organic salmon, mackerel and Dublin
Bay prawns.

Throughout 2021, prices fluctuated significantly       significant increase in imports of low-value
between species with salmon and mackerel facing        blue whiting. These imports are due to non-Irish
difficult market conditions with prices decreasing     landings of this low value species into Killybegs.
by 3% and 6% respectively. International demand        Imports of salmon and other freshwater species
for shellfish species led to strong price growth for   fell by 23% in volume and 13% in value terms, with
species such as Dublin Bay prawn, crab, lobsters       increased salmon prices offsetting to some extent
and mussels which can be seen in the landings of       the reduction in volume. Whitefish imports fell
the Irish fleet in the previous chapter. Exports of    by 4% in volume and value terms, while shellfish
pelagic species increased by 25% in volume, but        volumes fell by 20%. However, the value of these
only 8% in value. Exports to Asia grew by 48% in       rose by 5% due to the strong price increases in
value terms, recovering strongly after a difficult     this category in 2021. The major declines in these
2020. Exports to the EU grew in volume and price       categories could be associated with the impacts
terms leading to strong value growth of 17%.           of Brexit and the new costs relating to trading
Lower prices for pelagic species led to a reduction    with the UK. The value of imports from the UK fell
of 13% in the value of exports to Africa, despite      from €194m in 2020 to €83m in 2021, a reduction
increased volumes. Exports to the UK fell by 13%       of 57%. In terms of volume, imports from the UK
in volume and value terms. Generally, there was a      only fell by 11%. Imports doubled in value terms
shift away from exporting to the UK with increased     from Africa and Asia, while they increased over
export volumes to Europe, Africa and Asia.             75% from the Nordic countries and the rest of the
                                                       world. The EU has now become our main import
Imports of seafood increased by 7% in volume           partner for the first time after value growth of
terms although value fell by 16% due to a              17% in 2021.

                                                                    +89%
                                                           -57%
                                                                     +17%
Imports doubled in value                                                               +110%
terms from Africa and
Asia while they increased
over 75% from the Nordic                                          +116%
countries and the Rest of
the World. The EU has now
become our main import
partner for the first time
after value growth of 17%
in 2021.

                                                                            The Business of Seafood 2021 // 33
TRADE - IMPORTS                                                                                   BREAKDOWN OF TOP 20 IMPORTED SPECIES 2021
                                                                                                                           €57M                                          7,800
                                                                                                   1. Salmon                -9%                                          Tonnes

TOTAL CHANGE                                                                                                               €43M                                 5,100

                                                -16%                             +7%
                                                                                                   2. Shrimps and Prawns   +16%                                 Tonnes
OF IMPORTS                                                                                                                 €31M                        4,700
                                                                                                   3. Cod                   -8%                        Tonnes

                                                                                                                           €23M                  4,700
                                                                                                   4. Tuna                  -27%                 Tonnes
                                              Total Value Change           Total Volume Change
                                                    Imports                       Imports                                  €14M              3,300
                                                                                                   5. Breaded Whitefish     +9%              Tonnes

                                                                                                                           €11M         70,900
                                                                                                   6. Seaweed               +9%         Tonnes

Main Import Markets Value Growth                                                                                           €10M         41,500
                                                                                                   7. Blue Whiting         +120%        Tonnes

                                                                                                   8. Marine Animal Feed   €8M         2,000
                                                                                                                            -73%       Tonnes
    European                                               Nordics        Rest of                    Ingredients
                                              Asia                                       Africa
     Union                                                (non - EU)     the World                                         €7M        4,000
    +17%                                +110%             +89%          +77%          +116%        9. Mackerel             +31%       Tonnes
                             United
                            Kingdom                                                                                        €6M        800
                                                                                                   10. Saltwater Fish       +1%       Tonnes
                            -57%
                                                                                                                           €6m        600
                                                                                                   11. Sea Bass            +52%       Tonnes

                                                                                                                           €6M        800
                                      Value             Value          Volume          Volume      12. Dublin Bay Prawn     -16%      Tonnes
Main Markets                           €M                €M            Tonnes          Tonnes
                                      2020              2021            2020            2021
                                                                                                                           €6M        1,600
                                                                                                   13. Monkfish            +1655%     Tonnes
                                                                                                                                                                          Total Import Value
European Union                         99                116           33,800          29,900                              €5M       1,300
                                                                                                   14. Herring              -71%     Tonnes
United Kingdom                        194                83            54,800          48,500
                                                                                                                           €4M       700
Asia                                   15                32             2,700           4,900      15. Tilapia             +16%      Tonnes

                                                                                                                                                                     €281M
Nordics (Non-Eu)                       12                23            64,000          79,600                              €4M       1,200
                                                                                                   16. Pollack              +3%      Tonnes
Rest Of The World                      10                18             2,100           3,700
                                                                                                                           €4M       1,000
Africa                                 4                  9             1,100           2,300      17. Hake                 -10%

                                                                                                                           €3M
                                                                                                                                     Tonnes

                                                                                                                                    1,000
                                                                                                                                                                            -16%
Grand Total                           334                281           158,500        168,900      18. Whitefish            -54%    Tonnes

                                                                                                                           €3M      7,700
                                                                                                   19. Fish Meal            -21%    Tonnes                               Volume (Tonnes)

                                                                                                   20. Crab
                                                                                                                           €2M
                                                                                                                            -44%
                                                                                                                                    600
                                                                                                                                    Tonnes                               168,900
                                                                                                                           €28M                       7,600
                                                                                                   21. Others              +39%                       Tonnes

34 // Bord Iascaigh Mhara                                                                                                                                            The Business of Seafood 2021 // 35
TRADE - EXPORTS                                                                                BREAKDOWN OF TOP 20 EXPORTED SPECIES 2021
                                                                                                                         €129M                                                          11,400
                                                                                                1. Salmon                 +13%                                                          Tonnes

TOTAL CHANGE                                                                                                             €109M                                                69,600

                                             +11%                             +10%
                                                                                                2. Mackerel               +10%                                                Tonnes
OF EXPORTS                                                                                                               €60M                          5,100
                                                                                                3. Dublin Bay Prawn       +26%                         Tonnes

                                                                                                                         €45M                    5,200
                                                                                                4. Crab                   +19%                   Tonnes
                                            Total Value Change           Total Volume Change
                                                  Exports                       Exports                                  €35M                 6,000
                                                                                                5. Oysters                +40%                Tonnes

                                                                                                                         €35M                 72,000
                                                                                                6. Blue Whiting           +62%                Tonnes

Main Export Markets Value Growth                                                                                         €35M                 82,200
                                                                                                7. Seaweed                +12%                Tonnes

                                                                                                                         €29M             21,100
    European                                                            Rest of       Middle
                                                                                                8. Horse Mackerel         -26%            Tonnes
                             Asia
     Union                                                             the World       East                              €22M         15,400
    +17%                    +48%                                       +21%           +2%       9. Fish Meal              -28%        Tonnes
                                           United
                                                            Africa
                                          kingdom                                                                        €20M        800
                                          -13%          -13%                                    10. Lobsters              +44%       Tonnes

                                                                                                                         €19m        1,400
                                                                                                11. Shrimps and Prawns    +31%       Tonnes

                                                                                                                         €17M        8,700
                                    Value             Value          Volume          Volume     12. Mussels               +10%       Tonnes
Main Markets                         €M                €M            Tonnes          Tonnes
                                    2020              2021            2020            2021
                                                                                                                         €17M        2,600
                                                                                                13. Whelk                 -12%       Tonnes
                                                                                                                                                                    Total Export Value
European Union                      338                397           95,200          107,900                             €13M      2,600
                                                                                                14. Monkfish              -4%      Tonnes
Asia                                 54                80            23,500          36,800
                                                                                                                         €8M     2,000
United Kingdom                       91                79            52,500          45,600     15. Megrim                +6%    Tonnes

                                                                                                                                                                €674M
Africa                               75                65            76,500          88,500                              €8M     3,900
                                                                                                16. Herring               +26%   Tonnes
Rest Of The World                    22                27            28,000          28,500
                                                                                                                         €7M     5,100
Middle East                          25                26            27,400          25,400     17. Fish Fats and Oils    +40%

                                                                                                                         €7M
                                                                                                                                 Tonnes

                                                                                                                                 2,300
                                                                                                                                                                     +11%
Grand Total                         605                674           303,100        332,700     18. Tuna                  -23%   Tonnes

                                                                                                                         €6M     1,400
                                                                                                19. Clams and Cockles     +24%   Tonnes                         Volume (Tonnes)

                                                                                                20. Queen Scallops
                                                                                                                         €6M
                                                                                                                          +23%
                                                                                                                                 300
                                                                                                                                 Tonnes                           332,700
                                                                                                                         €47M                     12,200
                                                                                                21. Others                +4%                     Tonnes

36 // Bord Iascaigh Mhara                                                                                                                                       The Business of Seafood 2021 // 37
Main Export Partners
Top 10 Export Partners

 RANK PARTNER COUNTRY       VALUE 2020   VALUE GROWTH MAIN EXPORT SPECIES SHARE OF PARTNER TOTAL
 1    FRANCE                  €164M          +34%             SALMON               36%
                                                              OYSTERS              15%
                                                                CRAB               13%
 2       UNITED KINGDOM       €79M            -13%           FISH MEAL             23%
                                                              SALMON               18%             2
                                                        FISH FATS AND OILS          8%                         7
                                                                                                                   8
 3       SPAIN                €65M           +20%      DUBLIN BAY PRAWN            18%                 1
                                                             MONKFISH              16%
                                                                                                   3           4
                                                                CRAB               13%
                                                                                                                                                                10
 4       ITALY                €58M           +32%      DUBLIN BAY PRAWN            71%
                                                      SHRIMPS AND PRAWNS           14%                                 9        6
                                                             MUSSELS                4%
 5       NIGERIA              €38M            -23%         BLUE WHITING            63%
                                                             MACKEREL              28%
                                                                                                           5
                                                         HORSE MACKEREL             9%
 6       CHINA                €28M           +126%           MACKEREL              50%
                                                              OYSTERS              13%
                                                                CRAB               13%
 7       GERMANY              €28M           +10%             SALMON               67%
                                                             MACKEREL              19%
                                                              HERRING               6%
 8       POLAND               €26M            -41%            SALMON               61%
                                                             MACKEREL              31%
                                                              HERRING               4%
 9       EGYPT                €20M            +4%            MACKEREL              62%
                                                         HORSE MACKEREL            38%
 10      JAPAN                €18M           +61%            MACKEREL              55%
                                                         HORSE MACKEREL            26%
                                                              HERRING              10%
38 // Bord Iascaigh Mhara                                                                                                  The Business of Seafood 2021 // 39
COVID-19
Once again, during 2021, Covid-19 affected seafood trade globally
and in Ireland, albeit to a lesser extent than in 2020. In January
2021, exports to China fell to very low levels, before strengthening
significantly in the following months of February, March and April.

While exports to China typically taper off over the    March and April, and in July and August, reflecting
summer and the winter months, in 2021, export          the re-opening of the hospitality sector in Spain
volumes and values rose strongly from October,         over the Easter and summer holiday period. The
signalling a rebound in Chinese domestic demand        monthly value of exports surpassed 2019 levels
for seafood.                                           for each month but one in the second half of the
                                                       year.
Exports to our most important market, France,
recovered strongly throughout the year. Monthly        Export volumes and value to the UK increased in
export value surpassed 2019 levels from June and       January and February of 2021 before falling off
reached €15m in value for each month up until the      into the summer months. Volumes stabilised over
end of the year.                                       the latter half of the year.

Exports to Italy recovered completely in 2021, with    Overall, strong growth was evident to France,
the Easter period of March to May seeing volumes       Spain, Italy and China in 2021, which is unsurprising
and values returning to pre-Covid levels. For the      after the performance in 2020. However, the level
rest of the year, exports matched the previous         of growth led to export values surpassing 2019
year with strong value growth leading up to            levels for France, Italy and Spain. Value to China is
Christmas. Exports to Italy were significantly above   still lower than 2019 although strong potential for
2019 levels in 2021.                                   future growth remains. The decline in trade with
                                                       the UK is almost certainly reflective of the new
In 2020, Spain was the main market for Irish           trading situation post-Brexit rather than from any
exports that was least affected by the Covid-19        Covid-related effect.
pandemic. In 2021, volumes exported increased in

                                   EXPORTS TO FRANCE, OUR MOST
                                   IMPORTANT MARKET, RECOVERED
                                   STRONGLY THROUGHOUT THE YEAR

                                                                             The Business of Seafood 2021 // 41
Trade Partner                           Export Value by Country (€M)          2019 2020 2021                                                                        Total Value (€M)               2019 2020 2021

      UNITED KINGDOM        20

                            16
                                                                                                                                                     200

                                                                                                                                                     150
                            12

                             8
                                                                                                                                                     100
                             4

                             0                                                                                         Trade Partner

                                                                                                                       TOTAL
                                 Jan   Feb   Mar    Apr   May   Jun    Jul   Aug   Sep    Oct    Nov    Dec                                           50

                                                                                                                                                       0

              FRANCE        20

                            16
                                                                                                                                                            UK            France      Spain           Italy          China

                            12

                             8                                                                                                                                            Total Volume (Tonnes ‘000)

                             4                                                                                                                       100

                             0
                                                                                                                                                      80
                                 Jan   Feb   Mar    Apr   May   Jun    Jul   Aug   Sep    Oct    Nov    Dec

                                                                                                                                                      60

                ITALY       20

                            16
                                                                                                                                                      40

                            12                                                                                                                        20

                             8
                                                                                                                                                       0
                             4                                                                                                                              UK            France      Spain           Italy          China

                             0
                                 Jan   Feb   Mar    Apr   May   Jun   Jul    Aug   Sep   Oct    Nov    Dec
                                                                                                              2019-2021 Change € Million                          2021 Change € Million

               SPAIN        20

                            16
                                                                                                              FRANCE                                              FRANCE

                            12
                                                                                                              -130%                           +11%         130%   -130%                                       +34%           130%
                             8
                                                                                                              UNITED KINGDOM                                      UNITED KINGDOM
                             4
                                                                                                              -130%                   -7%                  130%   -130%                 -13%                                 130%
                             0
                                 Jan   Feb   Mar    Apr   May   Jun   Jul    Aug   Sep   Oct    Nov    Dec
                                                                                                              SPAIN                                               SPAIN
                                                                                                              -130%                         +2%            130%   -130%                                  +20%                130%
               CHINA        20

                            16
                                                                                                              ITALY                                               ITALY
                            12

                             8                                                                                -130%                         +1%            130%   -130%                                       +32%           130%
                             4
                                                                                                              CHINA                                               CHINA
                             0
                                 Jan   Feb   Mar   Apr    May   Jun   Jul    Aug   Sep   Oct    Nov    Dec    -130%            -34%                        130%   -130%                                                  +126%

42 // Bord Iascaigh Mhara                                                                                                                                                                      The Business of Seafood 2021 // 43
Irish Fleet Performance
Economic Performance of Ireland’s offshore fishing fleet

The capacity of the Irish offshore fleet has remained relatively
stable over recent years, with around 200 vessels above 18m.
However, economic performance has shifted over time. The period
of the 2008 financial crisis was a time of economic strain to the
fleet, with fuel costs increasing and low profitability exacerbated
by overcapacity in the fleet.

A decommissioning programme initiated in 2008          remained at that level since then, with fluctuations
improved the economic performance from 2011            occurring over time. In early 2022, rising fuel costs
onwards, with relatively consistent levels of gross    due to the Russian invasion of Ukraine has made
profit generated by the fleet since then. Over time,   this a major issue again for the Irish fleet, with fuel
the significance of crew costs has increased from      prices rising to unprecedented levels. Compared to
16% of turnover in 2008, to 38% in later years         March 2021, data supplied from industry sources
Sourcing crew remains a significant challenge          showed that by March 2022, fuel has increased by
for the sector, which has exacerbated during the       150% from €0.44/ litre to €1.10/litre, threatening
Covid pandemic, with this problem now being            the viability of the Irish and wider European fishing
shared with many other sectors of the economy.         fleet. Given the lack of alternatives available to
                                                       food production machinery in the agriculture
Fuel costs were a major issue to the fleet during      and fishing sectors, extended periods with these
the 2008 financial crisis, with these rising to        elevated fuel costs will have detrimental effects
around 20% of turnover. These costs have               on the industry.

                             FUEL INCREASED BY
                             150%                                               1,301     FTEs
                                                                                EMPLOYED ON
                             FROM MARCH 2021
                             TO MARCH 2022                                      214 VESSELS

                                                                              The Business of Seafood 2021 // 45
Economic Performance of the Offshore Fleet

                    Fleet                                Length              National                  Number of               Days at                         FTE     Landings Live   Revenue   Fuel oil used   Gross Profit Net Profit       Profitability
                                                         (overall)           Segment                   Active Vessels          Sea                                     Weight Tonnes   €’000     per tonne       Margin %     Margin

                    Mid-water Trawlers                   ≥ 40 metres         Pelagic                   20                      1,324                           225     107,952         84,817    158             28%          20%              High

                                                         24 - 40 metres      Pelagic & Polyvalent      12                      1,184                           83      29,890          22,093    93              27%          7%               Weak

                    Demersal Trawlers & Seiners          24 - 40 metres      Polyvalent                48                      10,846                          361     20,184          67,781    1,499           42%          35%              High

                                                         18 - 24 metres      Polyvalent                65                      14,825                          394     17,080          71,391    1,354           21%          17%              Reasonable

                                                         12 - 18 metres      Polyvalent                34                      4,429                           101     3,748           9,542     1,080           7%           1%               Weak

                    Drift & Fixed Nets                   18 - 24 metres      Polyvalent                14                      2,181                           49      1,825           5,303     1,390           17%          11%              Reasonable

                    Beam Trawlers                        24 - 40 metres      Beam Trawl                14                      3,419                           51      2,654           9,783     2,661           10%          6%               Weak

                    Dredgers                             24 - 40 metres      Specific                  7                       1,625                           38      2,245           5,532     783             7%           -1%              Weak

                                                                                                       214                     39,833                          1,301   185,577         276,241   478             28%          23%              High

               Economic Performance of the Irish Fishing Fleet 2008 - 2019

                    300                                                                                                                100

                                                                                                                                       90
                    250
                                                                                                                                       80

                                                                                                                                       70
                    200
Cost Structure €M

                                                                                                                                             Gross Profit €M

                                                                                                                                       60

                    150                                                                                                                50

                                                                                                                                       40
                    100
                                                                                                                                       30

                                                                                                                                       20
                     50
                                                                                                                                       10

                      0                                                                                                                0
                            2008    2009     2010    2011       2012      2013   2014     2015      2016     2017       2018   2019

                                           Fixed costs      Variable costs    Repairs & maintenance        Fuel costs

                                                 Family & volunteer labour       Crew wage       Gross profit

               46 // Bord Iascaigh Mhara                                                                                                                                                                                      The Business of Seafood 2021 // 47
Quotas
In 2022, Ireland’s quota of the Total Allowable Catch (TAC)
amounts to 158,000 tonnes, worth an estimated €214m. This
represents a 7% decrease on the volume and value of quota
in 2021. In Area VI (west of Donegal), total quota for demersal
stocks falls marginally by 2%.

                                                      THE VALUE OF IRELAND’S
In the Celtic Sea, demersal stock quotas have
increased by 2%, while demersal stocks that span
both the Celtic Sea and West of Scotland (mainly
hake) have fallen by 14%. Pelagic quotas are down
by 9% for 2022, with the main reductions for          QUOTA FOR 2022 IS
                                                      €214M
mackerel and blue whiting. In the case of mackerel,
this is due largely to reductions under the Trade &
Co-Operation Agreement (TCA) the EU agreed with
the UK as part of the Brexit process.

                                                                The Business of Seafood 2021 // 49
TOTAL QUOTA - IRELAND                                                                                   Area VI & VII Demersal Stocks

                                                                                                                                                                                                         2021
                                                                                                        Stock               Area                                           Year   Irish Quota
           YEAR                     TOTAL QUOTA                    VALUE - €M                           Hake                VI, VII                                        2021     2,989
                                                                                                                                                                           2022     2,383       -20%

           2021                        170,935                          230
                                                                                                                                                                                                         6,176
                                                                                                        Skates & Rays        VI, VIIa-c, & e-k                             2021     1,210
                                                                                                                                                                           2022     1,177       -3%

           2022                        158,372                           214                            Small-eyed ray       VIIf                                          2021       12
                                                                                                                                                                           2022       12        0%
This is a provisional figure as the final 2022 quotas had not been published in the OJEU
at the time of this report.
                                                                                                        Undulate ray

                                                                                                        Tusk
                                                                                                                             VIIe

                                                                                                                             V, VI, VII
                                                                                                                                                                           2021
                                                                                                                                                                           2022
                                                                                                                                                                           2021
                                                                                                                                                                                      25
                                                                                                                                                                                      24
                                                                                                                                                                                     238
                                                                                                                                                                                                -4%       TONNES
                                                                                                                                                                                                         2022
                                                                                                                                                                           2022      238        0%
                                                                                                        Blue Ling            II,IV international waters                    2021       2
Area VI Demersal Stocks                                                                                                                                                    2022       2         0%
                                                                                                        Blue Ling            Vb,VI,VII                                     2021       32

                                                                                           2021                                                                                                          5,292
Stock                 Area              Year        Irish Quota       Change 19-20
                                                                                                                                                                           2022       30        -6%
Cod                   VIa               2021            243
                                                                                                        Ling                 VI, VII, VIII, IX, X, XII, XIV                2021     1,301
                                        2022            220                  -9%
                                                                                                                                                                           2022     1,059       -19%
Cod                   VIb               2021             16

                                                                                           3,829                                                                                                          TONNES
                                                                                                        Greenland Halibut IIa, IV, VI                                      2021       29
                                        2022             14                 -13%
                                                                                                                                                                           2022       29        0%
Common sole           VI                2021             46
                                                                                                        Spurdog/dogfish      I, II, IIII, IV, V, IV, IVV, VIII, XII, XIV   2021       48
                                        2022             46                  0%
                                                                                                                                                                           2022       48        0%

                                                                                           TONNES
Haddock               Vb VIa            2021            648

                                                                                                                                                                                                          DIFFERENCE
                                                                                                        Cod                  I,II                                          2021      290
                                        2022            684                 +6%
                                                                                                                                                                           2022      290        0%

                                                                                                                                                                                                          -14%
Haddock               VIb XII XIV       2021            570
                                        2022            386                 -32%

                                                                                           2022
Megrims               VI                2021            600
                                        2022            627                 +4%
Monkfish              VI                2021            562

                                                                                           3,759
                                        2022            439                 -22%
Norway lobster        VI                2021            202
                                        2022            160                 -21%
Plaice                VI                2021            248

Pollack               VI
                                        2022
                                        2021
                                        2022
                                                        248
                                                         26
                                                         22
                                                                             0%

                                                                            -15%
                                                                                           TONNES
Saithe                VI                2021            369
                                        2022            352                  -5%
                                                                                           DIFFERENCE

                                                                                           -2%
Whiting               VI                2021            299
                                        2022            561                +88%

50 // Bord Iascaigh Mhara                                                                                                                                                                              The Business of Seafood 2021 // 51
Area VII Demersal Stocks                                                Deepwater Stocks

                                                           2021                                                                                                  2021             220
Stock                Area      Year   Irish Quota                       Stock                  Area                                Year    Irish Quota
Cod                  VII b-k   2021      422                            Black Scabbardfish     V, VI, VII, XII                     2021        55
                               2022      338        -20%                                                                           2022        55          0%
                                                                                                                                                                                   TONNES

                                                           23,340
Cod                  VIIa      2021      104                            Alfonsinos             I, II, III, IV, V, VI, VII, VIII,   2021           7

                                                                                                                                                                 2022
                                                                                               IX, X, XII, XIV
                                                                                                                                                                      220
                               2022      104        0%                                                                             2022           7        0%
Megrims              VII       2021     2,844                           Roundnose Grenadier    Vb, VI, VII                         2021       153

                                                                                                                                                                                   TONNES
                                                           TONNES
                               2022     2,827       -1%                                                                            2022       153          0%
Monkfish             VII       2021     2,775                           Roundnose Grenadier    VIII, IX, X, XII, XIV               2021           2
                               2022     2,977       +7%                                                                            2022           2        0%
Haddock              VII b-k   2021     2,959                           Red Seabream           VI, VII, VIII                       2021           3              DIFFERENCE 0%

                                                           2022
                               2022     2,920       -1%                                                                            2022           3        0%
Haddock              VIIa      2021     1,322
                               2022     1,171       -11%
                                                                        Deepwater Stocks

                                                                                                                                                                    2021
Whiting              VIIa      2021      280

                                                           23,838
                               2022      274        -2%                 Stock                  Area                                Year   Irish Quota

Whiting              VIIb-k    2021     2,707                           Greater silver smelt   III, IV                             2021       5
                                                                                                                                   2022       5           0%

                                                           TONNES
                               2022     3,972       +47%
                                                                        Greater silver smelt                                       2021      262

                                                                                                                                                                    137,370
Norway lobster       VII       2021     6,102                                                  V, VI, VII
                               2022     5,682       -7%                                                                            2022      821         +213%

Plaice               VII bc    2021       15                            Boarfish               VI, VII,VIII                        2021     13,234

                                                                                                                                                                    TONNES
                               2022       15        0%                                                                             2022     15,749       +19%

Plaice               VII fg    2021      240               DIFFERENCE   Herring                I, II                               2021     3,370

                                                           +2%
                               2022      237        -1%                                                                            2022     3,101        -8%

Plaice               VII hjk   2021       28                            Herring                VIaN                                2021      478

                                                                                                                                                                    2022
                               2022       47        +68%                                                                           2022      470         -2%

Plaice               VIIa      2021     1,069                           Herring                VIaS, VIIbc                         2021     1,236

                               2022     1,031       -4%                                                                            2022     1,236         0%

Pollack              VII       2021      680                            Herring                VII ghjk                            2021      750

Saithe               VII
                               2022
                               2021
                                         572
                                        1,493
                                                    -16%
                                                                        Herring                VIIa
                                                                                                                                   2022
                                                                                                                                   2021
                                                                                                                                             750
                                                                                                                                             808
                                                                                                                                                          0%

                                                                                                                                                                    125,263
                                                                                                                                                                    TONNES
                               2022     1,404       -6%                                                                            2022      719         -11%

Common sole          VII bc    2021       28                            Blue whiting           I, II,III, IV,V, VI, VII, VIII      2021     35,373
                                                                                               a,b,d,e XII,XIV                     2022     28,435       -20%
                               2022       28        0%
Common sole          VII fg    2021       42                            Mackerel               VI, VII                             2021     60,847
                                                                                                                                   2022     54,922       -10%

Common sole          VII hjk
                               2022
                               2021
                                          39
                                         126
                                                    -7%
                                                                        Horse mackerel         IIa, IVa, VI, VIIa-c, VIIe-k,       2021     17,561                  DIFFERENCE

                                                                                                                                                                     -9%
                                                                                               VIIIa,b,e                           2022     15,737       -10%
                               2022       95        -25%
Common sole          VIIa      2021      104                            Horse mackerel         IVb, IVc, and VIId                  2021      330

                               2022      105        +1%                                                                            2022      202         -39%
                                                                        Albacore               north.atl                           2021     3,115
                                                                                                                                   2022     3,115         0%
                                                                        Blue Shark             Atlantic Ocean,                     2021       1
                                                                                               North of 5 degrees                  2022       1           0%

52 // Bord Iascaigh Mhara                                                                                                                                        The Business of Seafood 2021 // 53
EVOLUTION OF IRISH QUOTA 1982 - 2022
Fishing Opportunities for all stocks by regional sea 1982 - 2022

Quotas were first introduced into European fisheries      Quotas for demersal stocks across the sea areas
in 1982. Since their introduction, Ireland’s quota has    have been remarkably stable since 2000, averaging
fluctuated quite significantly from lows of 162,000       around 35,000 tonnes. Ireland’s 2022 total quota
tonnes in 1996 and 142,000 tonnes in 2010, to             for all stocks represents a decrease on 2021, with
highs of 262,000 tonnes in 1997 and 314,000               the decrease driven mainly by reductions in the
tonnes in 2014. These peaks and troughs have              quotas for pelagic stocks, as well as whitefish
mainly been driven by variability in pelagic quotas,      species such as hake, monkfish and Dublin Bay
such as blue whiting, horse mackerel and boarfish.        prawns.

 Tonnes
350,000

300,000

250,000

200,000

150,000

100,000

  50,000

        0
            1982
            1983
            1984
            1985
            1986
            1987
            1988
            1989
            1990
            1991
            1992
            1993
            1994
            1995
            1996
            1997
            1998
            1999
            2000
            2001
            2002
            2003
            2004
            2005
            2006
            2007
            2008
            2009
            2010
            2011
            2012
            2013
            2014
            2015
            2016
            2017
            2018
            2019
            2020
            2021
            2022

                   Arctic Waters   Celtic Sea     Deepwater    Irish Sea   Pelagic    West of Scotland

54 // Bord Iascaigh Mhara
BREXIT
The end of the Brexit withdrawal period brought about the biggest
change and disruption in EU-UK relations in 50 years, across all
aspects of trade and society. The EU/UK Trade & Cooperation
Agreement (TCA) deal agreed at the end of 2020 has brought a
sudden and dramatic shift in the landscape for the entire Irish
seafood sector, in a number of respects.

In 2021, the real impacts of Brexit hit the             published by the European Commission to ‘mitigate
Irish seafood sector. As part of the Trade and          the economic impacts of the withdrawal of the
Cooperation Agreement (TCA) between the EU              UK and to show solidarity with member states,
and UK, quota transfers across EU Member States         especially those most affected’.
to the UK, valued at €199m based on 2020 quota
shares and prices were agreed. These quota              Recognising the impacts of the TCA on the Irish
transfers were front loaded, with 60% of the total      seafood industry, the Minister for Agriculture,
transfers applied in 2021. The main impact on the       Food & the Marine, Charlie McConalogue TD,
Irish fleet is for Ireland’s two biggest fisheries -    established a Seafood Task Force to consider
mackerel and Dublin Bay prawns - which see quota        measures to mitigate the impacts of the fish quota
losses of 26% and 14% respectively. The impact          share reductions. The Task Force made sixteen
on the fishing fleet of reduced quotas is evident       recommendations, with a proposed overall funding
from the previous chapters, where the landings of       requirement of €423m recognising the ambition
mackerel fell by 18% in volume and 23% in value.        of the seafood sector and the local communities
                                                        where activity is centred. In addressing the Terms
The TCA will continue to affect Ireland’s fishing       of Reference set, the Task Force focused on the
industry up until the end of 2026, when the             burden imposed by the TCA and how to address
Agreement is up for re-negotiation. Vital seafood       losses, necessary funding arrangements, and
export routes, primarily the land-bridge via the UK,    the role of the Common Fisheries Policy Review.
have been curtailed and trade to and from the UK        The Task Force also recommended longer-term
disrupted. Traditionally, Ireland has imported around   fleet restructuring measures through voluntary
two-thirds of all its seafood from the UK. In 2021,     decommissioning schemes for the whitefish and
imports from the UK fell by 57% in value terms,         inshore sectors that will restore balance between
reducing the import share to 30%, which is the          fishing capacity and available fishing opportunities.
lowest level ever recorded. Imports of salmon, cod,     Short-term supports, including a possible Voluntary
tuna and fish meal from the UK all saw significant      Temporary Cessation Scheme, and support
reductions. An extraordinary level of substitution      schemes for the catching sectors, processors
occurred, with imports of seafood doubling from         and Fishermen’s Co-operatives to mitigate the
Asia and Africa, increasing by nearly 90% from          immediate impacts of the TCA were proposed. While
Nordic countries, while increasing by 17% in value      longer-term initiatives in the areas of processing,
terms from the EU.                                      aquaculture, public marine infrastructure and
                                                        Community Led Local Development (CLLD) that
Given that Ireland has been disproportionately          will help to strengthen and enhance coastal
impacted by the quota transfers under the TCA           communities particularly dependent on the seafood
compared to other Member States, plans for              industry were also recommended.
a Brexit Adjustment Reserve (BAR) have been

                                                                              The Business of Seafood 2021 // 57
Irish Imports of All Seafood Products 1997-2021                                            Total Value of All Seafood Imports by Region 2019-2021

               Total Imports - Value (€M)          Total Imports - Volume (Tonnes ‘000)     € Million
350                                         200                                             400

                                                                                            360
300
                                                                                            320
                                            150

250                                                                                         280

                                                                                            240
200                                         100
                                                                                            200

150                                                                                         160
                                             50                                             120
100
                                                                                             80

 50                                           0                                              40

                                                  1997
                                                  1998
                                                  1999
                                                  2000
                                                  2001
                                                  2002
                                                  2003
                                                  2004
                                                  2005
                                                  2006
                                                  2007
                                                  2008
                                                  2009
                                                  2010
                                                  2011
                                                  2012
                                                  2013
                                                  2014
                                                  2015
                                                  2016
                                                  2017
                                                  2018
                                                  2019
                                                  2020
                                                  2021
      1997
      1998
      1999
      2000
      2001
      2002
      2003
      2004
      2005
      2006
      2007
      2008
      2009
      2010
      2011
      2012
      2013
      2014
      2015
      2016
      2017
      2018
      2019
      2020
      2021

                                                                                              0
                                                                                                         United   European     Asia       Nordics    Rest of the      Africa       Grand Total
             Imports from UK - Value (€M)         Imports from UK - Volume (Tonnes ‘000)                Kingdom     Union                 (non EU)     World
250                                         80
                                                                                                                                 2019        2020      2021

                                            70

200
                                                                                           Total Volume of All Seafood Imports by Region 2019-2021
                                            60
                                                                                            ‘000 Tonnes
150                                         50                                              200

                                                                                            180
                                            40
                                                                                            160
100

                                            30                                              140

                                                                                            120
 50                                         20
                                                                                            100
      1997
      1998
      1999
      2000
      2001
      2002
      2003
      2004
      2005
      2006
      2007
      2008
      2009
      2010
      2011
      2012
      2013
      2014
      2015
      2016
      2017
      2018
      2019
      2020
      2021

                                                  1997
                                                  1998
                                                  1999
                                                  2000
                                                  2001
                                                  2002
                                                  2003
                                                  2004
                                                  2005
                                                  2006
                                                  2007
                                                  2008
                                                  2009
                                                  2010
                                                  2011
                                                  2012
                                                  2013
                                                  2014
                                                  2015
                                                  2016
                                                  2017
                                                  2018
                                                  2019
                                                  2020
                                                  2021

                                                                                             80
                  UK Value Share (%)                      UK Volume Share (%)
                                                                                             60
100                                         100

 90                                          90                                              40

 80                                          80                                              20

 70                                          70                                               0
                                                                                                         United   European     Asia       Nordics    Rest of the      Africa       Grand Total
 60                                          60                                                         Kingdom     Union                 (non EU)     World
 50                                          50
                                                                                                                                 2019        2020      2021
 40                                          40

 30                                          30

 20                                          20

 10                                          10

  0                                           0
      1997
      1998
      1999
      2000
      2001
      2002
      2003
      2004
      2005
      2006
      2007
      2008
      2009
      2010
      2011
      2012
      2013
      2014
      2015
      2016
      2017
      2018
      2019
      2020
      2021

                                                  1997
                                                  1998
                                                  1999
                                                  2000
                                                  2001
                                                  2002
                                                  2003
                                                  2004
                                                  2005
                                                  2006
                                                  2007
                                                  2008
                                                  2009
                                                  2010
                                                  2011
                                                  2012
                                                  2013
                                                  2014
                                                  2015
                                                  2016
                                                  2017
                                                  2018
                                                  2019
                                                  2020
                                                  2021

58 // Bord Iascaigh Mhara                                                                                                                                          The Business of Seafood 2021 // 59
Total Value and Volume Change of All Seafood Imports by Region 2021
                                                                                                                                         BREXIT ADJUSTMENT RESERVE (BAR)
                  Value Change 2021 (%)                                                      Volume Change 2021 (%)
                                                                                                                                         Decommissioning                                                   € Million
                                                                                                                                         Whitefish                                                           €66.00
        -57                                                                       -11
                                                                                                                                         Inshore                                                               €6.00
                          +17                                                     -11                                                    Off Register/Inshore Inactive                                         €3.70

                                                +110                                                                +80                  Total                                                               €75.70

                                          +89                                                +24
                                                                                                                                         Short-term Measures                                               € Million
                                     +77                                                                            +81
                                                                                                                                         Co-ops                                                                €1.00

                                                 +116                                                                       +107
                                                                                                                                         Polyvalent tie-up (1 year)                                          €12.00
                                                                                                                                         Polyvalent tie-up (2022)                                            €12.00
                    -16                                                                 +7
                                                                                                                                         Inshore Short-term Support                                            €3.50
      -60 -40 -20     0     +20 +40 +60 +80 +100+120                       -20       0        +20     +40    +60      +80   +100 +120    Pelagic Liquidity                                                     €8.00
                                                                                                                                         Processing Liquidity                                                €12.00
               United Kingdom       EU       Asia       Nordics (non EU)       Rest of World            Africa       Grand Total
                                                                                                                                         Scallop Liquidity                                                     €0.60
                                                                                                                                         Pelagic Tie-up                                                      €21.00
 Substitution for Main Imports of Processed Seafood Goods
                                                                                                                                         Total                                                               €70.10
Substitution Effects of Processed Seafood Imports
                                                                                                                                         Onshore/Offshore Initiatives                                      € Million
      +20
                                                        Increased Imports                                                                Aquaculture                                                         €60.00
      +10
                                                                                                                                         Small Scale Public Marine Infrastructure                            €80.00
        0                                                                                                                                Community Led Local Development                                     €35.00
                                                                                                                                         Inshore Longer-term Supports                                        €10.00
      -10
 €M

                                                                                                                                         Inshore Marketing                                                     €2.50
      -20
                                                                                                                                         Processing Capital (Including Inshore)                              €90.00
                                                        Decreased Imports
      -30
                                                                                                                                         Total                                                             €277.50
      -40

      -50                                                                                                                                Overall Total                                                     €423.30

                 Agri-Feeding            Fresh or Chilled             Frozen                       Frozen Fillets             Prepared
                    Stuffs                   Fillets

                United Kingdom       EU         Asia    Nordics (non EU)         Rest of World           Africa      Net Change

60 // Bord Iascaigh Mhara                                                                                                                                                           The Business of Seafood 2021 // 61
Seafood-Tech Sector
The seafood-tech sector refers to companies that are involved in high
value-adding techniques and processes utilising seafood. It is distinct
from the direct primary producing sectors of fishing and aquaculture
due to its value-adding characteristics. It is also distinct from the
processing sector, as it is not providing direct output to the food
sector.

In the Business of Seafood, estimates of activity    has for the last four years been developing start-
in the downstream economy are provided whereby       up companies in this area through its Aquaculture
the indirect seafood sector that supports the        Accelerator Programme.
direct seafood sectors of fishing, aquaculture and
seafood processing are accounted. The seafood-       As can be seen in the figures below the sector
tech sector as set out here is separate to these     is dominated by bioscience companies which
ancillary and auxiliary service providers but does   account for the majority of the number of
share commonalities with the processing and          companies, in terms of employment and revenue
indirect support sectors.                            generated. BIM estimates that significant growth
                                                     has occurred in the seafood-tech sector over
The sector is composed of high technology            the last five years with the number of active
companies that provide business support,             companies growing from 34 in 2015 to 52 in 2020
professional and port services and carry out         (+53%). Over this period employment in these
significant research and development into the        companies increased from 434 in 2015 to 741 in
nutritional and health benefits of seafood.          2020 (+71%) while turnover has increased from
The range of activities include genetics,            €80m in 2015 to €180m in 2020 (+126%). The
pharmaceutical industries, aquaculture               growth in Bioscience companies has driven growth
infrastructure, information technology, financial    in the overall sector with significant growth also
services and many other associated activities. BIM   occurring in the Professional Services sector.

Number of active companies               Employment increased             Turnover increased from
growing from 34 in 2015                  from 434 in 2015 to              €80m in 2015 to €180m
to 52 in 2020 (+53%).                    741 in 2020 (+71%).              in 2020 (+126%).

34 52
 in 2015                in 2020
                                         434 in 2015 €80m - 2015
                                         741 in 2020 €180m - 2020
                                                                          The Business of Seafood 2021 // 63
SEAFOOD TECH SECTOR
                                                                                                                            No. of Active Seafood-Tech Companies by Seafood Subsector - 2020

                        60
                                                                                                                                                                     Seaweed 46%
                        50
Number of Companies

                        40                                                                                                                                           Fisheries 2%

                        30
                                                                                                                                                                     Coral 2%
                        20
                                                                                                                                                                     Aquaculture 44%
                        10
                                                                                                                                                                     All Seafood 6%
                         0
                                 Bioscience      Business Support     Port Services Professional Services     Technology

                                                                                        2016 2017 2018 2019 2020

                                                                                                                                 Seafood-Tech Employment by Seafood Subsector - 2020
                         800
                         700
                                                                                                                                                                     Seaweed 67%
Full Time Employment

                         600
                         500
                                                                                                                                                                     Fisheries 3%
                         400
                         300                                                                                                                                         Coral 0%

                         200
                                                                                                                                                                     Aquaculture 19%
                         100
                             0                                                                                                                                       All Seafood 11%
                                    Bioscience     Business Support     Port Services Professional Services    Technology

                                                                                         2016 2017 2018 2019 2020

                                                                                                                                   Seafood-Tech Turnover by Seafood Subsector - 2020
                       200

                       150                                                                                                                                           Seaweed 63%
Euro Millions

                                                                                                                                                                     Fisheries 8%
                       100
                                                                                                                                                                     Coral 1%

                       50
                                                                                                                                                                     Aquaculture 17%

                        0                                                                                                                                            All Seafood 11%
                                 Bioscience      Business Support     Port Services Professional Services     Technology

                                                                                        2016 2017 2018 2019 2020

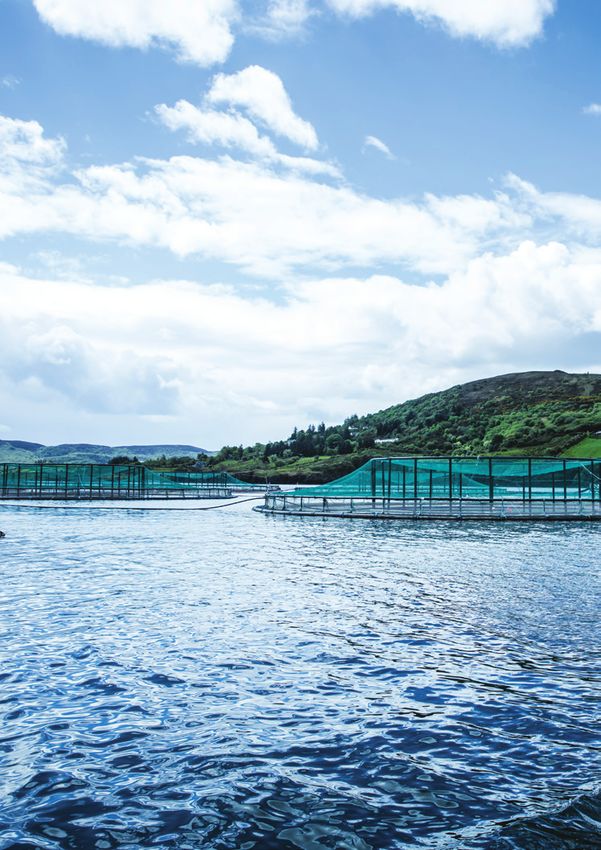
 64 // Bord Iascaigh Mhara                                                                                                                                                            The Business of Seafood 2021 // 65
Aquaculture Bay Study
Summary

The Irish aquaculture sector is an important component of the
Irish seafood economy. This is particularly the case in some of the
country’s more peripheral coastal economies (e.g., rural Donegal).

                                                      COUNTY DONEGAL IS AN
To shed new light on the economic contribution
of Irish aquaculture at both the local and national
level, Bord Iascaigh Mhara (BIM) commissioned
Oxford Economics and Perceptive Insight to assess
the economic impact of the aquaculture sector         IMPORTANT AREA FOR
at 11 of Ireland’s most representative bay areas.
These ranged from Dingle in Co. Kerry - the largest   IRELAND’S AQUACULTURE
                                                      SECTOR
of these bay economies - to Mulroy Bay in Co.
Donegal, the smallest and most northerly of the
bays assessed.

This report highlights the economic impact
associated with a subset of Ireland’s overall
aquaculture industry. BIM’s national seafood
survey data shows that the 11 bay areas (which
form the focus of this report) represent close to
half of Ireland’s total aquaculture production by
value.
You can also read