FY21 RESULTS - National Storage REIT
←
→
Page content transcription
If your browser does not render page correctly, please read the page content below
FY21 RESULTS
DISCLAIMER

This presentation has been prepared by National          direct or indirect loss or damage which may be           These forward-looking statements are not                 or any change in the events, conditions or
Storage REIT (“NSR”) comprising National Storage         suffered through the use, or reliance on, anything       guarantees or predictions of future performance          circumstances on which a statement is based. To
Holdings Limited (ACN 166 572 845) and National          contained in, or omitted from, this presentation.        and involve known and unknown risks and                  the maximum extent permitted by law,
Storage Financial Services Limited (ACN 600 787 246                                                               uncertainties and other factors, many of which are       responsibility for the accuracy or completeness of
and AFSL 475 228) as responsible entity for the          Not an offer of securities                               beyond the control of NSR, and may involve               any forward looking statements whether as a result
National Storage Property Trust (ARSN 101 227 712).      This presentation is for information purposes only       significant elements of subjective judgement and         of new information, future events or results or
You acknowledge and agree that you will rely on          and should not be considered as a solicitation,          assumptions as to future events which may or may         otherwise is disclaimed.
your own independent assessment of any                   offer or invitation for subscription, purchase or sale   not be correct. You are cautioned not to place
information, statements or representations               of NSR securities in any jurisdiction.                   undue reliance on forward-looking statements,            This presentation should not be relied upon as a
contained in this presentation and such reliance will                                                             opinions and estimates provided in this presentation     recommendation or forecast by NSR.
be entirely at your own risk.                            Not financial or other advice                            as there can be no assurance, and no
                                                         Nothing in this presentation constitutes financial,      representation is made, that actual outcomes will        Accounting standards
Summary information                                      investment, legal, tax or other advice. This             not differ materially from these forward-looking         NSR’s statutory results are prepared in accordance
This presentation contains summary information           presentation has been prepared without taking            statements. Further, no representation is given that     with International Financial Reporting Standards
about the current activities of NSR and the entities     account of any person's individual investment            the assumptions upon which a forward-looking             (“IFRS”). This presentation also includes certain
within the NSR stapled group as at the date of this      objectives, financial situation or particular needs.     statement or other forecast may be based is              non-IFRS measures in presenting NSR’s results. Any
presentation. The information in this presentation is    Each recipient of this presentation should consult       reasonable. Forward-looking statements, opinions         additional financial information in this presentation
of a general nature and does not purport to be           with, and rely solely upon, the advice of their own      and estimates provided in this presentation              which is not included in NSR’s 30 June 2021
complete. Statements made in this presentation           legal, tax, business and/or financial advisors in        necessarily involve uncertainties, assumptions,          Financial Statements was not subject to
are, unless otherwise stated, made only as of the        connection with any decision made in relation to         contingencies and other factors, and unknown risks       independent audit or review. Investors should be
date of this presentation and remain subject to          the information contained in this presentation.          may arise, many of which are outside the control of      aware that certain financial data included in this
change without notice. This presentation should be                                                                NSR. Similarly, statements about market and              Presentation is “non-IFRS financial information”
read in conjunction with NSR’s other periodic and        Financial data                                           industry trends, which are based on interpretations      under ASIC Regulatory Guide 230: “Disclosing
continuous disclosure announcements lodged with          All references to dollars and cents are in reference     of current market conditions, should be treated          non-IFRS financial information” published by ASIC
the ASX, which are available at www.asx.com.au.          to Australian dollars unless otherwise stated and all    with caution. Such statements may cause the              and may also be “non-GAAP financial information”
                                                         financial data is presented as at the date of this       actual results or performance of NSR to be               within the meaning given under Regulation G of
Disclaimer                                               presentation unless otherwise stated.                    materially different from any future results or          the U.S. Securities Exchange Act of 1934,
No member of NSR or any of its related bodies                                                                     performance expressed or implied by such forward-        as amended.
corporate and each of their respective directors,        Past performance                                         looking statements. Forward-looking statements
employees, officers, associates, agents, auditors        The past performance, including past security price      including projections, guidance on future earnings       Non-IFRS financial information does not have a
and advisers offer any representation, guarantee or      performance, of NSR cannot be relied upon as an          and estimates are provided as a general guide            standardised meaning prescribed by Australian
warranty, express or implied, as to the accuracy,        indicator of, and provides no guidance as to             only and should not be relied upon as an indication      Accounting Standards (“AAS”). Accordingly, the
completeness, currency or reliability (including as to   future NSR performance including future security         or guarantee of future performance. Such forward-        non-IFRS financial information in this Presentation:
auditing or independent verification) of any             price performance and is given for illustrative          looking statements are based on information              (i) may not be comparable to similarly titled
statement, estimate, opinion or other information        purposes only.                                           available to NSR as at the date of this presentation.    measures presented by other entities; (ii) should not
contained in this presentation. To the maximum                                                                    Except as required by law or regulation (including       be construed as an alternative to other financial
extent permitted by law, the members of NSR and          Forward-looking statements                               the ASX Listing Rules), NSR undertakes no obligation     measures determined in accordance with AAS;
each of their related and controlled entities and        This presentation may contain certain "forward-          to provide any additional, updated or                    and (iii) is not a measure of performance, liquidity
each of their respective directors, officers,            looking statements", including statements regarding      supplementary information whether as a result of         or value under the IFRS. Investors are cautioned,
employees and agents disclaim all liability and          future earnings and distributions. All statements        new information, future events or results, or            therefore, not to place undue reliance on any
responsibility (including without limitation any         other than statements of historical facts included in    otherwise including information that reflect any         non-IFRS financial information included in
liability arising from fault or negligence) for any      this presentation are forward-looking statements.        change in NSR’s financial condition, status or affairs   this Presentation.
                                                                                                                                                                                                                                   2
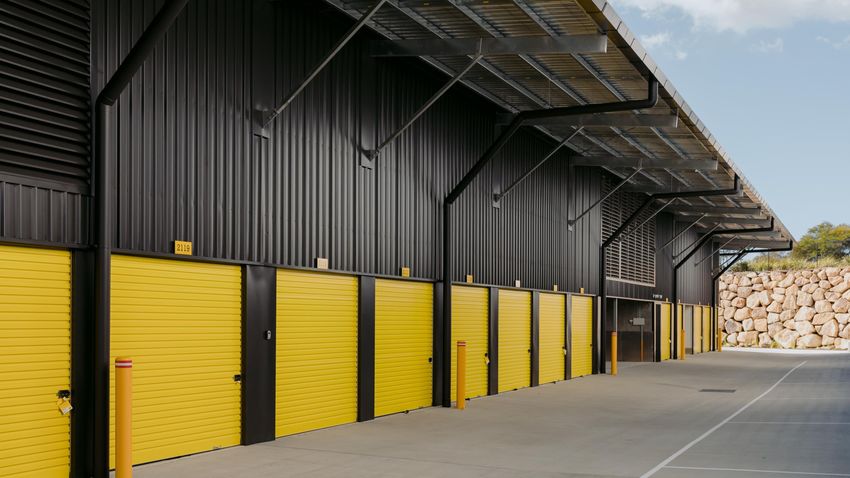
Ipswich, QLD        North Lakes, QLD   Biggera Waters, QLD

Montrose, TAS       Robina, QLD         Butler, WA

 Tullamarine, VIC   Brendale, QLD      Canterbury, VIC
AGENDA

▪   FY21 Results Summary

▪   Financial Results

▪   Operational Update and COVID-19

▪   Key Operating Metrics

▪   Strategy - Four Pillars of Growth

▪   Organic Growth

▪   Acquisitions

▪   Development and Expansion

▪   Technology and Innovation

▪   Guidance FY22
                                        4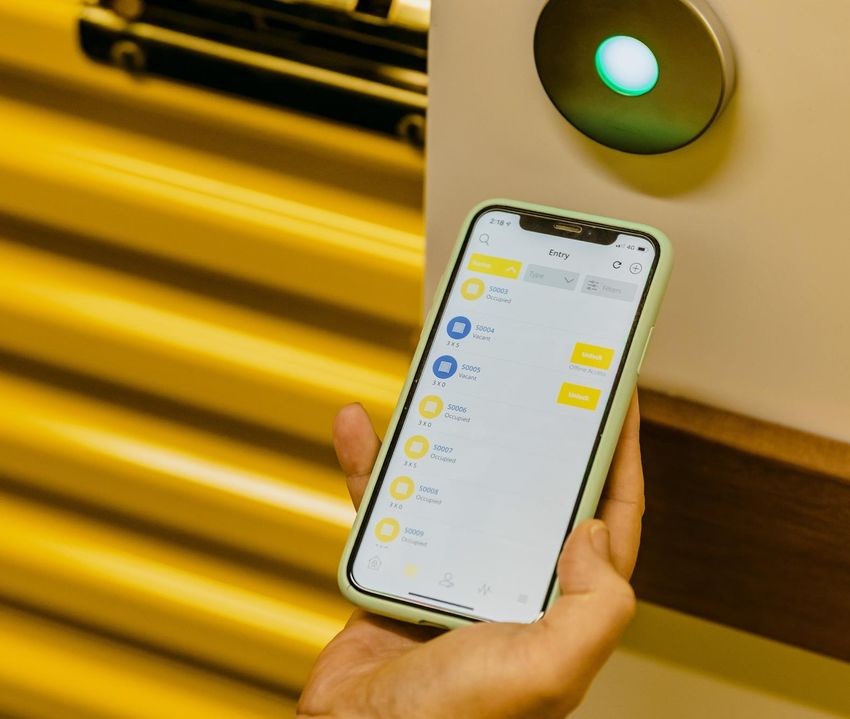
FY21 HIGHLIGHTS

A-IFRS PROFIT $309.7 MILLION (EPS 30.21 CENTS) | UNDERLYING EPS 8.5 CENTS

                                                                             GROUP                                 GROUP                      WEIGHTED
                                 UNDERLYING                                                                                                AVERAGE PRIMARY                      TOTAL
                                                                           OCCUPANCY2                             REVPAM2
                                  EARNINGS1                                                                                                    CAP RATE                         ASSETS5
                                                                                                                                                   AUS & NZ

                                 $86.5m                                      86.1%                                $227                           5.98%                         $3.25b
                                    (Up 28%)                                  (Up 8.5%)                           (Up 22.8%)
                                                                                                                                               (Firmed 51bps)                  (Up 32%)

                                                        AUSTRALIAN                                   AUSTRALIAN
              UNDERLYING                               OCCUPANCY3                                                               ACQUISITIONS                    NET TANGIBLE
                                                                                                      REVPAM3                    COMPLETED
                 EPS1                                                                                                                                              ASSETS

             8.5 cents                                   86.2%                                        $234                       $352m                           $1.89
                (Up 2.4%)                                 (Up 9.7%)                                  (Up 24.3%)                25 Acquisitions                    (Up 15%)

1 – Underlying earnings is a non-IFRS measure (unaudited), see table on slide 6 for reconciliation
2 – Group - Australia and New Zealand (142 centres), as per 3 & 4 below
3 – Australia - 121centres as at 30 June 2019 (excluding Wine Ark and let-up centres)
4 – New Zealand – 21 centres as at 30 June 2021 (excluding let-up centres)
5 - Total Assets – Net of lease liability
REVPAM – Revenue Per Available Square Metre
                                                                                                                                                                                          5
PROFIT AND LOSS                                                FOR THE YEAR   ENDED 30 JUNE 2021

    STRATEGY CONTINUES TO
                                                                                        $ Million                                                          FY21           FY20           % Change
    DELIVER SUPERIOR GROWTH
                                                                                          Storage revenue                                                     193.5          159.5         21%
                                                                                          Sales of goods and services                                             11.8            7.6      55%
                                                                                          Other revenue                                                            9.3            7.5      24%
                                                                                        Total Revenue                                                         214.6          174.6         23%
▪   FY21 performance                                                                      Cost of Goods Sold                                                       5.4            3.6      50%
                                                                                        Gross Profit                                                          209.2          171.0         22%
       ▪   Storage revenue up 21% - strong occupancy, rate and
                                                                                        Operating Centre Expenditure
           REVPAM growth
                                                                                          Salaries and employee benefits                                          24.7           19.8      25%
       ▪   Sales of goods and services and other revenue continue                         Lease expense                                                           13.1           12.2       7%
           to increase                                                                    Property rates and taxes                                                16.7           14.0      19%
                                                                                          Electricity and Insurance                                                4.7            4.6       2%
       ▪   Operating profit up 22%                                                        IT and telecommunications                                                4.4            3.6      22%
       ▪   Operating margin increase to 62%                                               Marketing                                                                6.5            4.2      55%
                                                                                          Repairs and maintenance                                                  5.3            4.3      23%
       ▪   Expenses impacted by deferred and one off costs                                Other operating expenses                                              5.0            4.3         16%
                                                                                        Total Operating Centre Expenditure                                     80.4           67.0         20%
       ▪   Other income lower as greater focus on organic
                                                                                        Operating Profit                                                      128.8          104.0         24%
           earnings                                                                     Operating Margin                                                       62%            61%           1%
                                                                                         Operational management                                                 7.7            6.3         22%
       ▪   Underlying earnings1 up 28%
                                                                                         General and administration                                               16.3           11.9      37%
▪   G&A – reflects higher insurance costs, expenditure on audit                          Finance costs                                                            20.3           23.8      -15%
    and valuations and remuneration cost increases                                       Depreciation, amortisation and FX                                         1.3            0.8      63%
                                                                                         Total expenses                                                       126.0          109.8         15%
▪   Lower finance cost reflects reduction in borrowings associated                       Other income (Inc share of profit from JV and contracted gains)       (3.3)          (6.5)        -49%
    with capital raises and lower borrowing costs                                       Underlying Earnings (1)                                                86.5              67.7      28%
                                                                                          Add / (less) fair value adjustments                                 231.7              59.8
                                                                                          Add / (less) diminution of lease asset                                   4.1            3.4
                                                                                          Add / (less) other non recuring and restructuring expenses              (0.9)          (3.7)
                                                                                          Add / (less) non cash interest rate swap amortisation               (10.8)             (7.7)
                                                                                        Profit / (loss) before income tax                                     310.6          119.5
                                                                                          Income tax (expense) benefit                                         (0.9)           2.3
       1 – Underlying earnings is a non-IFRS measure (unaudited)                        Profit / (loss) after income tax                                      309.7          121.8                  6
EXCEPTIONAL PROFILE OF GROWTH AND RETURNS
8 YEAR CAGR IN UNDERLYING EARNINGS OF c.26% UNDERPINNED BY FOUR PILLAR GROWTH STRATEGY

    ▪    Consistent revenue and earnings growth trajectory since IPO                                                           Total Revenue
                                                                                         $250.0
             ▪    Revenue growth of 306% and underlying earnings1 growth of 344%
                  since the December 2013 IPO                                                                                     CAGR: 24.1%
                                                                                         $200.0
    ▪    Revenue growth continues to be driven by:
                                                                                         $150.0
             ▪    Rising demand for self-storage underpinned by favourable

                                                                                   $'m
                  macroeconomic trends:                                                  $100.0
                      ▪    Increased awareness
                                                                                          $50.0
                      ▪    Smaller dwelling size
                                                                                           $0.0
                      ▪    Increasing transitory workforce                                        CY14     FY15     FY16       FY17     FY18     FY19     FY20     FY21
                      ▪    Downsizing
                      ▪    Strong housing market                                                                             Underlying Earnings 1
                                                                                         $100.0
                      ▪    E-business and online sales
                                                                                                                                CAGR: 25.8%
             ▪    Strong acquisition growth                                               $80.0

             ▪    Pipeline of development and expansion opportunities                     $60.0

                                                                                   $'m
    ▪    Underlying earnings have outpaced revenue growth as a result of:
                                                                                          $40.0
             ▪    Enhanced operational efficiencies
             ▪    Relatively fixed cost base                                              $20.0

                                                                                           $0.0
                                                                                                  Dec-14   Jun-15   Jun-16     Jun-17   Jun-18   Jun-19   Jun-20   Jun-21

 1 – Underlying earnings is a non-IFRS measure (unaudited)                                                                                                                  7
BUILT CAPACITY
OPPORTUNITY FOR CONTINUED OPERATIONAL IMPROVEMENT
                                                                                                                           Total NLA
                                                                                                            1,200,000
▪ Significant growth remains in existing built capacity (NLA) derived from
  historical acquisition and development activity

          ▪ Australian and NZ Portfolio1 total NLA – 1,100,000m2                                            1,000,000

▪ Target occupancy 87.5% - 90.0%
                                                                                                             800,000
▪ Opportunity “runway”                                   Additional revenue at $300/m2

          ▪ 87.5% – c. 60,000m2                          c. $18m

                                                                                                      SQM
                                                                                                             600,000
          ▪ 90.0% – c. 90,000m2                          c. $27m

▪ Relatively fixed cost-base means majority of additional revenue
  contributes directly to underlying earnings                                                                400,000

▪ The uplift from filling existing NLA has the potential to add in excess of
  2cps in additional underlying EPS2 at stabilised occupancy
                                                                                                             200,000

▪ 59,100m2 of additional NLA completed during FY21

▪ Approximately an additional 100,000m2 of NLA under development to                                                -
  be delivered over the next 2 years – continues to add built capacity
                                                                                                                  Jun-14   Jun-15      Jun-16   Jun-17
  and providing ongoing opportunity for organic growth
                                                                                                                  Jun-18   Jun-19      Jun-20   Jun-21

1Australian  & NZ Portfolio as at 30 June 2021 (204 centres) excludes Wine Ark and licensed centres
2Based   on securities on issue at 30 June 2021
                                                                                                                                                         8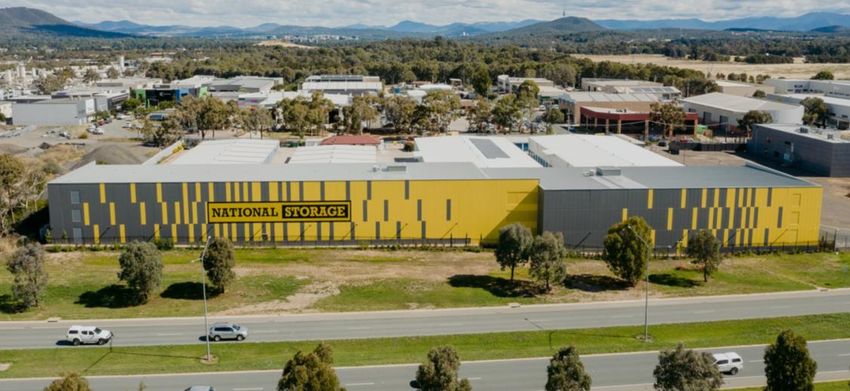
SUMMARY BALANCE SHEET                                             AS   AT   30 JUNE 2021

NTA UPLIFT AND BALANCE SHEET GEARING PROVIDES CAPACITY FOR GROWTH

                                                                                     $ Million                                      Jun 21      Jun 20      Movement
▪   NTA increased by 15% to $1.89 per stapled security                               Cash                                                95.9        90.4         5.5
    (June 2020: $1.65)                                                               Investment Properties          1
                                                                                                                                      2,950.9     2,288.0       662.9
                                                                                     Intangible Assets                                   47.2        46.6         0.6
                                                                                     Other Assets                                        47.2        44.7         2.5
▪   Investment properties held increased by 29% to $2.95b
    (June 2020: $2.28b):                                                             Total Assets    1
                                                                                                                                     3,141.2     2,469.7        671.5

       ▪   25 acquisitions settled for $352m
                                                                                     Debt 2                                            758.1       677.7         80.4
       ▪   Australian primary cap rate tightened 50bps to 5.97%                      Distributions Payable                              49.7        34.5         15.2
           (June 20: 6.47%)                                                          Other Liabilities                                  48.8        35.7         13.1
       ▪   New Zealand primary cap rate tightened 59bps to 6.07%                     Total Liabilities                                 856.6       747.9        108.7
           (June 20: 6.66%)
                                                                                     Net Assets                                      2,284.6     1,721.8        562.8
                                                                                                                                                                  -
▪   Cash as at 30 June 2021 $95.9m
                                                                                     Net Tangible Assets                              2,237.4     1,675.2       562.2
                                                                                     Units on Issue (m)                               1,183.1     1,013.7       169.3
▪   Debt drawn $760m
       ▪   Gearing as at 30 June 2021 of 22% (June 2020: 25%)                        NTA ($/Security)                                   1.89        1.65         0.24

       ▪   Target gearing range 25% – 40%
       ▪   In excess of $900m of investment capacity to the upper end of the
           gearing range
                                                                                       1 - Net of Lease Liability
                                                                                       2 - Net of capitalised establishment costs
                                                                                                                                                                    9
NTA AND TOTAL RETURNS
 TRACK RECORD OF SOLID GROWTH CONTINUES
                                                                                                                                                                               NTA per security
                                                                                             2.00                                                                                                                                                                               $1.89
                                                                                                                                                                                                                                             $1.77
 ▪   Consistent NTA per stapled security growth trajectory since IPO                         1.80                                                                                                                                $1.63                    $1.65
                                                                                                                                                                                                                                                                    $1.72

                                                                                             1.60                                                                                                            $1.51     $1.52
            ▪   Representing a CAGR of 9.9% per annum for                                                                                                                          $1.34
                                                                                                                                                                                                $1.41
                                                                                             1.40
                securityholders                                                              1.20                                    $1.11        $1.12       $1.14
                                                                                                                                                                        $1.23

                                                                                                                             $1.00
                                                                                                                 $0.94
 ▪   NSR has materially outperformed the                                                     1.00
                                                                                                      $0.93

     average total return of the S&P/ASX A-REIT 200 Index1                                   0.80
                                                                                             0.60
                                                                                             0.40

 ▪   FY21 total return of 19.5% continues to be driven by:                                   0.20
                                                                                             0.00
            ▪   Rising demand for self-storage underpinned by favourable                               IPO / Jun-14 Dec-14 Jun-15 Dec-15 Jun-16 Dec-16 Jun-17 Dec-17 Jun-18 Dec-18 Jun-19 Dec-19 Jun-20 Dec-20 Jun-21
                                                                                                      Dec-13
                macroeconomic trends
            ▪   Strong organic growth                                                                                                                                  NSR Total Returns
            ▪   Successful execution of acquisition strategy                                  30.0%

            ▪   Delivery of development opportunities with continued                          25.0%

                pipeline
                                                                                              20.0%

            ▪   Expansion opportunities across approximately 30% of the                                                                                                                                                                                        16.2%

                portfolio                                                                     15.0%
                                                                                                                                                                                                                                                               11.8%

            ▪   Technology and innovation based business                                      10.0%

                enhancements
                                                                                               5.0%

                                                                                               0.0%
                                                                                                        Dec-14      Jun-15      Dec-15       Jun-16       Dec-16      Jun-17      Dec-17        Jun-18        Dec-18    Jun-19      Dec-19       Jun-20        Dec-20       Jun-21

                                                                                                                                 NSR Total returns (annualised)                A-REIT 200 Total returns (annualised)              NSR Total returns (annualised)2

1National  Storage’s total return defined as change in NTA per security plus dividends per
security divided by the NTA per security at the commencement of the relevant period. Total
return for the S&P/ASX A-REIT 200 Index sourced from Bloomberg
                                                                                                                                                                                                                                                                                        10
CAPITAL MANAGEMENT FOR THE YEAR ENDED 30 JUNE 2021
STRONG BALANCE SHEET TO FUND CONTINUED ACQUISITION, Capital Management Jun-21 Jun-20
DEVELOPMENT AND EXPANSION GROWTH Cash Balance $95.9m $90.4m
Total debt facilities1 $1,164m $1,142m
▪ Gearing 22% - ICR 3.7x Total debt drawn $760m $685m
Remaining debt capacity (documented facilities) $403m $457m
▪ Total debt facilities1 $1,164m
Debt term to maturity (years) 2.8 2.8
▪ $403m undrawn
Gearing ratio (Covenant 55%) 22% 25%
▪ Approx $900m investment capacity to the upper end of gearing range Average cost of debt drawn 1.89% 1.90%
Interest coverage ratio (Covenant 2.0x) 3.7x 3.1x
▪ Weighted average debt maturity steady at 2.8 years
Debt hedged $432m $508m
▪ Target to extend NSR’s debt tenor beyond 4 years % debt hedged 57% 74%
▪ Weighted average cost of debt of 1.87%1 Average cost of hedged debt (incl. margin) 2.2% 2.1%
$A/$NZ = 1.074
▪ $432m hedged as at 30 June 2021
Current Debt Tenor
Hedge Expiry Profile (A$m) & Average Notional Swap Rate $ 300m
600 0.80%
0.60% $ 200m
400 Available Limit
0.40%
Current Drawn
200
0.20% $ 100m
- 0.00%
FY22 FY23 FY24 FY25 FY26 FY27 $m
FY22 FY23 FY24 FY25 FY25 FY26 FY27
Notional Swap Amount Average Swap Rate
1 Excludes swaps
11KEY OPERATIONAL METRICS - REVPAM
ACTIVE MANAGEMENT OF RATE AND
OCCUPANCY TO MAINTAIN MOMENTUM 230
GROUP REVPAM
220
210
▪ Driving REVPAM by balancing occupancy and rate growth on a 200
centre and individual unit basis 190
180
170
▪ Revenue management strategies delivering excellent results
▪ Sustained occupancy, rate and REVPAM growth over FY21
AUSTRALIAN REVPAM
240
▪ FY22 growth expected to moderate but remain strong 230
220
210
200
190
180
170
NEW
GROUP AUSTRALIA
ZEALAND
Occupancy 86.1% (+8.5%) 86.2% (+9.7%) 85.4% (+1.0%) Impacted by
NEW ZEALAND REVPAM acquisition
185
REVPAM $227 (+22.8%) $234 (+24.3%) $183 (+12.0%) 180
175
Rate $260 (+8.3%) $268 (+7.9%) $214 (+9.0%) 170
165
160
155
150
Group - Australia and New Zealand (142 centres)
Australia – 121 centres as at 30 June 2019 (excluding Wine Ark and let-up centres)
New Zealand - 21 centres as at 30 June 2021 (excluding let-up centres) 12KEY OPERATIONAL METRICS - OCCUPANCY
RECORD OCCUPANCY GROWTH DURING FY21 Group Occupancy
90.0%
80.0%
▪ Group occupancy 86.1% (+8.5%)
▪ Australian Portfolio 86.2% (+9.7%) 70.0%
▪ New Zealand Portfolio 85.4% (+1.0%) 60.0%
50.0%
▪ Continued strong occupancy growth
Jun-14 Jun-15 Jun-16 Jun-17 Jun-18 Jun-19 Jun-20 Jun-21
▪ All states, territories and provinces showing strong growth
Australian Occupancy
▪ In excess of 125,000m2 of occupancy added in FY21
90.0%
▪ 27% of centres above 90% occupancy (June 2020: 3%)
▪ 64% of centres above 85% occupancy (June 2020: 20%) 80.0%
▪ Approximately 90,000m2 of growth remains in the current portfolio to 70.0%
reach 90% occupancy
60.0%
▪ 100,000m2 of NLA under development
50.0%
Occupancy By State Jun-14 Jun-15 Jun-16 Jun-17 Jun-18 Jun-19 Jun-20 Jun-21
100.0%
90.0% New Zealand Occupancy
80.0% 90.0%
70.0%
60.0% 80.0%
50.0%
QLD NSW VIC SA/NT TAS ACT WA 70.0%
Jun-20 76.7% 74.2% 79.8% 71.1% 85.5% 84.4% 74.6% 60.0%
Jun-21 88.8% 82.7% 85.6% 83.7% 84.7% 89.4% 86.7%
50.0%
Jun-16 Jun-17 Jun-18 Jun-19 Jun-20 Jun-21
Group - Australia and New Zealand (142 centres)
Australia – 121 centres as at 30 June 2019 (excluding Wine Ark and let-up centres
New Zealand - 21 centres as at 30 June 2021 (excluding let-up centres) 13OPERATIONAL UPDATE
FOCUS ON OPERATIONAL EFFICIENCY
AND BEST PRACTICE OUTCOMES
▪ Centre Efficiency Program – new platform launched and
functioning across all revenue channels (call centre,
centres and website) targeting delivery of an exceptional
customer experience and improved conversion rates
▪ Initiation of the Multi Site Manager function - the roles
supporting our growth and talent retention strategy
▪ Significant advancements in reporting standards across all
levels of the operational platform - supported by regular
business reviews and team collaboration fostering
continuous improvement
▪ COVID-19 Strategic Plans initiated and implemented in all
areas while remaining fully operational within the unique
regional restrictions and requirements
▪ Full year of Centre and Operations Manager Incentive
Scheme completed with outstanding results above
expectations – new stretch targets set for FY22
14CUSTOMER SATISFACTION
MARKET LEADING CUSTOMER SATISFACTION AND INDUSTRY RECOGNITION
▪ NSR’s commitment to excellence recognised with NSR being awarded the coveted 2020 Canstar Blue Customer Satisfaction
Award for self-storage, receiving 5-stars in all categories
▪ NSR has also previously won Canstar Blue awards in 2017 (Australia) and 2018 (New Zealand)
Australia New Zealand
▪ NSR outperforms rest of market averages across all variables in Australia and New Zealand
Australia New Zealand
Source: Canstar 2020 Self-Storage reports Australia and New Zealand 15SUSTAINABILITY
NSR HAS A LONG TERM COMMITMENT TO ESG
▪ NSR is committed to meeting its commitment to sustainability across the environmental, social and governance landscape
▪ NSR’s ESG strategy focuses on three key pillars most relevant for the business:
Commitment to Sustainability
Our Economic ▪ NSR formalised its commitment
Performance Our People Our Transformation to sustainability in its inaugural
standalone Sustainability
Report published in 2017
• Delivering growth and • Creating a safe • Enabling adaptation
returns through and welcoming and innovation in a ▪ 2019 / 2020 represented the
sustainable finance, environment for competitive and fourth standalone report
efficient operations and customers and changing market undertaken by NSR,
management employees recognising the increasing
significance and importance of
sustainability on the future of
• Energy Efficiency • Pride in diversity • Improving customer the business
• Solar • Formalised policies and and employee
• LED statements experience
• Automated Self-Storage • 54% female workforce • Innovation and
• Building Methodology • Paid parental leave technology
• COVID-19 response
16SUSTAINABILITY
REDUCING OUR CLIMATE IMPACT
• NSR continues to consider climate change as an ongoing risk, which is continually measured and
mitigated
• NSR has engaged the Carbon Reduction Institute to conduct a NoCO2 Audit to measure its carbon
footprint in accordance with international best practice standards
• The NoCO2 Audit is currently underway and is scheduled to be completed in early 1H FY22
• Once completed, NSR will be able to use the knowledge and recommendations to plan and
implement additional measures to reduce its carbon footprint further
• An update on the NoCO2 Audit progress will be provided in detail in NSR’s fifth Sustainability Report
that is due to be released in October 2021
▪ NSR solar and LED program has had continued investment since 2017
▪ 7,675 solar panels installed as at June 2021
▪ 119 centres across the portfolio featuring solar power generation capabilities as at June 2021
▪ All new builds installed with LED lighting, efficient temperature control and other energy
efficient features
▪ Program for conversion of existing portfolio to more durable
and energy efficient lighting
Bundall, QLD
17NSR STRATEGY
FOUR PILLARS OF GROWTH
ORGANIC GROWTH ACQUISITIONS DEVELOPMENT TECHNOLOGY AND
AND EXPANSION INNOVATION
NSR achieves organic NSR has executed over NSR has highly developed NSR leads the Australasian
growth through a 150 high-quality and proven in-house storage industry with new
combination of acquisitions since its expertise to identify, technology and innovation
occupancy and rate IPO in December 2013 – a negotiate and deliver projects providing an
increases assessed on an growth rate unmatched in strategic development important competitive
individual centre basis the Australasian market and expansion projects advantage over its peers
18ORGANIC GROWTH
PORTFOLIO OPTIMISATION - BALANCING RATE AND OCCUPANCY GROWTH
▪ Detailed data collection across the group identifying
specific areas of opportunity to maximise occupancy,
rate and revenue
▪ Contact Centre optimisation through resourcing highly skilled
leadership, staffing structure and technology, results in improved
performance, cost efficiencies and maximising sales conversions
▪ Website optimisation and development focusing on an exceptional
customer experience, leading to optimised conversion rates of inquiries
into sales
▪ In-house digital marketing systems continue to deliver exceptional
results through leveraging sponsorships with advanced digital
campaigns and retargeting
▪ Organic and paid traffic focus across the group by the utilisation of
advanced software and reporting systems
▪ Improved revenue management system, which enables live frontline
intelligence feeding optimal commercial outcomes
19ACQUISITIONS
AUSTRALASIA’S NO. 1 ACQUIRER OF HIGH-QUALITY, INDEPENDENTLY OWNED STORAGE CENTRES
▪ Focus on “value” acquisitions New Zealand
PORTFOLIO VALUE (A$ MILLION)
Australia
▪ NSR remains acquirer of choice:
- - - - 6 8 8 11 11 13 14 22 23 23 25 25
38 41 49 54 59 68 97 102 107 117 127 141 154 161 176 181
▪ No FIRB approval required # assets
2,957
▪ Typical settlement time six weeks from acceptance of offer 3,000
2,657 350
▪ Over 90% of acquisitions are off market 2,500 318
2,275 2,281
CAGR: 37.1%
▪ NSR is the leading consolidator within the self-storage industry in 1,948 281 284
Australasia with over 150 centres acquired since IPO 2,000
A$ Million
247
1,593
▪ Key competitive advantages include: 1,500
1,431 116
2,607
1,244 93
1,163
2,339
▪ Highly experienced acquisition and integration teams 1,006 75
72
1,997
1,994
1,000 56
1,701
1,477
▪ Strong pipeline of future acquisitions based on over 30 years 666
1,339
569
1,172
500 56
1,087
of established industry relationships 402 31
950
500
274 316
610
538
500
402
316
274
▪ Over 20 independently owned, externally managed centres -
acquired
Dec-14
Jun-15
Dec-15
Jun-16
Dec-16
Jun-17
Dec-17
Jun-18
Jun-20
Jun-21
Dec-13
Jun-14
Dec-18
Jun-19
Dec-19
Dec-20
IPO /
20ACQUISITIONS – FY21
25 ACQUISITIONS TOTALLING $352M TRANSACTED NUMBER OF NLA
REGION
CENTRES (M2)
Melbourne 10 47,500
▪ 22 centres and three development sites acquired to 30 June 2021 for
$352m Sydney 2 13,100
Brisbane 2 13,400
▪ Major strategic portfolio acquisition in Melbourne of nine centres
with significant expansion potential Sunshine Coast 4 29,100
Central Coast (NSW) 2 15,700
▪ Three additional centres and one development site have settled or are
under contract post 30 June 2021 for $33m Perth 1 5,800
▪ Transacting high-quality acquisitions across Australia and Christchurch (NZ) 1 3,800
New Zealand Total Acquisitions 22 128,400
▪ Focus on “value” acquisitions
▪ Scalability of the operating platform continues to drive efficiencies
across the business
▪ Forward-looking acquisition pipeline remains strong
▪ Market remains highly fragmented
Noosa, QLD
21DEVELOPMENT AND EXPANSIONS
INCREASING FOCUS ON DEVELOPMENT AND EXPANSION PROJECTS
▪ Target projects providing additional built capacity in key markets 10 projects completed during FY21, adding 59,100m2 of NLA
▪ Locations selected after extensive heat mapping based on socio-
economic demographics and storage demand per capita analysis 22 active projects, with 7 projects under construction
▪ Combination of turnkey, greenfield/brownfield development and
expansion allows NSR to leverage its in-house development expertise
Aggregate NLA pipeline approximately 150,000m2
▪ Provides long-term enhanced revenue and NTA uplift outcomes for NSR
New developments
• Strategic expansion of existing sites with additional capacity where
occupancy levels are consistently high and demand exceeds supply
• Focus on expanding coverage in key target growth areas
Expansions – Existing centres
▪ Strategic expansion of existing sites with additional capacity where
occupancy levels are consistently high and demand exceeds supply
▪ Significant value-add potential (over 50 centres within current portfolio
with expansion possibilities)
“Revive” – Refurbishment program
▪ Assessment of every site from a safety, functionality, repair/ maintenance
cost, technology and visual appeal perspective
▪ Refurbish identified target assets to improve functionality and customer
experience to enhance revenue Montrose, TAS 22DEVELOPMENT
TARGETED DEVELOPMENT PROVIDING ADDITIONAL UNIT PIPELINE IN KEY AREAS
Overview
▪ Target projects providing additional pipeline in key areas
▪ Four projects completed during FY21 (29,500m2 of NLA)
▪ 15 active projects, with 7 projects under construction
▪ Aggregate NLA pipeline of approximately 107,000m2
▪ Combination of fully NSR, turnkey and JV development allows NSR
to leverage its in-house development expertise
▪ Provides enhanced revenue and capital outcomes for NSR
Manukau, NZ New developments
▪ Focus on expanding coverage in key target growth areas
▪ Built to exacting NSR specifications
▪ Application of new technology such as Bluetooth Smart Access to provide
improved efficiency and enhanced customer and employee experience
▪ Integration of the newly developed wayfinding concept
▪ Maximises returns on land within existing portfolio
▪ Targeting double digit 5-year IRR and 10%+ return on cost at
stabilised revenue
Manukau, NZ
23EXPANSION
EXPANSION AND REVIVE PROJECTS PROVIDING SIGNIFICANT VALUE ADD POTENTIAL
Overview
▪ Use of existing NSR owned land in proven locations
▪ 6 projects completed during FY21 (29,500m2 of NLA)
▪ 7 active projects
▪ Aggregate NLA pipeline of approximately 47,000m2
Expansions – Existing centres
▪ Strategic expansion of existing sites where occupancy levels are
consistently high and demand exceeds supply
BEFORE
▪ Optimisation of land parcels acquired over time (hardstand and
outdoor area conversions into more intensive storage uses)
▪ Significant value-add potential (over 50 centres within current
portfolio with expansion possibilities)
▪ Utilisation of surplus land, building over existing single-level
buildings or conversion of warehousing into higher density
storage utilisation
▪ Targeting 15%+ 5-year IRR and 10%+ return on cost at
stabilised revenue
AFTER
24TECHNOLOGY
HARNESSING NEW TECHNOLOGY AND INNOVATION
FOR ENHANCED BUSINESS OUTCOMES
▪ Business automation initiatives continue to form part of our
technology roadmap, with a pipeline of technology projects
planned
▪ Key business process improvement initiatives include:
▪ Automation of the customer quoting process, making it
entirely self service, digital and ‘bookable’ in one click
▪ Enhancing our customer portal capabilities on our website,
enabling greater self help and less human interaction for
greater convenience and efficiency
▪ Contact centre process optimisation - improving ability to
close sales, and service our customers
▪ Introduction of front facing business applications to
streamline the in-centre booking process
▪ On-boarding new National Storage sites and customers
through our digital platform
▪ Wine Ark Modernisation Project including a purpose built,
technology forward Cellar Management System together with a Bluetooth Smart Access
streamlined service offering across National Storage and Wine Ark
25TECHNOLOGY (cont.)
IT RISK ASSESSMENTS AND MITIGATION
▪ IT and Cyber Security Program
▪ Enhanced Security
▪ Antivirus software
▪ Email Filtering software
▪ Managed firewall
▪ 24-hour vulnerability monitoring
▪ Audit of our external application providers
▪ Audit of National Storage by external
provider to PCIDSS and IS 27 series standards
▪ Penetration testing
▪ Technology into new builds
▪ Collaborating with our development teams to
bring key technologies into new builds, expansions
and refurbishments
▪ Journey towards automation
26FY22 GUIDANCE & OUTLOOK
DISTRIBUTION GUIDANCE 90% - 100% OF UNDERLYING EARNINGS
UNDERLYING EPS 1 UNDERLYING EARNINGS
PER STAPLED SECURITY
Minimum 10% growth Greater than $110 million
1 – NSR provides this guidance assuming there are no material changes in market conditions or operating environments, including no material deterioration in COVID-19 restrictions and regulations
27THANK YOU
invest@nationalstorage.com.au
www.nationalstorage.com.auAPPENDICES
29CASE STUDY 1 - EXPANSION
MITCHELL – ACT
Optimisation of existing centre with
available hardstand
▪ NLA: 14,300m2
BEFORE
▪ Target Stabilised
▪ Additional NLA: Occupancy: 90%
6,800m2
▪ NLA: 7,500m2
▪ Valuation (Dec 20):
▪ Construction Time: $54m (based on
▪ Occupancy: 93% 12 months 85% occupancy)
▪ Valuation (Jun 19): ▪ Construction Cost: ▪ Est Value at Stabilised:
AFTER
$31m + $13m $65m
30CASE STUDY 2 - REPURPOSE
BIGGERA WATERS – GOLD COAST
Repurpose of regional retail space
▪ Convert existing market place
to storage
▪ Construction of purpose built
storage on carpark
▪ Existing market place ▪ Storage NLA: 9,900m2
building ▪ Construction cost: $14m
▪ 150 carpark spaces ▪ Construction time: 12 months
▪ Adjoining large format retail ▪ Valuation (on completion):
providing holding income $39m
▪ Acquisition cost: ▪ Estimated valuation at
stabilised:
AFTER
$23m $46m
31SUSTAINABILITY
PILLAR 1: Our Economic Performance
▪ NSR’s economic performance focuses on optimisation of operational systems in an efficient and
effective fashion.
▪ Highlights include:
Energy ▪ Solar ▪ Continued investment since 2017 in two phase installation program
Efficiency
▪ 7,675 solar panels installed as at 30 June 2021
▪ 119 centres across the portfolio featuring solar power generation
capabilities as at 30 June 2021
▪ LED ▪ All new builds installed with LED lighting, efficient temperature
Program control and other energy efficient features
▪ Program for conversion of existing portfolio to more durable
and energy efficient lighting
▪ “On-demand” lighting with motion sensors to reduce energy
consumption
Automated ▪ National Storage Robina opened in June 2020 as the first fully automated
Self-Storage self-storage centre in Australia
▪ Industry-first Bluetooth smart access technology which enables customers to
access their storage unit with one tap of their smartphone
Building ▪ Procurement practices focusing on sourcing materials of longevity
Methodology
▪ Natural ventilation designs, minimising heating and cooling requirements
32SUSTAINABILITY (cont.)
PILLAR 2: Our People
▪ Highly valued team of professional people critical to NSR’s present and future success Employment by Gender
March 2021
▪ Highlights include:
Pride in Diversity ▪ Policies and targets in place to meet NSR’s commitment to diversity and inclusion:
▪ Target growth for increased women in leadership roles
▪ Ongoing initiatives such as Women in Leadership program
▪ Workplace initiatives to create and support an inclusive environment for
all employees 46%
▪ Gender neutral human resource policies 54%
▪ Key focus on encouraging employees to be able to ‘bring their whole self to work’
Policies and ▪ Whistleblower policy to support the reporting of wrongdoing
Statements
▪ Introduction of paid parental leave
▪ Trading policy for the buying and selling of NSR securities
▪ Diversity policy to support inclusion in the workplace Male Female
▪ Code of conduct to govern the values, commitments, and ethical standards of NSR
▪ Modern slavery statement to ensure that slavery practices are not present in NSR’s
operations or supply chains
33SUSTAINABILITY (cont.)
PILLAR 3: Our Transformation
▪ Brand and service strategies focused on providing excellence in customer experience
▪ Highlights include:
Customer ▪ Brand and service strategies remain focused on excellence in customer service
Experience
▪ New sales training program to assist teams understand customer needs and tailor
solutions accordingly
▪ Launch of a new mobile-first website enabling customers to book and pay online
▪ Canstar Blue Awards for Australia and New Zealand’s most satisfied storage customers
Technology ▪ Harnessing of new technology and innovation for sustainable business outcomes
and Innovation and digital customer experience:
▪ Roll out of Contact-Free Move-In process
▪ Completion of first fully automated self-storage centre in Australia
▪ Development of National Storage Application Programming Interface
for integration with select partners
COVID-19 ▪ Safe work methods for staff, customers, and contractors tailored for each site and region
▪ Crisis Management Team formed (in-line with Disaster Recovery Plan)
▪ No lay-off of staff members as a result of the pandemic with no JobKeeper subsidies
▪ Implementation of remote working strategies reinforced capabilities for work from home
arrangements for head office staff
34NSR FOOTPRINT
*includes all centres managed, operated and licensed
as National Storage as at 30 June 2021
35PORTFOLIO METRICS
30 June 2020 30 June 2021
AUST NZ MGT TOTAL AUST NZ MGT TOTAL
Freehold centres 147 23 2 172 167 25 3 195
Leasehold centres 14 - - 14 14 - - 14
Total centres 1 161 23 2 186 181 25 3 209
Freehold NLA (sqm) 746,100 123,500 4,100 873,700 881,400 132,300 14,100 1,027,800
Leasehold NLA (sqm) 73,500 - - 73,500 73,500 - - 73,500
Total NLA (sqm) 819,600 123,500 4,100 947,200 954,900 132,300 14,100 1,101,300
Average NLA 5,100 5,400 2,100 5,100 5,300 5,300 4,700 5,300
Storage units 83,600 11,700 300 95,600 95,700 12,100 1,200 109,000
Investment Properties $1,997m NZ$304m N/A $2,282m $2,606m NZ$376m N/A $2,956m
Weighted average Primary cap rate 6.47% 6.66% N/A 6.49% 5.97% 6.07% N/A 5.98%
1 - Excludes two licensed centres.
36NOTES
37You can also read