Texas Commission on Virtual Education - Meeting #1 February 23, 2022
←
→
Page content transcription
If your browser does not render page correctly, please read the page content below

Texas Commission on Virtual
        Education
           Meeting #1
        February 23, 2022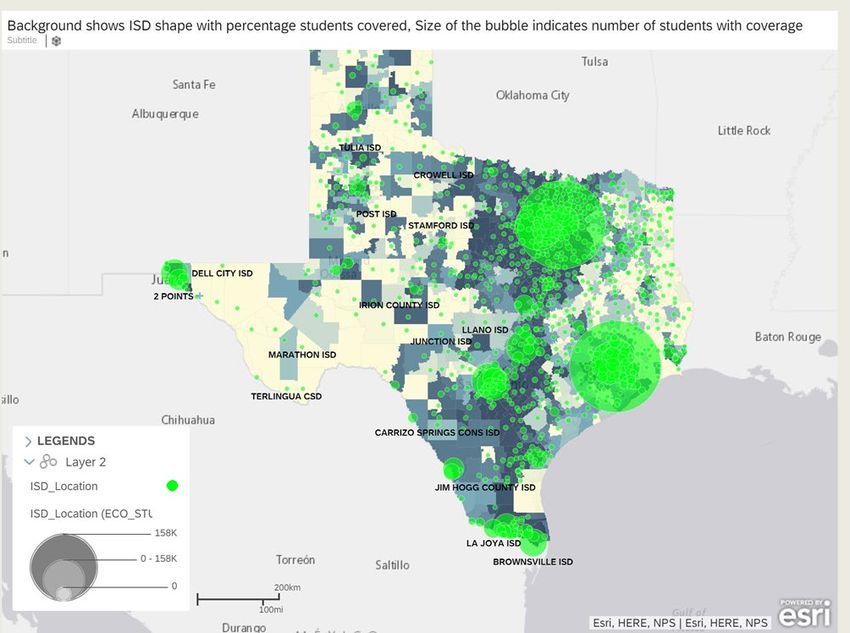
Agenda

Chair Opening Remarks & Introductions

State of Virtual Education in Texas

Operation Connectivity

Next Steps

                                        2
Agenda

Chair Opening Remarks & Introductions

State of Virtual Education in Texas

Operation Connectivity

Next Steps

                                        3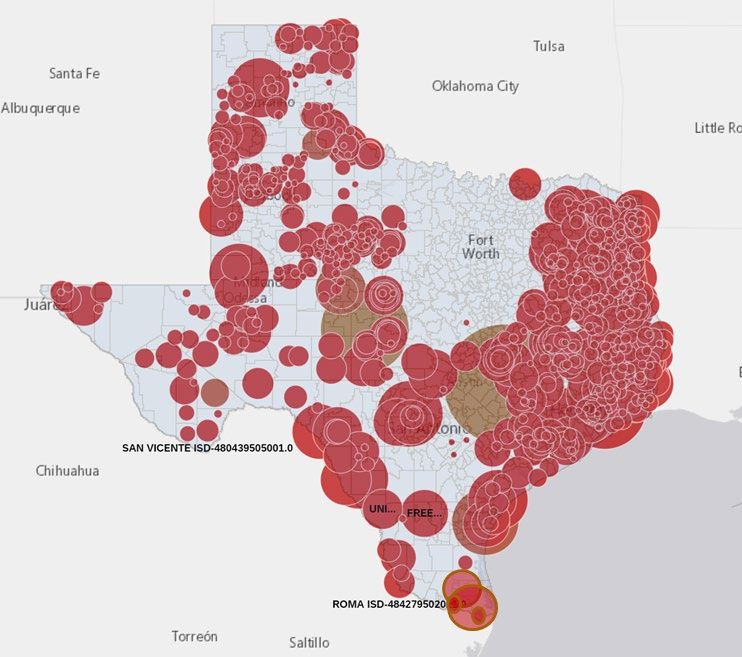
Chair Opening Remarks

 Introduction

 Vision & Goals for Commission

                                 4
Grounding: HB 3643 stipulations

 HB 3643 requires the establishment of a Virtual Education Commission to:

 • Develop recommendations to address issues related to delivery of and funding
   for virtual education, including alternative instructional delivery methods and
   methods of funding.

 • Convene a commission of 13 members to discuss and develop recommendations

 • Issue a report by December 31, 2022 with key findings and recommendations to
   guide legislature.

                                                                                     HB 3643
                                                                                        5
Introductions: Commission Members

                                                      Bernie Francis             Dr. Danny Lovett              Representative        Hannah Smith                   Josue Tamarez
                         Dr. Anette Tielle
                            Superintendent              Business Owner          Executive Direction Region 5   Eddie Morales           Carroll ISD DBoard                 Teacher
                                                     Appointed by Governor          Appointed by House         Appointed by House           Trustee                Appointed by Governor
                        Appointed by Lt. Governor
                                                                                                                                     Appointed by Governor

   Chairman
   Rex Gore
        SBEC
Appointed by Governor

                          Representative                  Senator                      Representative              Pam Little             Senator                     Senator
                             Ken King                   Larry Taylor                   Matt Shaheen               SBOE Appointment    Paul Bettencourt               Royce West
                                                    Appointed by Lt. Governor           Appointed by House                           Appointed by Lt. Governor   Appointed by Lt. Governor
                           Appointed by House

                                                                                                                                                                                         6
TEA & Office of the Governor Teams

Mike Morath          Kelvey Oeser           Hunter Thompson            Megha Kansra          Nichole Aguirre
                                                                                             Director of Virtual
                                                                                                                      Sydni Gaitan
Commissioner of   Deputy Commissioner of   Director of Governmental    Director of System                          Office of the Governor
  Education                                                           Support & Innovation     Education and
                     Educator Support              Relations
                                                                                                 Innovation

                                                                                                                                            7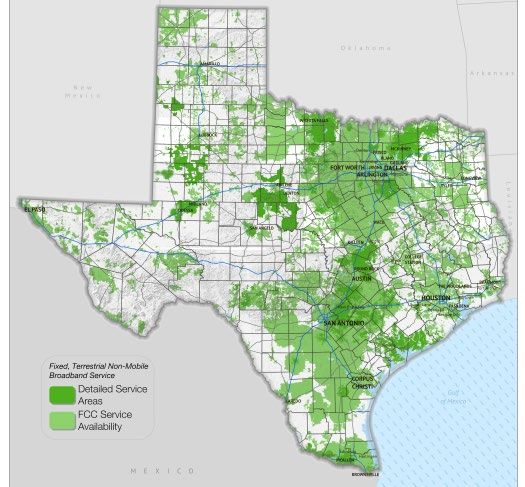
Commission Meeting Dates

                                      Meeting Dates

                           1.   February 23, 2022, 10 AM
                           2.   March 30, 2022, 10 AM
                           3.   April 27, 2022, 10 AM
                           4.   May 25, 2022, 10 AM
                           5.   June 29, 2022, 10 AM
                           6.   July 27, 2022, 10 AM
                           7.   August 24, 2022, 10 AM
                           8.   September 28, 2022, 10 AM
                           9.   October 19, 2022, 10 AM
                           10. November 30, 2022, 10 AM
                           11. December 14, 2022, 10 AM

                                                          8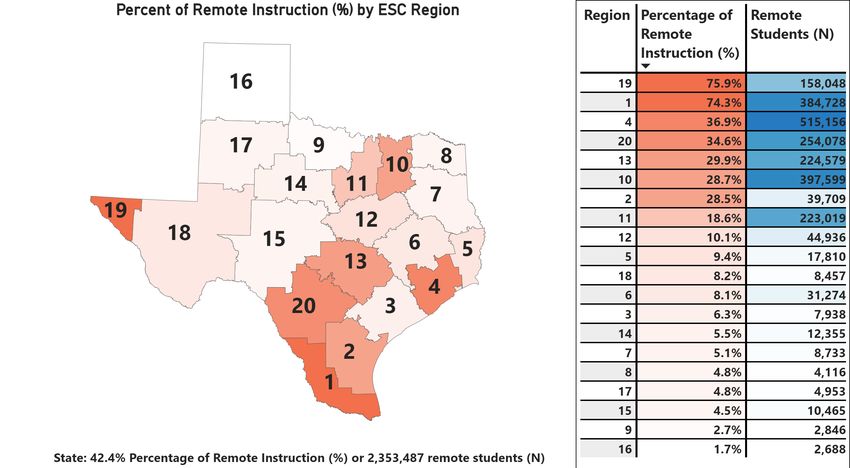
Tentative Agenda Topics

 •   State of Virtual Education in                •    Virtual Education and Innovative
     Texas in Texas                                    Practitioners
 •   Texas Virtual School Network                 •    Enrollment, Access, and Funding
 •   Policy Options and Practices                 •    Accountability
 •   Teacher Support                              •    2021-2022 STAAR Data Review
 •   Special Populations                          •    Public Testimony
 •   District and Charter Perspectives            •    Parent and Student Voice

                       We will iterate and develop meeting agendas to be responsive to
                                        commission questions and needs

                                                                                          9
Agenda

Chair Opening Remarks & Introductions

State of Virtual Education in Texas

Operation Connectivity

Next Steps

                                        10
Topics Covered Today
Key Definitions
Options for Virtual Education Available to LEAs Today
Senate Bill 15 Overview
Virtual Education Data:
• School Year 2020-2021
• Texas Virtual School Network (TXVSN)
11Key Definitions: Models for Virtual Learning
Virtual Program Virtual School Hybrid Learning
One virtual program (no new One virtual school (new CDCN / Hybrid grade(s) or school(s) with
CDCN / school number) set up to school number) set up to support learners who are on campus part of
support all 100% remote learners all 100% remote learners in the the week and remote for the rest of
in the LEA; other students attend LEA; other students attend school the week
school on campus on campus
Note: Blended Learning is an instructional model that combines face-to-face instruction with online learning to
help teachers effectively differentiate instruction for all students
12Key Definitions: Virtual Staffing Models
Concurrent Split Scheduling Split Staffing
Teachers deliver remote and on-campus Teachers deliver remote and on- Teachers within one site are staffed to
instruction in the same class period campus instruction but in separate deliver either remote or on campus
simultaneously class periods instruction, not both
Teacher 1
Teacher 1 1st per. 2nd per. Teacher 1 Teacher 2
*Currently not permitted under SB 15
13Key Definitions: Instructional Delivery Modes
• Synchronous Instruction: Two-way, real-time/live, • Asynchronous Instruction: Instruction that does
virtual instruction between teachers and students not require having the instructor and student
when students are not on campus. engaged at the same time.
Note: LEAs may choose to offer a combination of synchronous and asynchronous instruction experiences
14Texas has undergone 20+ years of virtual
education policy evolution
2022:
TCVE
2001: Senate Bill 975 2007: Senate Bill 1788 2013: House Bill 1926 launched
authorized pilot program established Texas Virtual opened TXVSN course
for LEAs to provide School Network (TXVSN) provider eligibility to non- 2021: Senate Bill 15
electronic courses to out of SB 975 pilot LEA entities and establishes passed, providing ADA
students “moratorium” on future for remote learning
TXVSN full-time schools meeting key criteria
2020: Remote Learning
Emergency Framework
established by TEA via
disaster-based authority
for SY20-21 only
15Today, multiple remote learning options are
available for Texas districts and charters
LEA Remote Learning Options ADA Funding
Full Partial
Remote Conferencing X
Short-term option for students who typically have a medical need to be remote
Senate Bill 15 Local Remote Learning Program X
Full time virtual or hybrid instruction meeting requirements set forth by SB 15
TXVSN Network Full-Time Schools X
Full-time virtual schools (currently “capped” at 7 providers)
Texas Tech University Online & UT Online High School X
Two Universities authorized by State law to offer online special purpose LEAs
TXVSN Catalog Courses X
Individual virtual courses provided by approved catalog course providers
Other Remote Courses/Programs X
Ad hoc programs providing remote courses for credit
Non-SB 15 Full-Time Remote/Hybrid Learning X
Virtual learning provided outside of above options, eligible for certain FSP
Allotment Funding but not full ADA funding
*Note: We will dive into many of the above options further over the course of the Commission
16FYI: Remote Conferencing is another available
option for remote learning
These two requirements must be met:
• The student is unable to attend school because of a temporary medical condition, and
• The total amount of remote conferencing instruction does not exceed more than 20 instructional days
over the entirety of the school year.
In addition, one of the following requirements also must be met:
• The student’s temporary medical condition is documented by a physician licensed to practice in the United
States. The documentation must include a statement from the physician that the student is to remain
confined to their home or to a hospital
• The student has a positive test result for a communicable condition listed in 25 TAC §97.7, or
• The student has been identified as having been in close contact with COVID-19.
The question of whether to create incentives for higher quality short-term remote instruction than, say, homework
packets is different from the question of the best way to support virtual/hybrid learning as a specifically planned
learning environment, and is perhaps worthy of discussion by the commission.
17SB 15 Overview
Senate Bill 15 (SB 15) was signed into law on September 9, 2021.
Local educational agencies (LEAs) may now receive full ADA
funding for students who attend local remote learning programs
that meet the requirements set by SB 15.
In effect through September 1, 2023.
18What does SB 15 (87th) allow?
• Synchronous instruction
Modality • Asynchronous instruction
• Combination of synchronous and asynchronous instruction
Grades • K-12
• For LEAs who met all requirements of SB 15 in SY21-22, retroactive
Retroactive funding
funding prior to bill passage for remote learning delivered
• Hybrid learning: Mix of on-campus and remote instruction is allowable
Additional flexibilities
• Ability to contract with another LEA
19LEAs must meet key requirements in order to
receive funding under SB 15 (87th)
LEA Eligibility • C or higher performance rating
• At least one STAAR-assessed grade level, or complete high school program
Program
• Provide families an on-campus option
Requirements
• Administer assessments to remote students in same manner as on-campus students
Teacher • Professional development on virtual instruction
Requirements • No concurrent instruction
20LEAs may only enroll up to 10% of their total
enrollment in a local remote learning program
Who counts toward the 10% cap?
Any student who enrolled for even a portion of the year in local remote instruction
under SB 15 (87th)
Any student receiving remote instruction NOT under the local remote program who
received more than 50% of instructional days via remote learning. This can include:
• Medically fragile
• Placed in a remote learning setting by an admission, review, and dismissal
committee
• Receiving accommodations under Section 504 of the Rehabilitation Act of 1973
• Served via remote conferencing
21LEAs will receive local remote learning program
evaluation ratings
• Local remote learning program A-F evaluation ratings
• Publicly posted
• Counts as enrolled students who spent at least half of their
instructional days receiving remote instruction
22For a student to count toward ADA under SB 15,
certain eligibility requirements must be met
Based on student information from the If a student did not receive a majority of their
preceding school year, if a student received instructional time in the preceding school year via
remote instruction, then the criteria noted above
remote instruction for a majority of their do not apply to determine student eligibility for
instructional days in the previous school year, remote learning. However, criteria noted in the next
they also must have: section apply to all students.
• Achieved satisfactory achievement or higher on each Based on student information from the current school
STAAR assessment administered. year:
• The student is enrolled in a school district or open-enrollment
• Had a number of unexcused absences that is 10 charter school.
percent or fewer out of all instructional days.
• The student has reasonable access to in-person services at a
• Earned a grade of C or higher in the foundation LEA or school facility.
curriculum courses taken virtually or remotely in the • The student has fewer than 10 unexcused absences over a six-
preceding school year. month period.
23SB 15 is in early implementation stages
We plan to return to SB 15 in more detail in a later
Commission meeting, when more implementation
data will be available
24Today, we have data to share from two
significantly different virtual education contexts
SY20-21 Pandemic-Era Virtual Education TXVSN Historical Data
Brief timespan. 1 year of data, disrupted at various points Longer timespan. 10+ years of data
by the pandemic
Covers majority of state. First time a majority of LEAs Limited scope. 7 full-time schools supporting 33,000
delivered remote learning; 2.3M students students overall
Emergency response. LEAs set up virtual learning quickly, Intentionally planned schools. TXVSN schools required
with varying quality planning, course approval, and authorization
Low choice. Many students and families temporarily High choice. 100% of students and families opted into
selected virtual learning out of pandemic fear/concern, TXVSN enrollment
and lacked a spectrum of model choices
Learning curve. Parents, students, teachers, and leaders Adaptation to virtual education. For those enrolled or
unaccustomed to virtual learning teaching in TXVSN for more than one year, established
routines, systems, and culture for virtual learning
Concurrent instruction. Most virtual students were in
classrooms simultaneously with in-person students Non-concurrent instruction. 100% virtual classrooms
25We will start with SY20-21 pandemic-era virtual
education, bearing in mind limitations of this data
SY20-21 Pandemic-Era Virtual Education TXVSN Historical Data
Brief timespan. 1 year of data, disrupted at various points Longer timespan. 10+ years of data
by the pandemic
Covers majority of state. First time a majority of LEAs Limited scope. 7 full-time schools supporting 33,000
delivered remote learning; 2.3M students students overall
Emergency response. LEAs set up virtual learning quickly, Intentionally planned schools. TXVSN schools required
with varying quality planning, course approval, and authorization
Low choice. Many students and families temporarily High choice. 100% of students and families opted into
selected virtual learning out of pandemic fear/concern, TXVSN enrollment
and lacked a spectrum of model choices
Learning curve. Parents, students, teachers, and leaders Adaptation to virtual education. For those enrolled or
unaccustomed to virtual learning teaching in TXVSN for more than one year, established
routines, systems, and culture for virtual learning
Concurrent instruction. Most virtual students were in
classrooms simultaneously with in-person students Non-concurrent instruction. 100% virtual classrooms
26Data Methodology Percentage at Meets Grade Level or Above: The percentage of individual student assessments that met or exceeded the “Meets Grade Level” standard for the STAAR test Classification as “majority remote” or “majority in-person”: Students with 50% or more attendance days coded as “remote” were classified as a remote student in calculations. Other students were coded as “in-person”
In school year 2020-21, the TEA released a
               virtual learning framework

             In-Person Instruction                                            Remote Instruction

         All LEAs required to provide                                                           Asynchronous Instruction
         an in-person option for                      Synchronous Instruction
                                                                                               (or a combination of sync/asynch)
         every student
                                                  • LEAs submitted an                       • TEA Asynchronous plan
                                                    attestation that outlines                 submission, approval, and
                                                    LEAs plan for providing                   posting required
                                                    remote synchronous                      • Daily student engagement
                                                    instruction                               checks for ADA funding
                                                  • Daily student engagement
                                                    checks for ADA funding

Key resources: TEA SY20-21 Attendance and Enrollment FAQ; TEA Synchronous & Asynchronous Instruction Guidance and Plan Requirements
                                                                                                                                      28
In SY20-21, 2.3M students, ~42% of students in the state
learned virtually for the majority of their instructional days
Remote vs. In-person Statewide Student Breakdown
Majority
2,353,487 remote learners
(42%)
3,184,681
Majority (58%)
in-person learners
• 29% of these students tested.Urban areas and areas closer to the Rio Grande had
higher percentages of remote learners
30Students in urban areas and areas closer to the Rio Grande also
spent the highest average percentage of days learning virtually
31Despite challenges due to COVID-19, a large majority of Texas
students took STAAR in SY20-21
Spring Participation in STAAR1 In 2019, Spring STAAR participation was
96%, compared to 87% in 2021.
96% The high level of participation – even
87%
among students who remained remote
most of the year – allows for statewide
> performance comparisons with prior years.
When we have STAAR data, we can better
target support to Texas kids, accelerating
their academic growth this summer and
2019 2021 next year.
1. Participation = total number of completed Spring STAAR test / total number of Spring STAAR tests eligible to be completed. 7.7M STAAR tests were completed in 2021. STAAR tests include 3-8
Mathematics, 3-8 Reading, 5 & 8 Science, 5 Social Studies, Algebra I, English I, English II, Biology, and U.S. History. Results for grades 3-5 combine assessments given in Spanish and English. Participation
does not include TELPAS, TELPAS Alternate, or STAAR Alternate 2. Note: Spring 2021 STAAR results are for learning and recovery planning only – no SSI grade promotion requirements or ratings for
districts or campuses. There is no 2020 STAAR data because of cancellation of STAAR in spring 2020. | Source: Spring 2019 and Spring 2021 STAAR DataSTAAR performance showed a decrease in academic
performance with a larger decline in math than reading
The percentage of students that met grade The percentage of students that met grade level
level or above in reading declined by 4%. or above in math decreased by 15%.
Reading1 Math2
% Met Grade Level or Above % Met Grade Level or Above
47% 50%
-4% 43%
-15%
35%
2019 2021 2019 2021
1. Includes STAAR 3-8 Reading, English I and English II EOC Assessments; 2.7M tested students in 2019 and 2.4M in 2021 2. Includes STAAR 3-8 Mathematics, Algebra I EOC Assessment; 3.3M tested students in 2019 and 2.9M in 2021. Note: Results for
grades 3-5 combine assessments given in Spanish and English. Participation in STAAR math and reading assessments in 2021 was 86%. Spring 2021 STAAR results are for learning and recovery planning only – no SSI grade promotion requirements or
ratings for districts or campuses. There is no 2020 STAAR data because of cancellation of STAAR in spring 2020. | Source: Spring 2019 and Spring 2021 STAAR DataThe negative impact of COVID-19 erased years of
improvement in reading and math
Reading results had steadily improved since 2012, Math results had dramatically improved since 2012
with COVID-19 dropping Texas back to 2016 rates. with COVID-19 dropping Texas to 2013 passing rates
Reading1 Math2
% Met Grade Level or Above % Met Grade Level or Above
50%
48%
47%
45% 45%
44% 43%
43%
42% 42%
41%
40%
COVID
COVID
39%
38%
37%
34% 34%
35%
2012 2013 2014 2015 2016 2017 2018 2019 2020 2021 2012 2013 2014 2015 2016 2017 2018 2019 2020 2021
1. Includes STAAR 3-8 Reading, English I and English II EOC Assessments 2. Includes STAAR 3-8 Mathematics, Algebra I EOC Assessment Note: Results for grades 3-5 combine assessments given in Spanish and English. Results exclude STAAR-M,
STAAR-L, STAAR-A, STAAR Alternate, STAAR Alternate 2 during any years they were offered. Participation in STAAR math and reading assessments in 2021 was 86%. Spring 2021 STAAR results are for learning and recovery planning only – no SSI
grade promotion requirements or ratings for districts or campuses. There is no 2020 STAAR data because of cancellation of STAAR in spring 2020. | Source: 2012-2021 Spring STAAR DataStudents who received more virtual instruction were likelier to
see drops in STAAR performance, particularly in math
% of days virtual (student level)
0-25% 25-50% 50-75% 75-100%
-0%
0% Reading
-2% Math
Change in % Met Grade Level or Above
3% 3%
from 2019 to 2021 for all students
-4%
4%
-6% 5%
-8%
-10%
-12% 11%
-14%
-16%
17%
-18%
-20%
-22% 21%
35Generally, in math, a higher percentage of remote learners
corresponded to higher year-over-year learning loss
R² = 0.2702
y=-.22x-.06
36Longitudinal Student Growth: Overall, significantly more
students failed to gain a year’s worth of academic
growth per year than in prior years
Change in Performance Level
16% Increased
20%
35% 29% Sustained Masters
12% Sustained Approaches/Meets
15%
Sustained Did Not Meet
19% 13%
15% Declined
20%
15% 22%
24% 17%
16%
10% 38%
28%
17% 19%
Math 2017-2019 Math 2019-2021 Reading 2017-2019 Reading 2019-2021
Subject and Years
37Students who received more virtual instruction were
likelier to fail to gain a year academically in math
% of students by change in % of students by change in
Math performance level Reading performance level
14% 11% 9%
21% 22% 19% 18% 18%
8% 12%
9%
12% 12% 17%
15% 17% 15% 16%
20% Increased
Sustained Masters 20% 20%
19% 15% 20%
22% Sustained Approaches/Meets 21%
18%
Sustained Did Not Meet 20%
13% 21% 16%
Declined 16%
45% 49%
39%
30% 25% 28% 30% 31%
0-25% 25-50% 50-75% 75-100% 0-25% 25-50% 50-75% 75-100%
Percent of instructional days virtual Percent of instructional days virtual
38In-person students were more likely to grow a year or
more in a year’s time than virtual students in math
Declined Sustained Masters
Sustained Did Not Meet Increased
Sustained Approaches/Meets
All Virtual 48% 16% 16% 11% 9%
All In Person 32% 14% 21% 13% 19%
EcoDis Virtual 51% 20% 15% 5% 9%
EcoDis In Person 34% 19% 21% 7% 19%
Non EcoDis Virtual 42% 8% 17% 22% 11%
Non EcoDis In Person 30% 7% 22% 22% 20%
• 75% of virtual students participated in math STAAR assessments. 72% of virtual students were included in accountability.
• 97% of in-person students participated in math STAAR assessments. 92% of in-person students were included in accountability.
* TEA collected Crisis Code information during the 2020-21 summer PEIMS collection, denoting whether a student was being educated in person or remotely. Summer 2021 contains the entire August 2020- May 2021
school year. A second note here is the different levels of participation rate for each sub-group population.Note that pandemic-era data has limitations; conclusions
to guide future policy should be drawn carefully
SY20-21 Pandemic-Era Virtual Education TXVSN Historical Data
Brief timespan. 1 year of data, disrupted at various points Longer timespan. 10+ years of data
by the pandemic
Covers majority of state. First time a majority of LEAs Limited scope. 7 full-time schools supporting 33,000
delivered remote learning; 2.3M students students overall
Emergency response. LEAs set up virtual learning quickly, Intentionally planned schools. TXVSN schools required
with varying quality planning, course approval, and authorization
Low choice. Many students and families temporarily High choice. 100% of students and families opted into
selected virtual learning out of pandemic fear/concern, TXVSN enrollment
and lacked a spectrum of model choices
Learning curve. Parents, students, teachers, and leaders Adaptation to virtual education. For those enrolled or
unaccustomed to virtual learning teaching in TXVSN for more than one year, established
routines, systems, and culture for virtual learning
Concurrent instruction. Most virtual students were in
classrooms simultaneously with in-person students Non-concurrent instruction. 100% virtual classrooms
40Insight #1: LEAs needed significant support
setting up curricular and technology systems
Learning Management
Devices / Connectivity Curriculum
System
Operation Connectivity Texas Home Learning 3.0 (THL 3.0) TEA provided all Texas school
launched to help connect all of launched to provide free access to systems access to PowerSchool’s
Texas’s 5.5 million public school high quality instructional material Schoology for two years at no cost.
students with a device and that operates effectively in in-
reliable internet connection. person and virtual environments. Currently, Schoology is used in
Materials cover: schools representing more than
*To be discussed further today • Pre-K one million students across Texas
• RLA K-12 (incl. Spanish K-5) (1 in 5 students statewide).
• Math K-12
• Science K-5
41Insight #2: Staffing models were a significant
challenge to effective virtual instruction
Concurrent Split Scheduling Split Staffing
Teachers deliver remote and Teachers deliver remote and Teachers within one site are
on-campus instruction in the on-campus instruction but staffed to deliver either remote
same class period in separate class periods or on campus instruction, not
simultaneously both
Teacher 1
Teacher 1 1st per. 2nd per. Teacher 1 Teacher
A significant number of 2
LEAs engaged in
concurrent instruction,
which strained
teachers and students
422 SY20-21
Insight #3: School leaders and teachers faced
challenges that continue to require support
Curriculum LEAs had long used was not effectively set up for virtual instruction and engagement
Student engagement and attendance in virtual environments was challenging
Technology and LMS learning curve was steep for teachers.
Note: Research shows that LMS organization in particular is a key differentiator for virtual classrooms
School systems did not immediately know to how support students with disabilities and emergent
bilingual students in virtual environments
Parent and family onboarding, capacity-building, and ongoing engagement for effective virtual
instruction was uneven and took time to build up
43TXVSN data provides more insight into results of
intentionally planned, high choice virtual learning
SY20-21 Pandemic-Era Virtual Education TXVSN Historical Data
Brief timespan. 1 year of data, disrupted at various points Longer timespan. 10+ years of data
by the pandemic
Covers majority of state. First time a majority of LEAs Limited scope. 7 full-time schools supporting 33,000
delivered remote learning; 2.3M students students overall
Emergency response. LEAs set up virtual learning quickly, Intentionally planned schools. TXVSN schools required
with varying quality planning, course approval, and authorization
Low choice. Many students and families temporarily High choice. 100% of students and families opted into
selected virtual learning out of pandemic fear/concern, TXVSN enrollment
and lacked a spectrum of model choices
Learning curve. Parents, students, teachers, and leaders Adaptation to virtual education. For those enrolled or
unaccustomed to virtual learning teaching in TXVSN for more than one year, established
routines, systems, and culture for virtual learning
Concurrent instruction. Most virtual students were in
classrooms simultaneously with in-person students Non-concurrent instruction. 100% virtual classrooms
44Overview: Texas Virtual Schools Network
Full Time Virtual Schools Course Catalog
• Total: 33,064 (21-22 SY) • Total: 6,658 (20-21 SY)
# Students
• Elementary (3-5): 5,622 Middle: 16,993 High: 10,449 • Elementary: NA Middle & High: 6,658
• Total: 7 • Total: 14
# Providers
• Elementary: 5 Middle: 5 High: 7 • Elementary: NA Middle: NA High: 14
• “Capped” at 7 providers for full funding
LEA Eligibility
• Key Criteria: Accountability – Acceptable; Accredited Status; • Key Criteria: Accountability – Acceptable
Criteria
Financial – Standard Achievement; Grades 3-12
LEA Program and • Program – 100% course standards met • Program – 100% course standards met
Teacher • Teacher – Texas certified or IHE credentialed (dual credit) • Teacher – Texas certified or IHE credentialed (dual credit)
Requirements • Professional development on virtual instruction that meets • Professional development on virtual instruction that meets
specific standards specific standards
Funding Basis • Successful course completion
Allowable Modes • 100% Virtual Learning (no in-person elements)
of Learning • Synchronous, asynchronous, or a combination
Data Source Enrollments: 2021-2022 PEIMS Snapshot, TXVSN catalog web page December 2021
45TXVSN full-time online school enrollments increased
64.5% in the past two years
Data Source: PEIMS and 2021-2022 September attendance
46TXVSN students have historically failed to gain a
year’s worth of academic growth per year at higher
rates than non-TXVSN students (math)
47TXVSN students have historically failed to gain a year’s
worth of academic growth per year at higher rates than
non-TXVSN students (reading)
48Detail: TXVSN longitudinal student growth varies significantly by school
Detail: TXVSN schools have different enrollment windows

                                                  Closed Fall 2021 enrollment windows (no fall
                                                  waitlist)

                                                  1426 students on waitlist in advance of Spring
                                                  2022 enrollment windows

                                                  Provide continuous enrollment options

Data Source: TXVSN OLS Survey, November 4, 2021
                                                                                                   50
Overview: Texas Virtual Schools Network
Full Time Virtual Schools Course Catalog
• Total: 33,064 (21-22 SY) • Total: 6,658 (20-21 SY)
# Students
• Elementary (3-5): 5,622 Middle: 16,993 High: 10,449 • Elementary: NA Middle & High: 6,658
• Total: 7 • Total: 14
# Providers
• Elementary: 5 Middle: 5 High: 7 • Elementary: NA Middle: NA High: 14
• “Capped” at 7 providers for full funding
LEA Eligibility
• Key Criteria: Accountability – Acceptable; Accredited Status; • Key Criteria: Accountability – Acceptable
Criteria
Financial – Standard Achievement; Grades 3-12
LEA Program and • Program – 100% course standards met • Program – 100% course standards met
Teacher • Teacher – Texas certified or IHE credentialed (dual credit) • Teacher – Texas certified or IHE credentialed (dual credit)
Requirements • Professional development on virtual instruction that meets • Professional development on virtual instruction that meets
specific standards specific standards
Funding Basis • Successful course completion
Allowable Modes • 100% Virtual Learning (no in-person elements)
of Learning • Synchronous, asynchronous, or a combination
Data Source Enrollments: 2021-2022 September attendance , TXVSN catalog web page December 2021
51TXVSN Course Catalog – How it works
Catalog
Provider
District or Charter School Enrolled Student Completion
• Offers TEA-approved high • Selects courses and enrolls • Participates in course • Fee based on student
school or dual credit students • Synchronous success
courses through catalog • Awards credit • Asynchronous • Success 100%
• Provides certified and • Benefits for LEAs • Combination • Not successful 70%
trained instructor • Course choice • Receives mentoring and
• Provides LMS and support • Schedule flexibility support from local school
• Sets course fee up to • Credit advancement
$400/student or recovery
• Personalized
instruction
• Teacher shortages
52TXVSN student-facing and professional
development courses must meet key requirements
TXVSN courses must meet the following course requirements for a course to be offered in a TXVSN online school or
TXVSN course catalog.
1. Course must meet the definition of a TXVSN course as defined in Texas Education Code (TEC), Chapter 30, including
emphasis on extensive communication between student and teacher and among students.
2. Meet 100% of the Texas Essential Knowledge and Skills (TEKS) state curriculum standards and corresponding breakouts.
3. Meet 100% of the Texas Content Quality Measures.
4. Meet 100% of the NSQ National Standards of Quality for Online Courses .
5. Meet current federal accessibility requirements listed in Section 508 of the Rehabilitation Act of 1973, including
requirements for creating accessible digital products and websites.
TXVSN professional development courses must meet the following course requirements to be included in the
TXVSN professional development offerings.
1. Meet 100% of the NSQ National Standards For Quality Online Teaching.
2. Meet current federal accessibility requirements listed in Section 508 of the Rehabilitation Act of
1973, including requirements for creating accessible digital products and websites.
53Recall: Each data set provides insights, but also
carries limitations for drawing policy conclusions
SY20-21 Pandemic-Era Virtual Education TXVSN Historical Data
Brief timespan. 1 year of data, disrupted at various points Longer timespan. 10+ years of data
by the pandemic
Covers majority of state. First time a majority of LEAs Limited scope. 7 full-time schools supporting 33,000
delivered remote learning; 2.3M students students overall
Emergency response. LEAs set up virtual learning quickly, Intentionally planned schools. TXVSN schools required
with varying quality planning, course approval, and authorization
Low choice. Many students and families temporarily High choice. 100% of students and families opted into
selected virtual learning out of pandemic fear/concern, TXVSN enrollment
and lacked a spectrum of model choices
Learning curve. Parents, students, teachers, and leaders Adaptation to virtual education. For those enrolled or
unaccustomed to virtual learning teaching in TXVSN for more than one year, established
routines, systems, and culture for virtual learning
Concurrent instruction. Most virtual students were in
classrooms simultaneously with in-person students Non-concurrent instruction. 100% virtual classrooms
54Virtual Course Offerings Independent of VSN
55TEA currently provides Texas College Bridge via
virtual delivery
Students are prepared for
entry-level college
coursework in English
language arts and
mathematics.
56
56Texas College Bridge provides options for the
HB5 College Preparatory Courses
As a Texas College Bridge grantee LEAs will
All Texas public school LEAs can access:
receive:
No-cost, online, adaptive college preparatory Funding to implement program locally. Funding
course curriculum for HB 5 College Preparatory may be used for:
English language arts and mathematics teacher stipends for successful student
(EdReady). completion (up to $100 per student per subject).
Competency-based progression aligned with counselor stipends for student completion of
college readiness exams like ACT and SAT counseling/advising online modules (up to $100
per student).
Dashboards to monitor and adjust student TSIA testing for participating students ($8 per
progress. student).
Professional development for teacher facilitators, Flexibility in program implementation
district coordinators, and counselors/advisors.
Access to all supports available to any Texas
Student-facing college and career planning public school.
tools, activities, and trackers.
57LEAs have already been accessing the Texas
College Bridge online courses
• Completion certifications earned by Texas
students
336 75 • English: 3,566
• Mathematics: 5,181
LEAs Colleges
• LEAs from every Education Service Center
Region are participating
9,445 11,146 •
•
Urban
Suburban
Active English students Active Mathematics
students • Small
• Rural
The College Bridge points to the potential of virtual education providing access to specialized courses, for example, AP
courses, that LEAs across the state may not be able to readily provide (for example, rural LEAs). The potential for
virtual education to be used for this purpose might be a consideration for this Commission.
58Q&A
59Agenda
Chair Opening Remarks & Introductions
State of Virtual Education in Texas
Operation Connectivity
Next Steps
60Overview of Operation Connectivity January 2022
In early 2020, Texas faced sizable device access and
connectivity gaps, especially in rural areas

                                *Map published by Connected nation on 01/31/2022 and can be accessed at the following
                                link: https://connectednation.org/texas/state-maps/

                                                                                                              62
Operation Connectivity was established in May 2020 by Governor
Abbott to address connectivity gaps
Phase 1: Bulk Purchase
Immediately connecting students with
learning devices and hotspots for the
2020-2021 school year
Phase 2: Medium-Term: Phase 3: Long-Term: Broadband
TEA Connect TX (TEACT) Infrastructure Development
Connecting students to Working with the Texas
Broadband Development Office to
reliable and affordable
close the remaining gap for
internet within existing students in areas where
infrastructure infrastructure does not currently
existOperation Connectivity conducted a survey in July 2020 in
preparation for OCs Bulk Purchase Program and Texas’ students
demonstrated far greater need than the national average
% of students without access at home
Internet gap
56%
Device gap1
39%
34%
1.8 to 2.0 million Texas
Students Lacked
Broadband Before the
Onset of COVID19
20%
2.9 to 3.1 million Texas Students
Lacked E-Learning Devices
Capable of Synchronous Learning
Texas’ Operation Connectivity LEA Survey US Census American Community Survey3 in Before the Onset of COVID19
In July of 2020 with 1,087 Responses2
1. Device gap defined as a student not having a laptop or tablet. 2. Results from Operation Connectivity Bulk Purchase Survey of all LEA’s with 1087 responses 3. 2018 US Census American
Community Survey, filtered for Texas 4. Total estimated student need calculated by applying percent of Texas students without both broadband or laptop/tablet to total enrollment 64 in
Texas Public Schools 2018-2019, segmented by district type (urban, suburban, rural, etc.)Operation Connectivity Phase 1:
Summary Impact of Operation Connectivity Bulk Purchase
and Reimbursement Programs Totaling $1 Billion Invested
In Phase 1 of OC 3.6 Million E-learning
devices and 874,019 hotspots were
distributed to economically disadvantaged
students across Texas
821 LEAs participated in OCs Phase 1
56% of participating LEAs were rural
At the conclusion of Phase 1, enough
devices were distributed to provide 1:1
device access to all economically
disadvantaged students across the stateOperation Connectivity Phase 2:
Summary Impact of Operation Connectivity’s Phase 2
Program TEA Connect Texas (TEACT)
OC’s Phase 2 mapping demonstrated that over 2 million
economically disadvantaged students have access to
commercially available broadband at home, but that only
a small % can afford it
Through the TEACT program, OC partnered with 14 ISPs to
facilite the bulk purchase of fixed lines by LEAs for
installation in student households
To date 111,412 lines have been ordered by LEAs, totaling
$26,498,443
19,365 households have signed-up for service to date
6,099 installations are scheduled or completedOperation Connectivity Phase 3:
Supporting the Broadband Development Office’s
infrastructure investments
Given the passage of HB 5 (87th
Legislative Session), the Comptroller now
administers the Broadband Development
Office.
Operation Connectivity has identified
several regions with low rates of
broadband access where pilot
infrastructure projects are under
discussion, and is working to ensure those
projects are submitted to the BDO for
consideration.Q&A
68Agenda
Chair Opening Remarks & Introductions
State of Virtual Education in Texas
Operation Connectivity
Next Steps
69Chair Closing Remarks
Rex Gore Next Commission Meeting:
Chairman March 30, 2022
Virtual Education Commission
70Contact Information
Please direct all questions to
VirtualEducationCommission@tea.Texas.gov
• 71% of these students tested.You can also read