Tellus Merge-2022 Airborne Geophysical Technical Report - (Operations, Logistics and Data Merging)
←
→
Page content transcription
If your browser does not render page correctly, please read the page content below
Tellus Merge-2022 Airborne
Geophysical Technical Report
(Operations, Logistics and Data Merging)
Document Information

Project title: Tellus Merge-2022 (A6, A8, A9 Blocks) Airborne Geophysics Technical
Report                              Current Document version V3
                                                  Date 10 March 2022
 Prepared By                 Date                          Comment

 M.D. Ture                   10/03/2022                    V3

 Reviewed By                 Date                          Comment

 M.R. Muller                 21/02/2022, 02/03/2022        Reviews of V1, V2

 J.A. Hodgson                23/02/2022                    Review of V1

 Approved By                 Date                          Comment

Version History

 Ver. No.      Ver. Date    Comment                                       Revised By

 V1            17/02/2022                                                 M.D. Ture

 V2            25/02/2022   Following M.R. Muller and J.A. Hodgson        M.D. Ture
                            review

 V3            10/03/2022   Following M.R. Muller review                  M.D. Ture

                                                 ii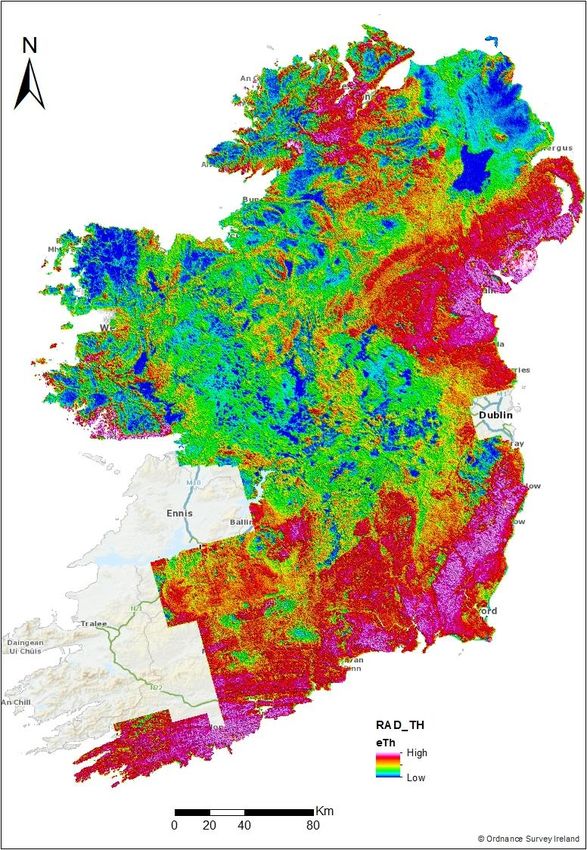
The Tellus Project
Tellus is a national programme to gather geochemical and geophysical data across the island of Ireland. The
survey examines the chemical and physical properties of our soils, rocks and waters to inform the
management of Ireland’s environment and natural resources. The project is managed by Geological Survey
Ireland and is funded by the Department of Environment, Climate and Communications (DECC).

For more information on the Tellus Project please visit www.gsi.ie/tellus.

Disclaimer
Although every effort has been made to ensure the accuracy of the material contained in this report,
complete accuracy cannot be guaranteed. Neither Geological Survey Ireland, nor the authors accept any
responsibility whatsoever for loss or damage occasioned, or claimed to have been occasioned, in part or in
full as a consequence of any person acting or refraining from acting, as a result of a matter contained in this
report.

Copyright
© Government of Ireland.
Basemaps © Ordnance Survey Ireland Licence No. EN 0047222.

                                                      iii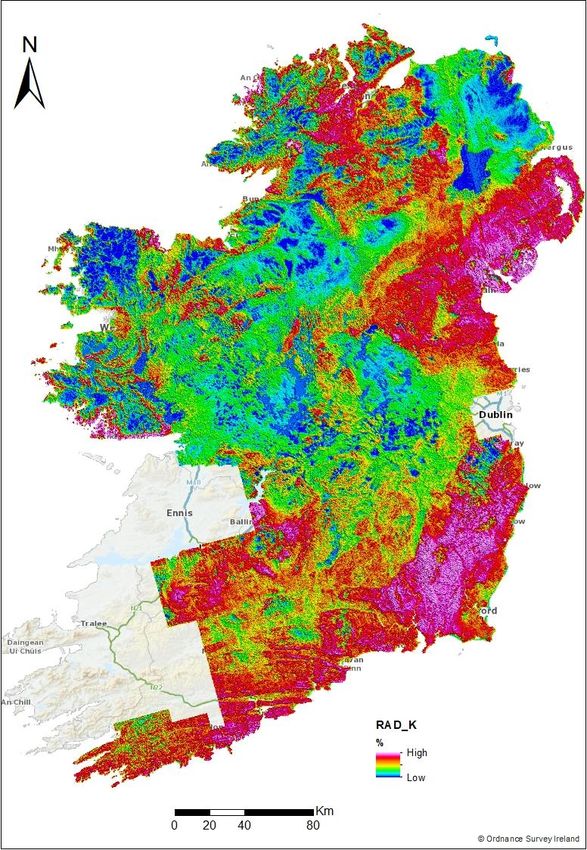
Executive Summary
Tellus is a national airborne geophysics mapping programme of Ireland and follows on from the Tellus Survey
of Northern Ireland in 2005-2006, with the first survey carried out in Ireland in 2011. Since then annual survey
blocks have generally progressed southwards through the country. The latest phase of the Tellus programme
collected airborne data over two new blocks (A8 and A9) in South Ireland (Counties of Tipperary, Kilkenny,
Laois and Waterford) & County Cork and are referred to as blocks A8 and A9 respectively. Surveying was
carried out between 20 September 2020 and 15 July 2021 (A8) and between 25 July 2021 and 21 September
2021 (A9) by Sander Geophysics Ltd (SGL). Previous airborne geophysical surveys were carried out across
Northern Ireland (Tellus) in 2005 and 2006 (Beamish et. al, 2006), parts of counties Cavan and Monaghan in
the ROI (Kurimo, 2006), counties Donegal, Leitrim, Sligo, Cavan, Monaghan and Louth as part of the EU
INTERREG IVA-funded Tellus Border Project (Hodgson and Ture, 2012), across counties Roscommon,
Longford and Westmeath as part of the Tellus North Midlands project (Hodgson and Ture, 2015), across parts
of counties Meath, Dublin, Kildare, Offaly, Laois and Wicklow (Block A1) in the east of the country in 2015
(Hodgson and Ture, 2016) and across County Galway (Block A2) in 2016 (Hodgson and Ture, 2017) and across
counties Mayo and Donegal (Blocks A3 and A4) in 2017 (Hodgson and Ture, 2018), across county Limerick
and west Cork (Blocks A5 and A6) in 2018-2019 (Hodgson, Ture and Muller, 2019) and across counties
Wexford, Wicklow, Kildare and Carlow (Block A7, SE Ireland) in 2019. The latest phases of airborne surveying,
A8 and A9 blocks were flown with the same aircraft based at Waterford Airport. All surveys measured
magnetic field, electrical conductivity and gamma-ray spectrometer data (primarily potassium, thorium and
uranium).

This report summarizes the main operations from the latest A8 and A9 surveys and discusses the processing
of the acquired data and its merging with pre-existing datasets to produce seamless merged geophysical
datasets. The A6 Block (west Cork) has a small overlap with A9 and is included in the merging of the current
data. It is anticipated, however, that a better constrained merge of A6 will be possible after completion of
subsequent survey blocks, which will provide more substantial overlap with A6.

The following data SGL data delivery numbers have provided the data for Blocks A6, A8 and A9
(respectively) for the merge; for magnetics: DLV2160, DLV2420, DLV2554; for radiometrics DLV2161,
DLV2419, DLV2433; for electromagnetics: DLV2159, DLV2421, DLV2439.

Acknowledgements
During the operation of the survey, Emma Scanlon and Margaret Browne at GSI, along with the public
relations company RPS, helped with the successful undertaking of the outreach Programme. The crew of SGL
are thanked for their hard work throughout the duration of the survey.

                                                      iv
Contents

Executive Summary .......................................................................................... iv

1. Tellus Geophysical Surveys ......................................................................... 1

     1.1 Overview of Tellus Project and previous surveys ..................................................1

2. A8 and A9 Survey Operations & Specifications ............................................... 2

     2.1 Flight characteristics and survey pattern ..............................................................4

     2.2 Flight permits ........................................................................................................5

     2.3 Geographic projection ..........................................................................................5

     2.4 Re-flight conditions ...............................................................................................5

     2.5 Survey equipment and aircraft systems................................................................6

            2.5.1       Survey Aircraft .......................................................................................6

            2.5.2       Geophysical Instrumentation ................................................................7

            2.5.3       Altimeter system ...................................................................................8

            2.5.4       Magnetic Base Station ...........................................................................8

3. Start-up Calibrations & Mobilisation ............................................................ 10

     3.1 Calibrations Introduction ....................................................................................10

     3.2 Magnetic Compensation .....................................................................................10

     3.3 Heading Error Determination .............................................................................10

     3.4 Lag and Parallax Test ..........................................................................................10

     3.5 Radiometric Calibrations.....................................................................................11

     3.6 EM System Orthogonality ...................................................................................12

     3.7 EM Over-Seawater Calibration ...........................................................................12

     3.8 Altimeter Calibration ..........................................................................................14

     3.9 Mobilisation ........................................................................................................14

                                                                                                                                    -v-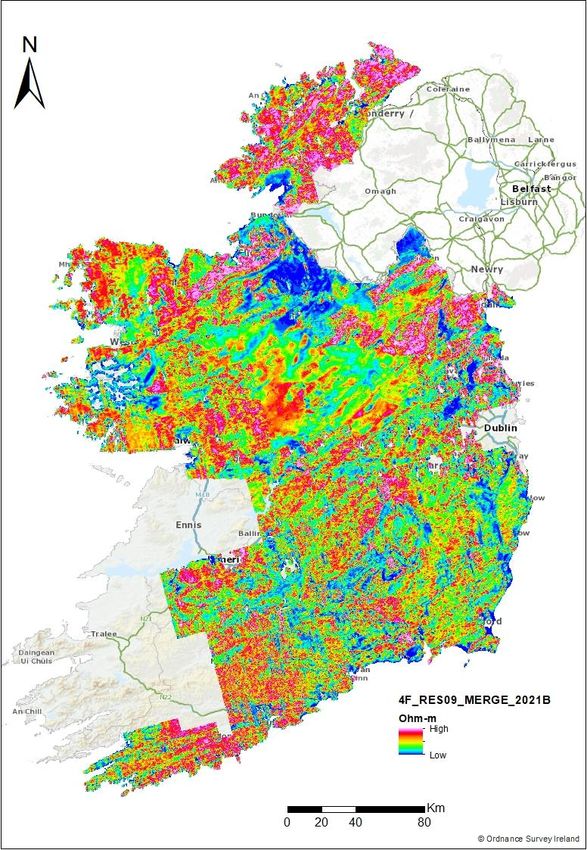
3.10 Test Line............................................................................................................14

     3.11 Personnel ..........................................................................................................14

4.Outreach Programme ................................................................................... 16

     4.1 Tellus Public Relations ........................................................................................16

5. Quality Assessment................................................................................... 17

     5.1 QA/QC.................................................................................................................17

6. Survey Outputs & Statistics ....................................................................... 18

     6.1 Survey Production...............................................................................................18

     6.2 Altitude ...............................................................................................................19

     6.3 Magnetic Data Summary ....................................................................................21

     6.4 Radiometric Data Summary ................................................................................23

     6.5 Frequency Domain Electromagnetic (FEM) Data Summary ................................26

7. Data Processing ........................................................................................ 28

     7.1 Introduction ........................................................................................................28

     7.2 EM data processing before merger.....................................................................29

     7.3 Noise reduction of FEM data ..............................................................................32

8. Data Merging Overview ............................................................................ 33

     8.1 Master Database.................................................................................................33

     8.2 Co-ordinates .......................................................................................................34

     8.3 Magnetic Data Merging ......................................................................................35

     8.4 Radiometric Data Merging ..................................................................................37

     8.5 Electromagnetic data merging ............................................................................46

            8.5.1. Overview of filters used ..........................................................................47

                                                                                                                                      - vi -
8.5.2 Levelling of EM data using interactive spectral filter................................49

             8.5.3 Final merged EM grids ..............................................................................53

9. Data Assessment and Consideration ......................................................... 60

      9.1 High Fly Zones .....................................................................................................60

      9.2 Magnetic Noise ...................................................................................................62

      9.3 Radiometric Noise...............................................................................................62

      9.4 Electromagnetic noise ........................................................................................63

      9.5 Data filtering .......................................................................................................63

10. Data Delivery ............................................................................................ 64

      10.1 Overview & Delivered Data...............................................................................64

References....................................................................................................... 66

                                                                                                                                     - vii -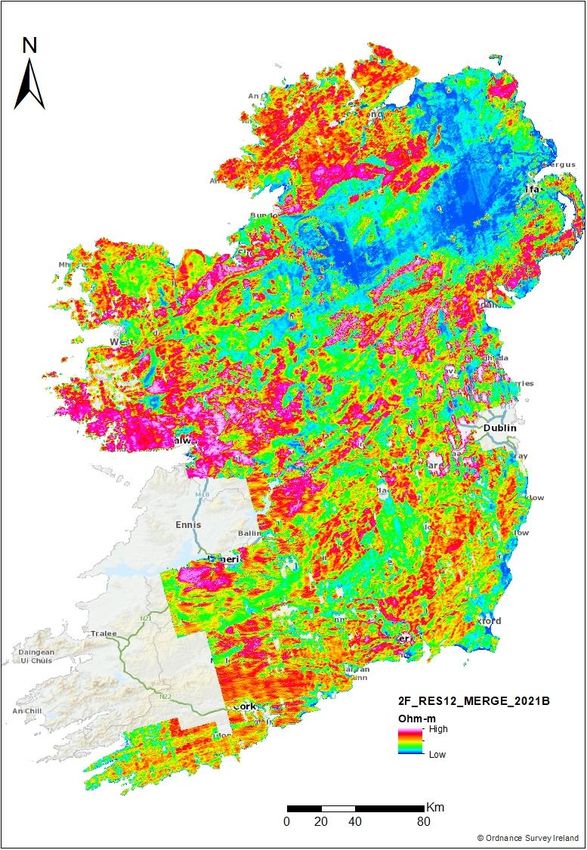
Figures
Figure 1: Tellus A8 block (left) and A9 block (right) survey areas over southern Ireland. ............................................ 2
Figure 2: Tellus survey blocks 2005 – 2021................................................................................................................ 3
Figure 3: Survey Aircraft – De Havilland Twin Otter, C-GSGF. .................................................................................... 6
Figure 4: Radiation Solutions spectrometer housed in the aircraft. ........................................................................... 8
Figure 5: Location of overwater calibration line Over Donegal bay and marine sampling locations (2005-2018). ..... 12
Figure 6. Waterford land/seawater test line location (red line, deep sea section indicated by yellow box). ............. 13
Figure 7: A8 (top) and A9 (bottom) weekly survey production in line-km per week. Week 6 and 44 show the largest
weekly flight km in A8 survey block, while week 6 indicated largest weekly km in A9 survey block. .......... 19
Figure 8: Survey altitude in metres above ground level for Block A8 (a) and A9 (b). ................................................ 21
Figure 9: Residual magnetic anomaly for the A8 (a) and A9 (b) blocks. High amplitude (positive) values shown in red
and low amplitude (negative) values shown in blue. ................................................................................. 22
Figure 10: Corrected total count values for the A8 (a) and A9 (b) blocks in counts per second. Offshore areas are not
clipped. .................................................................................................................................................... 24
Figure 11: Corrected potassium concentrations for the A8 (a) and A9 (b) blocks as percentage. Offshore areas are
not clipped. .............................................................................................................................................. 24
Figure 12: Corrected equivalent Thorium concentrations for the A8 (a) and A9 (b) blocks in parts per million.
Offshore areas are not clipped.................................................................................................................. 25
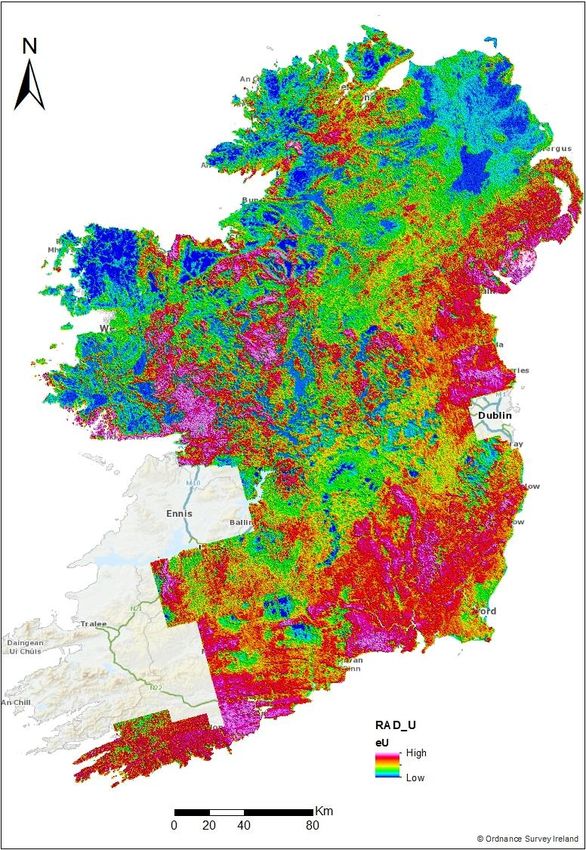
Figure 13: Corrected equivalent Uranium concentrations for the A8 (a) and A9 (b) blocks in parts per million.
Offshore areas are not clipped.................................................................................................................. 25
Figure 14: Apparent resistivity (contractor delivered) derived from 3 kHz data for blocks A8 (a) & A9 (b) in Ohm-m.
The effect of high-fly (as spurious, low resistivity areas) is clearly observed on both grids. ........................ 27
Figure 15: Powerline monitor map for A8 (left) and A9 (right) Blocks. ..................................................................... 29
Figure 16: Final apparent resistivity in Ohm-m for 25 kHz delivered by contractor for block A8 (left) and A9 (right)
blocks....................................................................................................................................................... 31
Figure 17: Levelled apparent resistivity in Ohm-m for 25 kHz derived from HEM inversion method for A8 (left) and
A9 (right) blocks. The white spaces in the grid are where the inversion didn’t return values. ..................... 32
Figure 18: Merge2022 data. The red polygon shows Merge2019B and the blue and pink polygons represent the
latest surveys blocks A8 andA9, as well as block A6, which are to be merged with 2019B. ......................... 33
Figure 19: Merged residual magnetic anomaly (Merge2022) from Merge2019B, A8, A9 and A6 blocks.................... 36
Figure 20: Means of K (%), eTh (ppm) and eU (ppm) for all blocks. .......................................................................... 40
Figure 21: Merged total count radiometric data (cps) from Merge2019B, A8, A9 and A6 blocks. This final merge is
referred to as Merge2022. ........................................................................................................................ 41
Figure 22: Merged Potassium data (%) from Merge2019B, A8, A9 and A6 blocks. This final merge is referred to as
Merge2022............................................................................................................................................... 42
- viii
-
Figure 23: Merged total equivalent Thorium data (eTh in ppm) from Merge2019B, A8, A9 and A6 blocks. This final
            merge is referred to as Merge2022. .......................................................................................................... 43
Figure 24: Merged total equivalent Uranium data (eU in ppm) from Merge2019B, A8, A9 and A6 blocks. This final
            merge is referred to as Merge2022. .......................................................................................................... 44
Figure 25: Merged radiometric Ternary map from Merge2019B, A8, A9 and A6 blocks. This final merge is referred to
            as Merge2022. Potassium - red, Uranium - blue and Thorium – green. ...................................................... 45
Figure 26: Raw resistivity grids obtained from HEM inversion for A8 (a) and A9 (b) blocks for 3 kHz data. Noise
            related to survey direction and the effects of high-fly are obvious in the grids. ......................................... 51
Figure 27: Error grids obtained by combined Butterworth and Directional cosine filters for A8 (a) and A9 (b) blocks
            for 3 kHz. The error grids are sampled into the database and subtracted from the raw HEM model data
            (Figure 26) to obtain the levelled resistivity grids given in Figure 28. ......................................................... 52
Figure 28: Levelled resistivity grids for A8 (left) and A9 (right) blocks for 3 kHz obtained by subtracting the error grid
            (Figure 27) from the original raw HEM model grid (Figure 26). .................................................................. 53
Figure 29: Four-frequency EM Merge2022 (NI, TB, CAV, TNM, A1, A2, A3, A4, A5, A7, A8, A9, WFD and A6): merged
            apparent resistivity for 912 Hz. ................................................................................................................. 54
Figure 30: Four-frequency EM Merge2022 (TB, CAV, TNM, A1, A2, A3, A4, A5, A7, A8, A9, WFD and A6): merged
            apparent resistivity for 3 kHz. ................................................................................................................... 55
Figure 31: Four-frequency EM Merge2022 (TB, CAV, TNM, A1, A2, A3, A4, A5 ,A7, A8, A9, WFD and A6): merged
            apparent resistivity for 12 kHz. ................................................................................................................. 56
Figure 32: Four-frequency EM Merge2022 (TB, CAV, TNM, A1, A2, A3, A4 ,A5, A7, A8, A9, WFD and A6): merged
            apparent resistivity for 25 kHz. ................................................................................................................. 57
Figure 33: Two-frequency EM Merge2022 (NI, TB, CAV, TNM, A1, A2, A3, A4, A5, A7, A8, A9, WFD and A6): merged
            apparent resistivity for 3 kHz. ................................................................................................................... 58
Figure 34: Two-frequency EM Merge2022 (NI, TB, CAV, TNM, A1, A2, A3, A4, A5, A7, A8, A9, WFD and A6): merged
            apparent resistivity for 12 kHz. ................................................................................................................. 59
Figure 35: Survey flight altitudes greater than 150 m above ground level shown in yellow, greater than 250 m shown
            in red and greater than 350 m shown in purple. ........................................................................................ 61

Tables

Table 1: Tellus Survey Blocks showing year of survey and coverage area. The areas include overlap zones and coastal
            areas. ......................................................................................................................................................... 4
Table 2: Flight Pattern.............................................................................................................................................. 4
Table 3: Irish Transverse Mercator Geographic Projection. ....................................................................................... 5
Table 4: Survey Equipment. ..................................................................................................................................... 7
Table 5: Co-ordinates of magnetic base stations used during the A8 and A9 surveys. ................................................ 9
Table 6: Spectrometer Processing Parameters for A8 and A9 blocks. ..................................................................... 11
Table 7: SGL Field Crew. ......................................................................................................................................... 14

                                                                                                                                                                         - ix -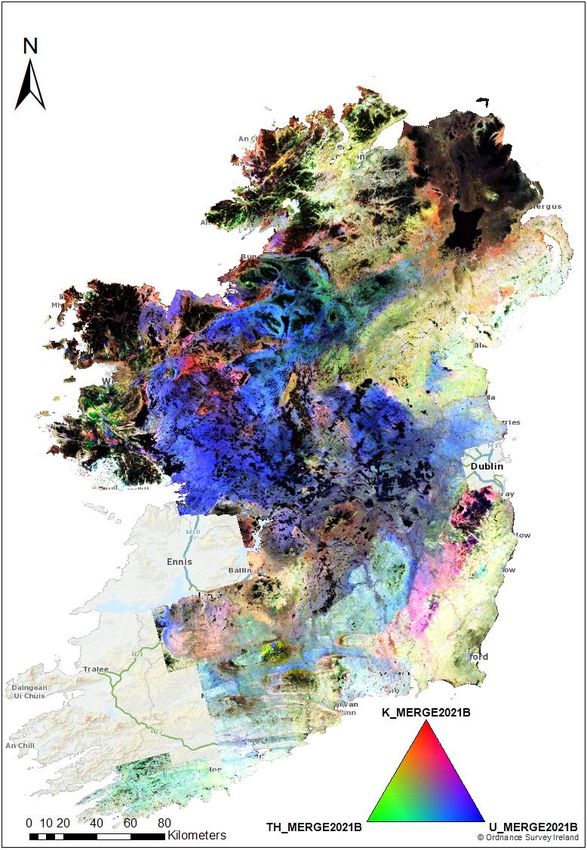
Table 8: GSI Tellus Team. ....................................................................................................................................... 15
Table 9: Survey Operation overview....................................................................................................................... 18
Table 10. Altitude variations for survey block A8. .................................................................................................. 20
Table 11. Altitude variations for survey block A9. .................................................................................................. 20
Table 12: Magnetometer summary statistics for A8 block....................................................................................... 21
Table 13: Magnetometer summary statistics for A9 block....................................................................................... 22
Table 14: Corrected and clipped-to-zero radiometric data summary statistics......................................................... 23
Table 15: Final in-phase, quadrature and apparent resistivity summary statistics for A8 and A9 blocks (traverse lines
            only). ....................................................................................................................................................... 26
Table 16: Mean values of all FEM data. These statistics were calculated from original ppm value without tie lines
            (top)......................................................................................................................................................... 30
Table 17: Summary of ITM co-ordinate system ....................................................................................................... 34
Table 18: Standard Gamma Ray Energy windows for radiometric survey (IAEA 2003). ............................................ 37
Table 19: Energy ranges (channels) used by different Tellus surveys (From 2005-to-date). ROI stands for “Region of
            Interest” in the radiometric spectrum. ...................................................................................................... 37
Table 20: Radiometric correction factors applied to Merge2019B data for data merge with A8 block. .................... 39
Table 21. Radiometric correction factors applied to intermediate Merge2021A data for merge with A9 block. ....... 39
Table 22: Radiometric correction factors applied to intermediate Merge2021B data for merge with A6 block. ....... 39
Table 23: Time domain EM (TEM) and frequency domain EM (FEM) equivalence. ................................................... 47
Table 24: Line naming convention adopted in Merge2022 TELLUS dataset, with range of line numbers contained in
            the published dataset. .............................................................................................................................. 48
Table 25: Correction factors applied in the creation of merged EM dataset Merge2022, based on overlap zones. The
            high correction factor at overlap between Merge2021A and A9 could be due to the large high fly zone
            percentage in A9 block (see Table 11). ...................................................................................................... 49
Table 26: Merge2022: A1, A2, A3, A4, A5, A6, A7, A8, A9, TNM, TB, CAV, NI and WFD magnetic merged data
            channels................................................................................................................................................... 64
Table 27: Merge2022: A1, A2, A3, A4, A5, A6, A7, A8, A9, TNM, TB, CAV, NI and WFD radiometric merged data
            channels................................................................................................................................................... 64
Table 28. Merge2022: A1, A2, A3, A4, A5, A6, A7, A8, A9, TNM, TB, CAV, NI and WFD EM_2F Resistivity data
            channels................................................................................................................................................... 65
Table 29. Merge2022: A1, A2, A3, A4, A5, A6, A7, A8, A9, TNM, TB, CAV and WFD, EM_4F Resistivity data channels.
            ................................................................................................................................................................ 65

                                                                                                                                                                          -x-
1. Tellus Geophysical Surveys
1.1 Overview of Tellus Project and previous surveys
The Tellus survey Blocks A8 and A9 over the south of Ireland follow on from previous airborne surveys carried
out under the Tellus Programme. These surveys include the original Tellus survey of Northern Ireland (2005-
2006) and the EU INTERREG IVA-funded cross border survey of the border region of Ireland (2011-2012), the
Tellus North Midlands survey (2014-2015) along with the survey of Block A1 (2015) in the east of the country
and a survey of county Waterford (2016) in the south of the country and Block A2 over county Galway (2016),
and across counties Mayo and Donegal (Blocks A3 and A4) in 2017, and across County Limerick and West
Cork (Blocks A5 and A6 respectively) in 2018-2019 and A7 block over counties of Wicklow, Wexford, Kildare
and Carlow in 2019 in the SE of Ireland. All airborne surveys comprised the collection of low-altitude
magnetic, gamma-ray spectrometry and electromagnetic data. However, for the North Midlands survey,
Time-Domain Electromagnetic (TEM) data were collected in contrast to Frequency-domain EM (FEM) data
which were collected for the other surveys. Under the latest phase of the Tellus survey, airborne data were
collected over Blocks A8 and A9, using the same aircraft and based at Waterford Airport, which is located
close to the survey area. Following the completion of these latest phases (A8 and A9), approximately 80% of
Republic of Ireland has now been surveyed, excluding Dublin City.
-1-2. A8 and A9 Survey Operations & Specifications
The current survey areas, Blocks A8 and A9, are shown in Figures 1 & 2. Block A8 covers the majority of
Counties Tipperary, Kilkenny, Laois and Waterford. The A9 block was flown over county Cork. Topography
and land-use in the A8 and A9 areas are a mix of low-lying undulating grass farmlands and ranges of
mountainous topography, such as Knockmealdown, Galty and Comeragh. There are also isolated mountains
such Borrinoe, Kildoff, Devilsbit, Lyre and Wolftrap. A9 block includes Rahan, Moyanass and Rathcormack
Mountains in the central part. The highest point in County Kilkenny is Lyre Mountain at 650 m and this lies
just off the south eastern boundary of Block A9. A number of significant rivers (Nore, Barrow and Suir) flow
through the region.
The A8 survey area was designed to allow an overlap with the Tellus A1, A5, A7, WFD and A9 blocks, while
A9 was designed to have overlap with A8, A5 and A6 blocks, which would assist the merging of the data. The
surveys were also designed within the context of a national survey and to complete more than 80% of this
national survey by the end of 2021. The survey blocks discussed in this report are outlined in Figure 2.
Figure 1: Tellus A8 block (left) and A9 block (right) survey areas over southern Ireland.
-2-Figure 2: Tellus survey blocks 2005 – 2021.
-3-Table 1: Tellus Survey Blocks showing year of survey and coverage area. The areas include overlap zones and coastal areas.
BLOCK SURVEY YEAR BLOCK AREA (km2)
NI 2005/2006 16178
CAV 2006 1054
TB 2006, 2011-2012 10773
TNM 2014 5979
A1 2015 6015
A2 2016 7819
WFD 2016 1216
A3 2017 4992
A4 2017 3459
A5 2018 4638
A6 2018 2698
A7 2019 6476
A8 2020 6896
A9 2021 3288
Total airborne covered area 81,481
Total airborne covered area (ROI) 65,303
Total excl. overlap and coastal area 56,496
(ROI)
Percent ROI (onshore ) excl. Dublin 80.3%
2.1 Flight characteristics and survey pattern
The flight pattern is described in Table 2 below.
Table 2: Flight Pattern.
Traverse Line Spacing 200 m
Tie Line Spacing 2000 m
Traverse Line Heading 165/ 3450
Tie-Line Heading 75/ 2550
Flying Height (rural / urban) 60/ 240 m subject to pilot’s discretion
Projection / Datum Irish Transverse Mercator
A repeat test calibration line was established close to the town of Bundoran, Co. Donegal in the northwest
of Ireland. The same test line was flown during the Tellus Border, North Midlands and A1, A2, A3, A4, A5 and
A6 Surveys, allowing comparisons to be made between surveys. The test line is 6 km in length and was flown
at six different elevations during each run. The line ran from off-shore to on-shore and was selected based
on variable bedrock and superficial geological aspects, and is discussed further in Section 3.10.
From 2019 (Blocks A7, A8, A9) onward the Tellus project used a new test calibration line that was established
close to the village of Kill, Co. Waterford in the south of Ireland, about 20 km to SW of Waterford city (see
Figure 6). The test line is located between 646290 m E & 597625 m N and 644865 m E & 602937 m N in the
ITM coordinate system. The Test line is 5.5 km long (with 4.5 km on land and 1 km over the sea).
-4-2.2 Flight permits
The contractor (Sander Geophysics Ltd.) received the required Irish Aviation Authority (IAA) flight permits for
its aircraft C-GSGF to conduct a low-level survey in Ireland.
2.3 Geographic projection
Final data were referenced to the Irish Transverse Mercator as defined in Table 3.
Table 3: Irish Transverse Mercator Geographic Projection.
IRISH TRANSVERSE MERCATOR
Reference Ellipsoid: GRS80
Central Meridian 08° 00’ 00” West
Vertical Datum: Malin Head
Map Projection: Transverse Mercator (Gauss Conformal)
True origin: 53° 30’ 00” North, 08° 00’ 00” West
False origin: 600 km west, 750 km south of true origin
Scale factor on Central Meridian: 0.999820
2.4 Re-flight conditions
Data were received from the contractor on a weekly basis for quality assessment. The following re-flight
conditions were enforced during the survey:
Where flight line deviation for traverse-lines is greater than 45 m from the planned line over a
distance of 2.5 km or more, or greater than 90m from the planned line over any distance (except
where ground conditions dictate otherwise, for example to avoid radio-masts etc.).
Where flight line deviation for tie-lines is greater than 100 m from the planned line over a distance
of 2.5 km or more, or any deviation greater than 200 m from the planned line over any distance.
Where terrain clearance exceeds +/- 20 metres from the nominal survey height for more than 5
continuous kilometres or 40 m of nominal survey height at any time on any line, unless local
topography makes this unavoidable.
Where the nominal survey flying speed (60 m/s) is exceeded by more than 30% (78 m/s) for more
than 5 continuous kilometres.
Where the noise envelope of the magnetic records exceeds 0.1 nT as determined by the normalised
fourth difference.
If, during data acquisition, magnetic variations recorded at the local base magnetometer exceed 12
nT over any 3-minute chord or exceed 2 nT over any 30 second chord, on flight lines or tie lines. The
base magnetometer must be fully operational during all on-line data collection.
Where the average line gamma spectra for any line appears anomalous by comparison with
previously acquired data then the data of that line will be investigated in detail and re-flown if
necessary.
If the calibration of the EM system deviates significantly from the norm.
If both primary and secondary GPS base stations fail to record for 30 minutes or more,
simultaneously.
If both primary and secondary magnetic base stations fail to record for 30 minutes or more,
simultaneously.
-5-These conditions may be exceeded without re-flight where such constraints would breach air safety
regulations, or in the opinion of the pilot, put the aircraft and crew at risk. All such exceptions were logged
and a log of all flights can be found in the technical report produced by SGL (2016, 2017, 2019 and 2021).
Data generally met the required specifications, although some altitude deviations were encountered; these
were often related to client enforced high fly zones due to urban areas, stud farms, radio masts and pilot
safety requirements.
2.5 Survey equipment and aircraft systems
2.5.1 Survey Aircraft
The contractor, Sander Geophysics Ltd., used a De Havilland DHC-6 twin Otter (registration number C-GSGF)
for all survey work. The same aircraft was used in the Tellus survey of Northern Ireland (2005-6), under the
registration OH-KOG. During the Northern Ireland survey, it was operated by JAC (Joint Airborne-geoscience
Capability), which was a partnership between the Geological Survey of Finland and the British Geological
Survey. The aircraft was also used under its current registration for the Tellus Border Survey (2011-2012), A1
and A2 Surveys (2015 & 2016), A3 and A4 surveys (2017), A5 and A6 surveys (2018-2019), A7 survey (2019),
A8 survey (2020-2021) and A9 (2021). This aircraft is an all metal, fixed-wing, twin-engine, short take-off and
landing aircraft (Figure 3). The aircraft can be flown at speeds from 80 to 160 knots (41 to 82 m/s). The Twin
Otter is equipped with airborne magnetic, radiometric and frequency-domain electromagnetic (FEM)
systems as outlined by Hautaniemi et al., 2005. The aircraft houses two magnetometers, one attached to a
rear boom and one in the left wing tip pod. The four frequency EM transmitter was housed in the right wing
tip pod and the receiver in the left wing tip pod. The Gamma Ray spectrometer crystal packs were housed in
the rear of the aircraft (Figure 4) and also in the undercarriage to accommodate additional crystal packs.
The NavDAS system developed by SGL was used for airborne navigation and data acquisition. The system
displays all incoming data on a flat panel screen for real-time monitoring.
Figure 3: Survey Aircraft – De Havilland Twin Otter, C-GSGF.
-6-2.5.2 Geophysical Instrumentation
Table 4 below outlines the survey equipment used by SGL during the project. Further detail of the
instrumentation is given by SGL (2021).
Table 4: Survey Equipment.
Survey Method Equipment used
Magnetometer Aircraft: 2 x Geometrics G-822A, optically pumped Caesium split beam
sensors, tail stinger and wing tip, sampling rate:10 Hz
Base station: 2 x Geometrics G-822A
SGComp, post-flight compensation
EM system SGFEM: Four frequency (0.9, 3, 12 and 25 kHz), sampling 10 Hz. Wingtip
coils
Gamma-ray Radiation Solution RS-501 gamma-ray spectrometer 1024-channels, self-
spectrometer calibrating, 67.2 litres downward, 12.6 litres upward looking, pressure and
temperature sensors, sampling rate 1 Hz.
Altimeter Collins radar altimeter (AL-101), sampling 10 Hz
SGLas-P Riegl laser rangefinder altimeter LD90-3300VHS-FLP, 20 Hz
sampling rate
Honeywell Barometric Pressure sensor, 10 Hz sampling rate
Omega RTD-805 Outside air temperature probe
GPS SGRef system, DGPS receiver (10 Hz)
NovAtel Millenium 12 channel dual frequency
Video SGDIS – Digital imaging system (avi format)
Data location system
Post-process DGPS based on NovAtel OEM-V receivers in aircraft and at
base.
Data transfer medium Solid state hard drives and FTP
Magnetometers
Geometrics G-822A and optically pumped Caesium-split beam magnetometers, were used for both ground
and aircraft sensors respectively. The Caesium magnetometers were housed on the left wing pod and within
a rear tail stinger. The two base station magnetometers were located close to the field base. All
magnetometers had a sensitivity of 0.005 nT and range of 20,000 to 100,000 nT with a sensor noise less than
0.02 nT. Measurements were delivered at 10 Hz intervals.
Spectrometers
The Gamma Ray spectrometer system used was Radiation Solutions RS-501 with Crystal Detector packs
RS5557, RS5558, RS5444, RS5632, with 1024 channels. The system used 16 x 4.2 litre downward looking and
3 x 4.2 litre upwards looking NaI crystals of total volume of 67.2 and 12.6 litres respectively. Data were
collected at a sampling rate of 1 second in 1024 channel spectral mode. The system was calibrated at the
Geological Survey of Canada’s test range at Breckenridge, Quebec, along with a ground calibration pad test
in Ottawa, Canada before departure to Ireland. Hand sample checks were run on the gamma ray
-7-spectrometer before or after each day’s flying to check spectral stability and system sensitivity. Relative count
rates were measured to achieve background rates that were within two standard deviations of the average
sample checks for the survey.
Frequency-domain electromagnetic system
The SGFEM system used four frequencies, 912, 3005, 11962 and 24510 Hz with a transmitter-receiver coil
separation of 21.4 m. The transmitter-receiver coil pairs were mounted in a vertical-coplanar orientation
which helped reduce noise by minimising coupling with the wingtip surface. A 50/60 Hz power line monitor
was also employed to help identify cultural interference related to power lines. Data was sampled at 40 Hz
and later decimated to 10 Hz by the contractor during processing of the data.
Figure 4: Radiation Solutions spectrometer housed in the aircraft.
2.5.3 Altimeter system
Four types of altimeter were employed on the aircraft. These were:
SGLas-P – Riegl LD90-3300VHS-FLP Laser Rangefinder: This laser altimeter has a range of 338 m and
a resolution of 0.01 m with an accuracy of 5 cm and a sample rate of 20 Hz data rate later decimated
to 10 Hz.
Collins AL-101 Radar Altimeter: This radar altimeter has a resolution of 0.5 m, an accuracy of 5%, a
range of 0 to 408 m and was sampled at 10 Hz.
Honeywell Barometric Pressure Sensor: Measures static pressure to an accuracy of ± 4 m with a
resolution of up to 2 m over range of 0 to 9,144 m above sea level. Barometric pressure is sampled
at 10 Hz.
Omega RTD-805 Outside Air-temperature probe: Sampled at 10Hz with a resolution of 0.1 0C with a
range of +/- 100 0C and an accuracy of ± 0.20C.
2.5.4 Magnetic Base Station
Two reference stations were installed for A8 and A9 surveys. GND1 was located at the airport south of the
CHC hangar behind the fuel farm and GND2 was located at a farm just north of Dunmore East, County
Wexford.
-8-The Geometrics G-822A magnetometers were used to measure the daily diurnal variation during the survey.
The co-ordinates for the base stations are shown in table 5 below:
Table 5: Co-ordinates of magnetic base stations used during the A8 and A9 surveys.
Station Easting Northing Projection Elevation
GND1 W07°04'47.2” N52°11'23.5'' WGS84 83.7 m
GND2 W07°00'39.5'' N52°09'21.0'' WGS84 107.6 m
GND1 662919.94 604622.03 ITM 83.7 m
GND2 667680.34 600901.64 ITM 107.6 107.6m
-9-3. Start-up Calibrations & Mobilisation
3.1 Calibrations Introduction
The airborne geophysical equipment system calibrations and tests prior to mobilization were carried out in
Ottawa, Canada, as well as at the Geological Survey of Canada’s Breckenridge Calibration Range in Quebec;
further calibrations were also conducted on site in Ireland. The details of all these tests were reported by SGL
and are also outlined in the SGL Technical Report TR-888-000 (2021). The main calibrations, which were
carried out as part of the survey, are summarized below.
3.2 Magnetic Compensation
Compensation calibrations determine the magnetic influence of aircraft and its maneuvers. During the
compensation calibration flight, the aircraft performs sets of three pitches (+/-5º), rolls (+/-10º), and yaws
(+/-5º), while flying in the four flight line directions at high altitude over a magnetically quiet area. The
coefficients calculated from the calibration are applied to the acquired magnetometer data to measure the
effectiveness of the compensation system in mitigating the aircraft’s magnetic interference.
The total compensated signal noise resulting from the twelve maneuvers, referred to as the Figure of Merit
(FOM), is calculated from the maximum peak-to-peak value resulting from each maneuver. A compensation
calibration was performed on June 9 2020 for the tail magnetometer before the aircraft left Ottawa and
recorded a Figure of Merit (FOM) value of 0.73 nT, within the required specifications. A compensation test
flight was also performed in Ireland on 9 October 2020. The FOM for this test flight was 1.07 nT, within
specification.
3.3 Heading Error Determination
A heading test was performed over the Morewood test site in Ontario, Canada on June 16, 2020 before the
aircraft ferried to Ireland. The heading test flight lines were pre-planned, and reference ground magnetic
data were obtained through the use of the SGL head office reference station. The test determined an average
north-south heading error of 0.83 nT and an average east-west heading error of 1.45 nT for the tail
magnetometer. The heading error remains consistent through the duration of the survey, and is fully
corrected in the normal airborne magnetic data during processing.
3.4 Lag and Parallax Test
The lag in the magnetic data is a function of two components, a static lag due to signal processing and a
speed-dependent dynamic lag due to the physical offset of the magnetometer and the GPS antenna. Both
elements of the lag are well-known. The static lag is known to be 0.244 s from the filters applied during signal
processing. The dynamic lag is equal to the offset of the GPS sensor (located on the aircraft tail for this survey)
to the tail magnetometer as measured along the long axis of the aircraft, known to be 4.27 m, divided by the
flying speed. For a speed of 60 m/s the dynamic tail magnetometer lag will average 0.071 s, for a total lag of
0.32 s.
- 10 -3.5 Radiometric Calibrations
The stripping ratios for the gamma-ray spectrometer were determined on July 7-8, 2020 before the aircraft
departed Ottawa. The Geological Survey of Canada (GSC) calibration pads, which are stored at the SGL hangar
in Ottawa, were used. The tests were performed with the detectors installed in survey configuration on board
the aircraft. Each detector was tested separately and the test results were averaged to create stripping ratios
for this system. Full details of these tests were reported by SGL, are contained in SGL technical Report 2021
and summarized in Table 5. Calibrations are carried out based on guidelines set out in IAEA (2003) and Grasty
and Minty (1995).
Table 6: Spectrometer Processing Parameters for A8 and A9 blocks.
Spectrometer Processing Parameters – Spectrometer Radiation Solutions Model RS-501
NaI (Tl) crystals 67.2 L, Down, 12.6 L Up. At 60 m survey altitude.
Window Cosmic Stripping Ratio (b) Aircraft Background (a)
Total 1.2728 10.0000
Potassium 0.0650 19.2299
Uranium 0.0420 0.0000
Thorium 0.0491 0.0000
Upward 0.0072 0.0000
Radon Correction Radon Ratio (a) (b)
Total (Ir) 15.4608 0.0000
Potassium 0.7635 0.0000
Thorium(Tr) 0.0707 0.0000
Upward Uranium(Ur) 0.2100 0.0000
Ground component a1 a2
Up (ug) 0.032891 0.024257
Stripping Ratios Contribution on the ground Effective height adjustment
α 0.2782 0.00049
β 0.4183 0.00065
γ 0.7820 0.00069
a 0.0453 0
b 0.0000 0
g 0.0032 0
Attenuation Coefficients
Total -0.006849
Potassium -0.007700
Uranium -0.007337
Thorium -0.006036
Sensitivities at 60m
Total Count
Potassium 228.93 cps/%
Uranium 23.79 cps/eU ppm
Thorium 12.31 cps/eTh ppm
- 11 -3.6 EM System Orthogonality
Prior to each flight, the phase shift between the in-phase and quadrature parts of the EM response is verified
and adjusted if required. For each frequency, two pulses of constant amplitude are artificially generated, the
first being perfectly in-phase with the primary field, and the second being phase shifted by 90 degrees.
Therefore, when the phase orthogonality is properly adjusted, no quadrature response should be observed
during the first pulse, and vice versa during the second. This test is usually performed above 300 m flight-
height to avoid any EM response from the ground and to minimize cultural interference. The compensation
of the primary field is verified, enabling EM data to be recorded with reference to an arbitrary zero-level low
enough to ensure that the full range of the receiving device can be utilized. This ensures the system is
functioning properly. The orthogonality check is also performed following each production flight, while
ferrying back to the base.
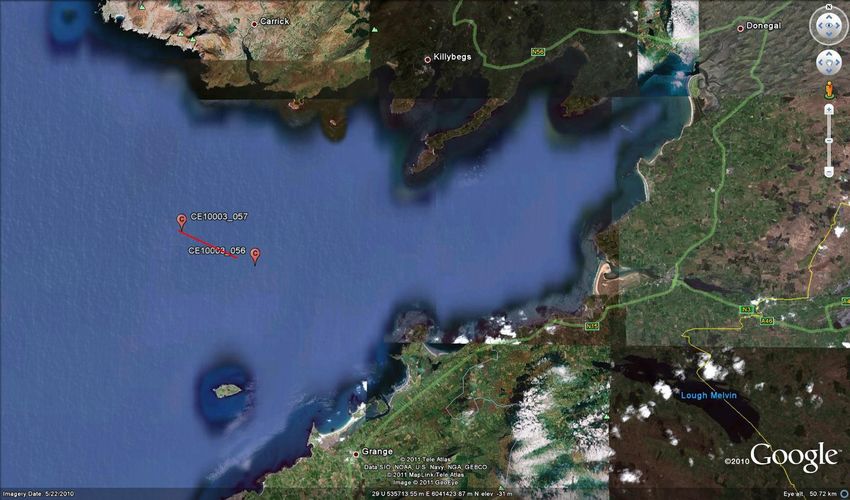
3.7 EM Over-Seawater Calibration
The frequency domain electromagnetic system was calibrated following procedures described by Hautaniemi
et al. (2005). Starting from the Tellus Northern Ireland survey in 2005 and up to the A5 & A6 survey blocks in
2018-2019, a test site was chosen over Donegal Bay, in an area where water conductivity and temperature
have been measured several times over the years, at every meter from surface to sea floor, by the Irish
Marine Institute. The water depth reaches over 60 m, ensuring that the bottom sediments do not contribute
to the EM response. Conductivity data from two different stations taken from three different years were
analysed, showing conductivity profiles to be essentially consistent at the two stations, and therefore data
can be considered constant between the stations. The calibration line location (in red) and the two marine
sampling stations (CE10003_056 and CE10003_057) are shown in Figure 5.
Figure 5: Location of overwater calibration line Over Donegal bay and marine sampling locations (2005-
2018).
- 12 -However, from 2019 (Block A7) onward the Tellus project used a new test site just south of Waterford (see
Figure 6). Sea-surface salinity at the Waterford site, as provided by the Irish Marine Atlas, is within 0.1 g/l of
the Donegal site (as measured in April, 2017), hence this new test site will have very similar resistivity and
thermal characteristics to the Donegal Bay location outlined above. The Waterford test line includes an on-
land portion to replace the “Bundoran” test line, as well as an over-sea-water portion for the EM calibration
test. The central test line is simply extended over sea water and flown at multiple altitudes. The land and
shallow portions of the test line are omitted when tabulating the calibration test results. The yellow box in
Figure 6 outlines the data used in the over sea water test portion. The skin depths of all four frequencies are
less than half the water depth so the sea-floor bottom has no impact and the homogenous half space model
is valid. The water depth in the seawater test portion is greater than 22.5 m, for which a typical sea-floor
bottom resistivity of 1.0 ohm-m would make less than 0.1% difference in the low-frequency in-phase
amplitude, relative to deeper water.
Surface water temperature measured on the same day the calibration flight took place (14.209 ºC, measured
at buoy M5 located approximately 65 km south east of the Waterford test line (51.6900ºN, 06.7040ºW) on
October 11, 2020 as published by the Irish Marine Institute) enabled the estimation of the water conductivity
close to surface ([0.089 S/m ºC * 14.209 ºC] + 2.915 S/m = 4.179 S/m). Based on the average conductivity
decrease with depth observed over the three years in Donegal Bay, it was possible to estimate the water
conductivity at a depth of 30m ([-0.0025 S/m2 * 30 m] + 4.179 S/m = 4.105 S/m), and the average conductivity
between the surface and a depth of 30 m at the calibration site (4.142 S/m). Slight changes in conductivity
below 30 m are negligible. This conductivity was used to create a single layer model (half-space), which was
employed to calculate the EM response for each component of each frequency, for the range of altitudes
covered during the calibration flight. The calculation was performed with the software Airbeo, developed by
AMIRA.
Figure 6. Waterford land/seawater test line location (red line, deep sea section indicated by yellow box).
- 13 -3.8 Altimeter Calibration
The altimeter calibration test is carried out to ensure proper functioning of the aircraft altimeters. This is
done by flying over a flat surface (runway or water body) at a series of different elevations. A correlation
coefficient can then be calculated with values greater than 0.97 indicating an accurate calibration result. This
test was performed on June 9, 2020 at the Gatineau Airport, Gatineau, QC. Five passes were conducted over
the runway at heights from 40 to 120 m above ground at various levels. The altimeter values were compared
to the post-flight differentially corrected GPS altitude information for calibration. An ideal altimeter would
yield a slope of 1 and an intercept of 0. The Collins radar altimeter slope was 0.9990 and the intercept -0.6215
m. The laser altimeter slope was 1.0020 and the intercept was 0.1228 m. These results are within the
expected accuracy of the altimeters
3.9 Mobilisation
The contractor SGL survey aircraft arrived at Waterford airport for the A8 and A9 surveys on 23rd August 2020
and the crew continue 14 days of self-isolation due to Covid19. The first production flight for A8 was
undertaken on 20/08/2020 and completed on 15/07/2021. A total of 96 flights were flown over A8 block.
The A9 survey was continued immediately at the completion of A8 block. The first production flight for A9
block was commenced on 25/07/2021 and the final flight completed on 21/09/2021. Remobilisation of the
field crew was delayed in 2021 again due to the effects of Covid-19. A total of 46 flights were flown over A9
block. The aircraft demobilized in the last week of September 2021.
3.10 Test Line
As part of on-going calibration testing and to help with the integration of different datasets collected during
different seasonal conditions, a test line was developed (2011-2019) at Donegal Bay. However, a new test
line was established in 2019 just south of Waterford, with the first test flown on 22nd April 2019 for A7 block.
The same test line (Figure 6) was flown in 2020 and 2021 for A8 and A9 blocks. This new test calibration line
was established close to the Village of Kill, Co. Waterford in the south of Ireland about 20 km to SW of
Waterford city (see Figure 6). The test line is located between 646290 m E & 597625 m N and 644865 m E
&, 602937 m N in ITM coordinate system. The Test line is 5.5 km long (4.5 km on land, 1 km over the sea).
3.11 Personnel
Members from both SGL and the Tellus team were involved in the airborne geophysics operations, the
main personnel are listed below in Table 7 and 8.
Table 7: SGL Field Crew.
Personnel Name Dates on field
Operations Manager Kevin Charles n/a
Field Crew Chief Alison McCleary June 15, 2019 – September 15, 2019
Data Processor Angella Farr October 12, 2020 – December 14, 2020
Technician Mike Nguyen August 20, 2020 – October 15, 2020
Technician Lee Duncan March 16, 2021 – June 11, 2021
- 14 -Technician Zachary Seguin-Forest June 9, 2021 – July 16, 2021
Lead Pilot Steve Gebhardt August 21, 2020 – end of project
Pilot Charles Dicks August 21, 2020 – November 19, 2020
Pilot Charles Dicks April 14, 2021 – end of project
Pilot Steven Hyde August 23, 2020 – December 14, 2020
Pilot Steven Hyde June 27, 2021 – end of project
Pilot Jean Deschenes May 18, 2021 – July 4, 2021
Pilot Jeff Tucker July 12, 2021 – end of project
AME Dwayne Bailey August 21, 2020 – December 5, 2020
AME Dwayne Bailey April 17, 2021 – end of project
Table 8: GSI Tellus Team.
Field Personnel Name
Head of Programme / GSI Principal Ray Scanlon
Geologist
Project Manager Dr. James Hodgson
Geophysicist Mohammednur Desissa Ture
Geophysicist Dr. Mark Muller
Communications Manager Emma Scanlon
- 15 -4.Outreach Programme
4.1 Tellus Public Relations
Due to the low flying nature of the survey (nominal survey altitude of 60 m), the distribution of population
centres and land use within the survey area, an extensive outreach programme was undertaken. This
comprised a comprehensive information campaign including meeting with local stakeholders, interviews on
local radio, articles in both national and local newspapers and social media updates. Approximately 172,400
and 160,900 information fliers were posted to land owners within the A8 and A9 survey areas respectively
(Emma Scanlon, Pers. com.). State agencies including County Councils, An Garda Síochána and Local
Authorities were also contacted and regularly updated on the progress of the survey. Of particular
significance was the bloodstock sector with notifications given through the Weatherby’s Organisation
(thoroughbred horse registrations) and the Irish Thoroughbred Breeders Association. Progress updates and
a weekly flight plan was also posted on the Tellus website: www.gsi.ie/tellus.
As part of this outreach programme a web-based, data management software program was used which has
been developed internally within the Department. This software, called the Tellus Communications Viewer
(TCV), was used to log all enquiries and record all communications with landowners and different
stakeholders. Following the outreach programme, any land owners, particularly livestock owners, who
required notification of the survey in their area were contacted and their land holding digitised within the
TCV. The TCV could then be used to determine which flight lines intersected which landholdings and which
people might be affected by the flight. Before each flight, a Tellus team member would contact the SGL party
chief and identify any land owners who required notification. These people where then contacted, and their
responses logged. This allowed stock to be moved or in some cases, a high fly zone (214 m / 700 ft) to be
flown above these properties.
High fly zones were also introduced over urban areas (populations greater than 2500) as required under the
permit. During survey activities, an “on-call rota” was established to make sure that there was a team
member on duty at all times seven-days a week, to deal with urgent enquiries relating to the airborne survey.
A free-phone information line (1800 45 55 65) was in operation and was managed by PR company RPS
Communications in order to take enquiries about the airborne survey. While the survey was operational, the
line was manned during office hours by RPS and out of hours by the Tellus communications representative
on call. All calls if required were logged in the TCV managed by the communication and project manager.
- 16 -5. Quality Assessment
5.1 QA/QC
During the survey operation, data were supplied to the Tellus geophysicists via FTP from SGL on a weekly
basis. The data were checked to determine whether it conformed to the required specifications/re-flight
requirements as outlined in Section 2.4. The following checks were carried out on all data:
Terrain clearance and altitude deviations
Flight line accuracy
Magnetometer noise
Ground speed
Magnetic base station – diurnal variations
Magnetic noise – Fourth difference/noise
Gamma ray stability
EM - noise level, conformity and orthogonality
Weekly QC reports were filed and discussed with the SGL party chief and any required re-flights scheduled
into the new flight plan. The weekly QC reports have been collated and can be found as an internal GSI
document. Overall, technical specifications were adhered to by the contractor. High altitude deviations,
mainly the result of the severe topography in the west, along with induced high fly zones due to urban areas
or sensitive livestock areas, were a constant issue.
- 17 -6. Survey Outputs & Statistics
6.1 Survey Production
The survey consisted of a total of 38,410 and 18,040 km for blocks A8 and A9 respectively. These blocks have
been merged with previous survey data. There were 459/59 and 232/39 (traverse/tie lines) for A8 and A9
blocks respectively. A full list of all flight logs and a flight line summary is contained within the SGL Technical
Reports (SGL, TR-888-000, 2021).
Table 9: Survey Operation overview.
Airborne Survey Contractor Sander Geophysics Ltd.
Survey Aircraft: De-Havilland DHC-6 Twin Otter (C-GSGF)
Survey Base: Waterford Airport
Aircraft arrival: 23rd August 2020 (Waterford Airport)
Flying dates: 20/08/2020 and completed on 15/07/2021 (A8)
25/07/2021 and completed on 21/09/2021 (A9)
Total no of Flights 96 (A8) and 46 (A9) flights.
Productions, re-flights and test flights):
Date of demobilisation: Last week of September 2021
Total Production km’s flown: (38,410)+(18,040)=56,450 km
The airborne survey operated 7 days a week over 23 production weeks for A8 block. The first four weeks
were preparation weeks and 21 weeks were associated with a winter break from December 2020 to April
2021. The weather provided the main challenge for airborne operations throughout acquisition in the A8 and
A9 blocks. The effect of Covid19 also hindered mobilization and demobilization. Rain, poor visibility and
windy days caused various delays and aborted flights.
It is seen that week 6 (20/09/2020-27/09/2020) and week 44 (16/06/2021-20/06/2021) delivered the largest
line-km per week in the A8 survey (3596 and 3852 km respectively). During A9 survey the largest weekly line-
km was recorded in week 6 (23/08/2021-29/08/2021), which was 3442 km.
- 18 -You can also read