Braintree District Council Chelmsford City Council Colchester Borough Council Tendring District Council Objectively Assessed Housing Need Study - NET
←
→
Page content transcription
If your browser does not render page correctly, please read the page content below

Braintree District Council
Chelmsford City Council
Colchester Borough Council
Tendring District Council

Objectively Assessed Housing Need Study

Peter Brett Associates
July 2015

Office Address:

16 Brewhouse Yard, Clerkenwell, London EC1V 4LJ
T: +44 (0)207 566 8600 E: london@peterbrett.com
Project Ref 33171

Minor revisions to paragraph 7.18 – 7.22 (24/07/2015)

Peter Brett Associates LLP disclaims any responsibility to the client and others in respect of any
matters outside the scope of this report. This report has been prepared with reasonable skill, care and
diligence within the terms of the contract with the client and taking account of the manpower,
resources, investigations and testing devoted to it by agreement with the client. This report has been
prepared for the client and Peter Brett Associates LLP accepts no responsibility of whatsoever nature
to third parties to whom this report or any part thereof is made known. Any such party relies upon the
report at their own risk.
© Peter Brett Associates LLP 2015

THIS REPORT IS FORMATTED FOR DOUBLE-SIDED PRINTING.
.

                                                                                                      ii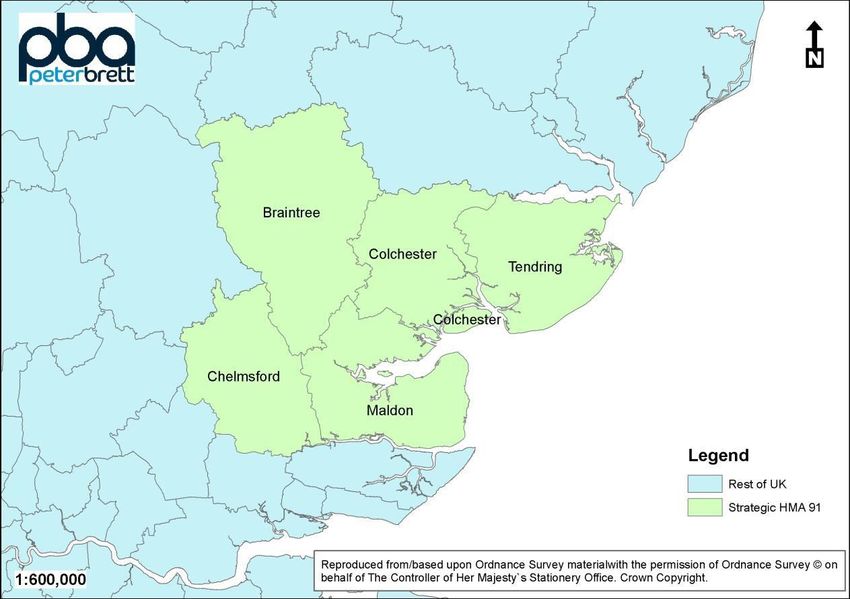
Objectively Assessed Housing Need Study

CONTENTS
1     INTRODUCTION .......................................................................................................... 1

2     DEFINING THE HOUSING MARKET AREA ............................................................... 3
      Overview ...................................................................................................................... 3
      The NHPAU geography ................................................................................................ 3
      Migration ...................................................................................................................... 4
      Commuting ..................................................................................................................10
      Maldon – migration and commuting .............................................................................14
      House prices ...............................................................................................................16
      Conclusions.................................................................................................................17

3     THE OFFICIAL HOUSEHOLD PROJECTIONS ..........................................................18
      Introduction .................................................................................................................18
      Recent releases ..........................................................................................................18
      The 2012-based projections ........................................................................................19

4     ALTERNATIVE DEMOGRAPHIC SCENARIOS .........................................................21
      Introduction .................................................................................................................21
      Fixed vs non-fixed migration profiles ...........................................................................21
      Unattributable Population Change ...............................................................................22
      Alternative base periods ..............................................................................................26
      Conclusions.................................................................................................................29

5     LONDON’S HOUSING NEED .....................................................................................30
      The GLA demographic scenario ..................................................................................30
      Impact on the HMA......................................................................................................32
      Conclusions.................................................................................................................33

6     FUTURE EMPLOYMENT............................................................................................34
      Introduction .................................................................................................................34
      The Experian forecast .................................................................................................39
      Conclusions.................................................................................................................41

7     PAST PROVISION AND MARKET SIGNALS ............................................................43
      Introduction .................................................................................................................43
      The HMA .....................................................................................................................43
      House prices ...............................................................................................................45
      Affordability .................................................................................................................46
      Overcrowding and concealed households ...................................................................49

July 2015                                                                                                                            iii
Objectively Assessed Housing Need Study

        Summary.....................................................................................................................50
        Braintree .....................................................................................................................51
        Chelmsford ..................................................................................................................54
        Colchester ...................................................................................................................57
        Tendring ......................................................................................................................60
        Conclusions.................................................................................................................63

8       AFFORDABLE HOUSING ..........................................................................................64
        National guidance .......................................................................................................64

9       CONCLUSIONS ..........................................................................................................66
        The housing market area.............................................................................................66
        The demographic starting point ...................................................................................66
        Adjustments ................................................................................................................67
        Alternative distributions ...............................................................................................68
        Policy implications .......................................................................................................69

TABLES
Table 2.1 Migration containment, strategic HMA, 2010-11, persons ...................................... 8
Table 2.2 Overall migration containment for alternative areas ..............................................10
Table 2.3 Overall commuting containment, strategic HMA, 2011 ..........................................13
Table 2.4 Commuting - overall containment .........................................................................14
Table 2.5 House price changes, Essex districts, 2002-12....................................................17
Table 3.1 Population, households and dwellings, 2013-37, ONS/CLG 2012.........................19
Table 3.2 Components of population change, 2013-37, ONS/CLG 2012 ..............................19
Table 4.1 Alternative scenarios, change p.a. 2013-37, Braintree ..........................................27
Table 4.2 Alternative scenarios, change p.a. 2013-37, Chelmsford ......................................27
Table 4.3 Alternative scenarios, change p.a. 2013-37, Colchester .......................................27
Table 4.4 Alternative scenarios, change p.a. 2013-37, Tendring ..........................................28
Table 4.5 Alternative scenarios, change p.a. 2013-37, total HMA .........................................29
Table 5.1 SNPP 2012 & GLA Central Scenario compared ...................................................32
Table 6.1 Job growth, 2013-37, Edge Analytics ....................................................................36
Table 6.2 Net new dwellings p.a. 2013-37, SNPP 2012 and Edge Analytics Employed
People scenario....................................................................................................................37
Table 6.3 Population 2011-31: EEFM and SNPP 2012.........................................................38
Table 6.4 Economic activity rate % .......................................................................................39
Table 6.5 Unemployment rate % ..........................................................................................39
Table 6.6 Jobs 2011-31: Experian and EEFM ......................................................................40
Table 7.1 – Mean house prices ............................................................................................45

July 2015                                                                                                                             iv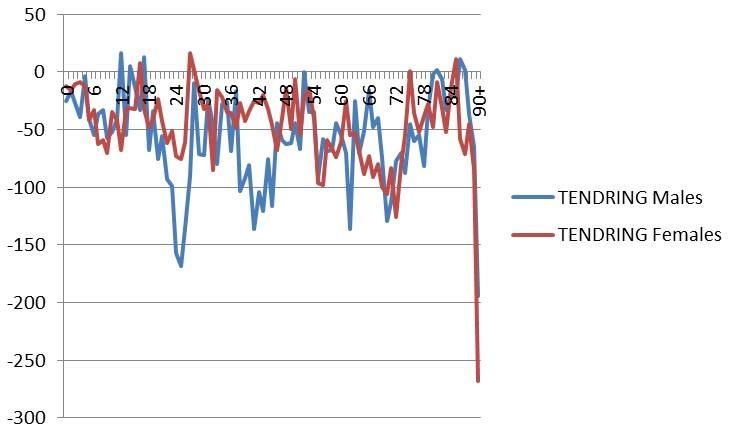
Objectively Assessed Housing Need Study

Table 9.1 Population, households and dwellings, 2013-37, ONS/CLG 2012.........................66
Table 9.2 Objectively assessed housing need, 2013-37 per annum .....................................68
Table 9.3 Alternative distribution ..........................................................................................69
Table 9.4 Further alternative ................................................................................................69
Table 9.5 Housing targets – suggested ranges ....................................................................70

FIGURES
Figure 1-1 Study overview ..................................................................................................... 1
Figure 2-1 The NHPAU strategic HMA .................................................................................. 4
Figure 2-2 Cross-boundary migration to and from Braintree, 2010-11, persons ..................... 5
Figure 2-3 Cross-boundary migration to and from Chelmsford, 2010-11, persons ................. 5
Figure 2-4 Cross-boundary migration to / from Colchester, 2010-11, persons ....................... 6
Figure 2-5 Cross-boundary migration to and from Tendring, 2010-11, persons ..................... 6
Figure 2-6 Cross-boundary migration to and from Maldon, 2010-11, persons ....................... 7
Figure 2-7 Main gross migration outflows from the strategic HMA, 2010-11, persons............ 9
Figure 2-8 Main gross migration inflows into the strategic HMA, 2010-11, persons ............... 9
Figure 2-9 Cross-boundary commuting to and from Braintree, 2011, persons ......................10
Figure 2-10 Cross-boundary commuting to and from Chelmsford, 2011, persons ................11
Figure 2-11 Cross-boundary commuting to and from Colchester, 2011, persons..................11
Figure 2-12 Cross-boundary commuting to and from Tendring, 2011, persons ....................12
Figure 2-13 Cross-boundary commuting to and from Maldon, 2011, persons .......................12
Figure 2-14 Commuting – overall containment .....................................................................15
Figure 2-15 Migration – overall containment .........................................................................15
Figure 2-16 House prices, February 2015 ............................................................................16
Figure 4-1Colchester estimate of UPC by age ......................................................................25
Figure 4-2 Tendring estimate of UPC by age ........................................................................26
Figure 5-1 Net migration with Greater London, GLA Central Scenario ..................................31
Figure 5-2 Net migration from London to the East of England, thousands ............................32
Figure 6-1 Main relationships between variables in the EEFM Model ...................................35
Figure 7-1 Housing completions in the HMA indexed 2001=100 ..........................................43
Figure 7-2 HMA Completions compared to targets ...............................................................44
Figure 7-3 England housing starts and completions .............................................................45
Figure 7-4 House price change (indexed) .............................................................................46
Figure 7-5 Housing affordability ............................................................................................47
Figure 7-6 Market rents ........................................................................................................49
Figure 7-7 Overcrowding and under-occupation ...................................................................50
Figure 7-8 Braintree housing completions ............................................................................52
Figure 7-9 Braintree house prices indexed ...........................................................................53

July 2015                                                                                                                       v
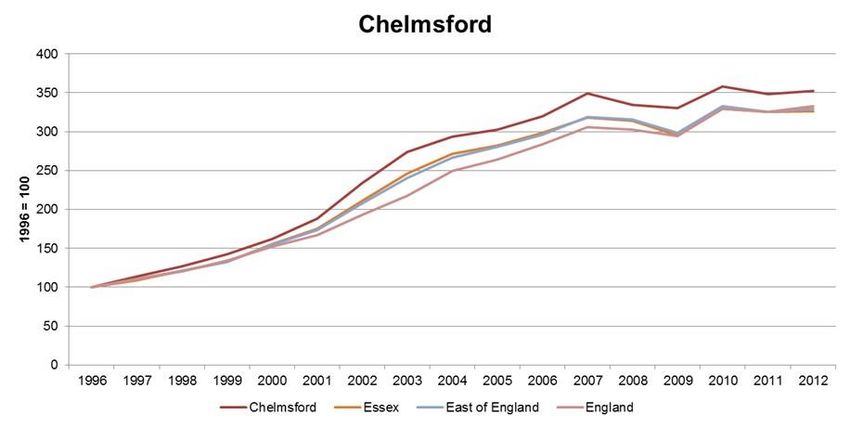
Objectively Assessed Housing Need Study

Figure 7-10 Braintree affordability ........................................................................................53
Figure 7-11 Chelmsford housing completions.......................................................................55
Figure 7-12 Chelmsford house prices (indexed) ...................................................................56
Figure 7-13 Chelmsford affordability .....................................................................................57
Figure 7-14 Colchester housing completions ........................................................................58
Figure 7-15 Colchester house price (indexed) ......................................................................59
Figure 7-16 Colchester affordability ......................................................................................60
Figure 7-17 Tendring housing completions ...........................................................................61
Figure 7-18 Tendring house price change (indexed) ............................................................62
Figure 7-19 Tendring affordability .........................................................................................62

July 2015                                                                                                                  vi
Objectively Assessed Housing Need Study

1       INTRODUCTION
1.1     This study was commissioned by Braintree, Chelmsford, Colchester and Tendring
        Councils to provide an objective assessment of housing need over the period 2013 -
        37. The assessment will help inform targets in future Local Plans, as required by
        national policy and guidance. The chart below summarises our approach.
        Figure 1-1 Study overview
        THIS REPORT
        Chapter 1          INTRODUCTION

                            DEFINE HOUSING MARKET AREA
        Chapter 2

                                                                    Area profile

        Chapter 3           CLG 2012-based household projections

                                                                    ADJUSTMENTS TO PROJECTIONS

                                                                    Alternative demographic scenarios
        Chapter 4

                                                                   London's housing need
        Chapter 5

        Chapter 6                                                   Future employment

                                                                    Past provision & market signals
        Chapter 7

        Chapter 9          OBJECTIVELY ASSESSED NEED

        COUNCILS'                                                  POLICY AND SUPPLY FACTORS
        DECISIONS

                                                                   Cross-boundary unmet need

        Chapter 8                                                  Affordable housing need

                                                                   Supply capacity

                                                                   Authorities' policy objectives

                            HOUSING PROVISION TARGET

July 2015                                                                                               1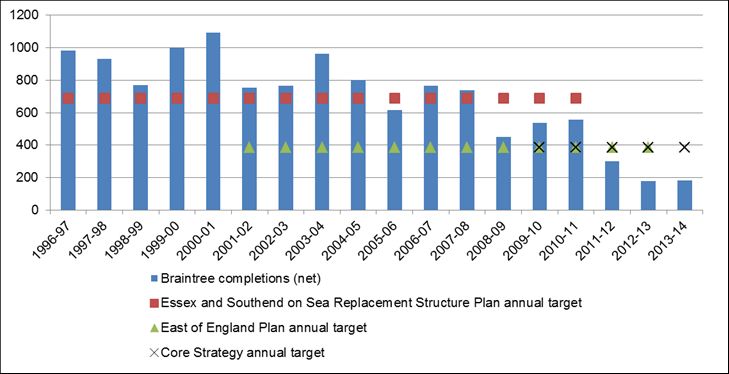
Objectively Assessed Housing Need Study

1.2     The National Planning Policy Framework (NPPF) and Planning Practice Guidance
        (PPG) advise that, where housing market areas (HMAs) extend beyond
        administrative boundaries, housing needs assessments should cover these wider
        areas rather than individual local authorities. Therefore our first step, in Chapter 2
        below, is to test whether the four authorities that commissioned the study form an
        HMA. We find that this is indeed the case and go on to assess the area’s housing
        need, following the method set out in the PPG. This method starts from the latest
        official household projections and applies a series of tests and adjustments to arrive
        at the objectively assessed housing need (OAN).
1.3     Also in line with the NPPF, that assessed need should form the basis of housing
        provision targets in the four authorities’ emerging plans. But in setting those targets
        the Councils should also have regard to other considerations. Targets could be below
        the OAN if it is demonstrated that the area does not have the sustainable capacity to
        meet its need in full. Alternatively targets could be set above the OAN in order to
        meet cross-boundary need from more constrained areas, provide more affordable
        housing or promote other policy objectives. These additional considerations are
        beyond the scope of the present study

July 2015                                                                                        2
Objectively Assessed Housing Need Study

2       DEFINING THE HOUSING MARKET AREA
        Overview
2.1     As mentioned earlier, where a housing market area (HMA) extends across two or
        more local authorities those authorities are required to work together to assess needs
        across the area as a whole. The underlying idea is that much of the demand or need
        for housing is not tied to specific local authority areas, as people’s decisions on where
        to live are driven by access to jobs, schools, family etc, rather than administrative
        boundaries. An HMA is an area of search, bringing together places which share
        similar household characteristics.
2.2     To help identify such areas, the PPG suggests a list of indicators including house
        prices, migration, travel-to-work areas and school and retail catchments. The
        guidance does not prescribe how these indicators should be analysed, except for
        migration – where it says that a high proportion of house moves, ‘typically 70%’,
        excluding long-distance moves, should be contained within the area. Travel-to-work
        areas, also mentioned in the PPG and defined by ONS, are also based on the idea of
        containment – in this case relating to commuting rather than migration.
2.3     To identify HMA boundaries in this study we start from the national geography of
        housing market areas developed for the NHPAU (National Housing and Planning
        Advisory Unit). We then verify and update that geography, using the latest data
        available and the key indicators recommended in the PPG.

        The NHPAU geography
2.4     This HMA geography was produced in 2010 for the former NHPAU by a group of
        academics, using data from the 2001 Census. Following the same logic as the PPG,
        the NHPAU research defines a hierarchy of HMAs based primarily on migration and
        commuting containment. It is a useful starting point because it is a national top-down
        geography, which maximises containment across England as a whole. This is a
        sound approach, because if each local authority were to define its own HMA, centred
        on its own area, there would be nearly as many HMAs as local authorities and HMAs
        would hugely overlap.
2.5     As shown on Figure 2-1, the NHPAU geography brings together into one strategic
        market area the four authorities that commissioned this study. But the area also
        includes a fifth district, Maldon.

July 2015                                                                                      3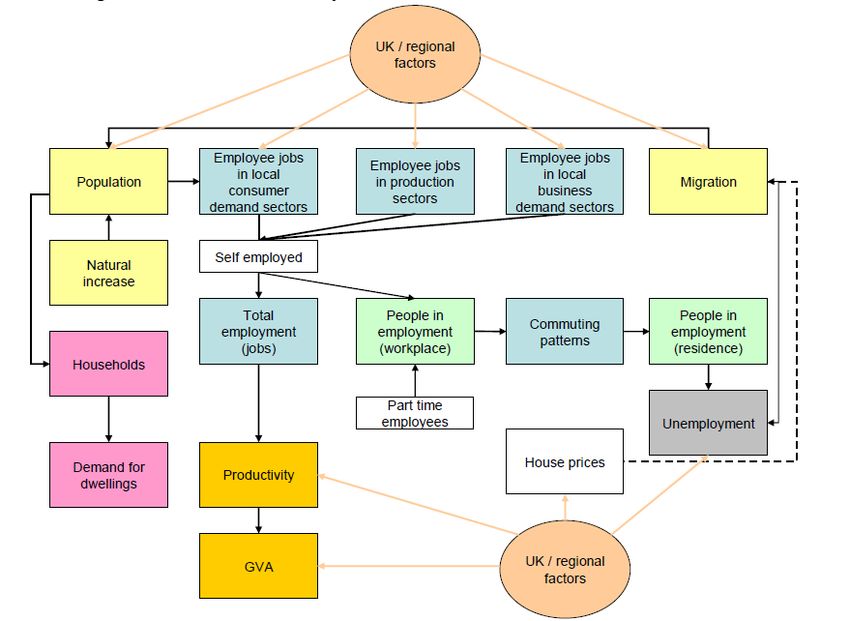
Objectively Assessed Housing Need Study
Figure 2-1 The NHPAU strategic HMA
Source: PBA
2.6 Below, we test this strategic HMA based on the same key indicators, migration and
commuting. We use the latest available data, from the 2011 Census.
Migration
Main origins and destinations
2.7 For each authority in the strategic HMA, the charts below show the other authorities
with which that authority has the largest combined gross migration flows.(The
analysis is for the 12 months preceding the Census and excludes house moves within
local authorities.) Using these combined migration flows (in an out) to measure the
strength of links with other districts:
Braintree’s strongest links are with Chelmsford and Colchester.
Chelmsford’s strongest links are with Basildon, Braintree and Maldon.
Colchester’s strongest links are with Tendring and Braintree.
Tendring’s strongest link is with Colchester.
Maldon’s strongest links are with Chelmsford, Braintree and Colchester.
July 2015 4Objectively Assessed Housing Need Study
Figure 2-2 Cross-boundary migration to and from Braintree, 2010-11,
persons
Source: ONS, PBA
Figure 2-3 Cross-boundary migration to and from Chelmsford, 2010-11,
persons
Source: ONS, PBA
July 2015 5Objectively Assessed Housing Need Study
Figure 2-4 Cross-boundary migration to / from Colchester, 2010-11,
persons
Source: ONS, PBA
Figure 2-5 Cross-boundary migration to and from Tendring, 2010-11,
persons
Source: ONS, PBA
July 2015 6Objectively Assessed Housing Need Study
Figure 2-6 Cross-boundary migration to and from Maldon, 2010-11,
persons
Source: ONS, PBA
2.8 In summary, for each authority in the NHPAU strategic HMA, the strongest migration
links are with other authorities in that HMA – with the sole exception of Chelmsford,
whose strongest link is with Basildon, which lies outside that HMA. Outside the
strategic HMA there is no one authority that is strongly linked to all the members of
that HMA. Uttlesford, for example, comes third in the list of districts linked to Braintree
and tenth on Chelmsford’s list, but it does not appear in the lists for Colchester,
Maldon or Tendring. On this basis there is no additional authority that has a good
case for joining the strategic HMA.
2.9 Other than places already discussed, the HMA authorities’ strongest links are to
London. Thus Chelmsford received a large total inflow from the London Boroughs of
Redbridge and Havering, though there is little movement in the opposite direction.
Similarly Tendring is at the receiving end of a large one-way flow from Havering,
Barking & Dagenham, Enfield and Waltham Forest.
2.10 In summary, the analysis so far suggests that the five local authorities in the
NHPAU’s strategic HMA are more closely linked to one another than to any other
area. The only exception to this general statement is that several of the authorities
receive large migration inflows from London. Given that it would not be practical to
include parts of London in the HMA, this suggests that NHPAU’s strategic HMA is
correctly defined. But before drawing conclusions we test the evidence more closely.
The 70% self-containment test
2.11 In this section we test the strategic HMA’s migration containment against the PPG
criterion that ‘typically’ some 70% or more of all house moves that either begin or end
in the HMA, excluding long-distance migration, should occur within the HMA. The test
is specified in more detail in an earlier CLG publication, on which the PPG is clearly
based:
‘Identifying suitable thresholds for self-containment: The typical threshold for
self-containment is around 70 per cent of all movers in a given time period. This
July 2015 7Objectively Assessed Housing Need Study
threshold applies to both the supply side (70 per cent of all those moving out of a
dwelling move within that same area) and the demand side (70 per cent of all those
moving into a dwelling have moved from that same area).’1
2.12 Table 2-1 shows these measures of containment for the strategic HMA. In this
calculation:
As well as the origin and destination ratios, we have calculated an overall
containment that combines the two. The overall containment equals the sum of
origins and destination of moves within the HMA to the sum of origins and
destination of moves that cross the HMA boundary2.
Migration data, as before, are taken from the 2011 Census and relate to persons
moving house in the year ending on Census day.
The analysis includes moves within authorities, which were excluded from the
calculations in the last section above.
Total moves comprise moves within the UK. It excludes those whose origin or
destination is overseas, because by definition these are long-distance moves,
which according to the PPG should be excluded from the total.
2.13 This measure of total moves is larger than the PPG intends, because it does not
exclude long-distance moves within the UK. Therefore the resulting containment
ratios will be underestimates, though we cannot tell by how much, because the PPG
does not define such distance moves, but only describes them by example: ‘e.g.
those due to a change of lifestyle or retirement’. On this basis we cannot identify long-
distance moves in the statistics, though we believe that retirement migration to the
Essex coast plays a significant part.
Table 2.1 Migration containment, strategic HMA, 2010-11, persons
Moves from Moves to
HMA Rest of UK Total
HMA 40,777 28,277 69,054
Rest of UK 28,816
Total 69,593
Origin containment 59%
Destination containment 59%
Source: ONS, PBA.
2.14 As calculated in the table, containment ratios are equal at 59%, less than the PPG
threshold. To bring them up to the threshold we would have to assume that 40% of
migration to and from the rest of the UK is ‘long-distance migration’, which seems
unrealistically high. Therefore we have examined whether the test could be met by
adding more local authorities to the HMA.
2.15 To determine what areas to test we have looked for those authorities with strong
gross flows to or from the strategic HMA. Figure 2-7 shows those areas that received
1
Communities and Local Government, Identifying sub-regional housing market areas, Advice note, March 2007
2
In this calculation each move within the HMA is counted twice, once as an origin and once as a destination.
July 2015 8Objectively Assessed Housing Need Study
large outflows from the strategic HMA. Figure 2-8 shows those areas that generated
large inflows into the strategic HMA.
Figure 2-7 Main gross migration outflows from the strategic HMA, 2010-
11, persons
Figure 2-8 Main gross migration inflows into the strategic HMA, 2010-11,
persons
2.16 The four authorities with the strongest links to the strategic HMA are Basildon,
Havering, Uttlesford and Babergh. Table 2-2 shows that adding these authorities
would make very little difference to the area’s migration containment. Adding Basildon
July 2015 9Objectively Assessed Housing Need Study
leaves the ratio unchanged. All the other options tested reduce it, albeit by
insignificant amounts.
Table 2.2 Overall migration containment for alternative areas
Area Overall containment
Strategic HMA + Brentwood 57%
Strategic HMA + Basildon 59%
Strategic HMA + Havering 58%
Strategic HMA + Uttlesford 55%
Strategic HMA + Babergh 58%
Strategic HMA + all of the above 56%
Source: ONS, PBA
Commuting
Main origins and destinations
2.17 The charts below show the main origins and destinations of cross-boundary
commuting to and from each authority in the strategic HMA.
Figure 2-9 Cross-boundary commuting to and from Braintree, 2011,
persons
Source: ONS, PBA
July 2015 10Objectively Assessed Housing Need Study
Figure 2-10 Cross-boundary commuting to and from Chelmsford, 2011,
persons
Source: ONS, PBA
Figure 2-11 Cross-boundary commuting to and from Colchester, 2011,
persons
Source: ONS, PBA
July 2015 11Objectively Assessed Housing Need Study
Figure 2-12 Cross-boundary commuting to and from Tendring, 2011,
persons
Source: ONS, PBA
Figure 2-13 Cross-boundary commuting to and from Maldon, 2011,
persons
Source: ONS, PBA
2.18 Using the combined commuting flows (in an out):
Braintree’s strongest links are with Colchester and Chelmsford.
Chelmsford’s strongest links are with Braintree, Maldon and Basildon.
July 2015 12Objectively Assessed Housing Need Study
Colchester’s strongest links are with Tendring and Braintree.
Tendring’s strongest links are with Colchester.
Maldon’s strongest links are with Chelmsford, Colchester and Braintree.
2.19 There are also large outflows from the strategic HMA (particularly Braintree,
Chelmsford and Colchester) to London, especially to Westminster, but also Tower
Hamlets and Havering.
The containment test
2.20 Table 2-3 below shows containment ratios for commuting.
Table 2.3 Overall commuting containment, strategic HMA, 2011
Commute from Commute to
HMA Rest of world Total
HMA 143,964 122,239 266,203
Rest of world 82,210
Total 226,174
Origin containment 54%
Destination containment 64%
Overall containment 58%
Source: ONS, PBA
2.21 The strategic HMA’s containment ratios for commuting are 64% for destination and
54% for origin; overall containment is 59%, which is similar to migration.
2.22 In relation to commuting neither the PPG nor the 2007 CLG advice3 identify a
threshold to help define housing market areas. But such a threshold is provided in the
ONS definition of Travel to Work Areas, which are mentioned in the PPG:
‘The current criterion for defining TTWAs is that generally at least 75% of an area's
resident workforce work in the area and at least 75% of the people who work in the
area also live in the area… However, for areas with a working population in excess of
25,000, containment rates as low as 66.7% are accepted.’
2.23 The strategic HMA does not quite meet the 66.7% criterion. Therefore, similar to our
earlier analysis of migration, we have examined whether adding more authorities to
the HMA would improve the containment ratio. The table below shows the impact of
adding those authorities with the strongest commuting links to the HMA.
3
Communities and Local Government, Identifying sub-regional housing market areas, Advice note, March 2007
July 2015 13Objectively Assessed Housing Need Study
Table 2.4 Commuting - overall containment
Area Overall containment
Strategic HMA + Brentwood 56%
Strategic HMA + Basildon 56%
Strategic HMA + Babergh 58%
Strategic HMA + Uttlesford 57%
Strategic HMA + Havering 54%
Strategic HMA + Westminster 50%
Strategic HMA + Basildon,
52%
Babergh, Uttlesford & Havering
Source: ONS, PBA
2.24 This analysis does not identify an HMA that meets the 66.7% containment criterion.
The most likely reason is that the area’s proximity to London makes commuting
containment very difficult to achieve.
Maldon – migration and commuting
2.25 Maldon District Council does not agree that Maldon shares an HMA with Braintree,
Chelmsford, Colchester and Tendring, and in progressing its Local Plan has provided
evidence to show that Maldon is a separate HMA.
2.26 To assess the implications of this stance on our commissioning authorities, we have
calculated the impact on the strategic HMA’s containment of removing Maldon. We
find that this change does not make a significant difference: migration containment
increases fractionally for 58.8% to 59.6% and commuting containment increases
similarly from 58.6% to 59.5%.
2.27 This suggests that Maldon Council’s decision to assess its housing need
independently is in no way detrimental to the remaining four authorities in the
strategic HMA.
July 2015 14Objectively Assessed Housing Need Study
Figure 2-14 Commuting – overall containment
Source: ONS, PBA
Figure 2-15 Migration – overall containment
Source; ONS, PBA
July 2015 15Objectively Assessed Housing Need Study
House prices
2.28 To supplement the above analysis of migration and commuting, we have considered
if house prices (levels and recent change) provide any evidence that would help
define a housing market area. We chose these indicators because alongside
migration and commuting they are the only ‘hard’ evidence mentioned in the PPG, as
opposed to qualitative and contextual evidence such as household areas of search
and catchment areas for schools or retail centres.
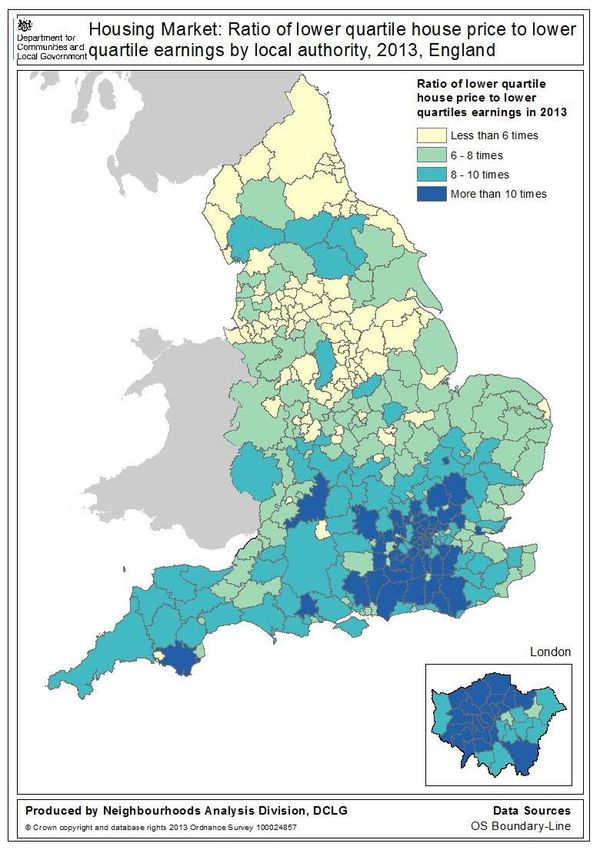
2.29 Figure 2-16 is a heat map of house prices across Essex. It shows high prices in
Brentwood (the red circle) and an M11 corridor (the blue line). But there is no
pattern that would help us define the boundaries of an HMA that includes our
commissioning authorities.
Figure 2-16 House prices, February 2015
Source: Zoopla, Heatmap of UK property values
2.30 Table 2.5 shows house price change in the 10 years to 2012 for the Essex districts.
There is very little variation between the districts, and no distinct spatial pattern that
can help draw housing market areas.
July 2015 16Objectively Assessed Housing Need Study
Table 2.5 House price changes, Essex districts, 2002-12
Local authority area % increase
Basildon 65%
Braintree 62%
Brentwood 69%
Castle Point 65%
Chelmsford 67%
Colchester 67%
Epping Forest 67%
Harlow 65%
Maldon 70%
Rochford 68%
Tendring 70%
Uttlesford 66%
Essex 66%
Source: CLG live table 581 (mean house prices based on Land Registry data), PBA
Conclusions
2.31 We have used evidence from the 2011 Census to test the strategic HMA defined by
the NHPAU housing market area geography. Our analysis found that the area falls
short of the 70% migration containment set in the PPG. Therefore we tested
alternative definitions of the HMA, adding further local authority areas, but we could
not find an alternative that had higher containment. The likely reason is that migration
out of London, including retirement migration into the HMA, makes containment
difficult to achieve.
2.32 Maldon District Council considers that its district is a free-standing HMA, rather than
part of the NHPAU’s strategic HMA. Whether or not this view is supported by local
information, including ‘soft’ qualitative data, is a matter for that Council to consider.
For our part, we have tested the quantitative impact of excluding Maldon on our four
commissioning authorities, which form the rest of the strategic HMA. We find that an
HMA comprising those four authorities has fractionally higher self-containment than
the strategic HMA. Therefore Maldon District Council’s stance has no detrimental
impact on our commissioning authorities and those authorities have no reason to
challenge it.
2.33 In summary, our analysis suggests that an HMA comprising Braintree, Colchester,
Chelmsford and Tendring Council areas forms a sound basis for assessing housing
need. The rest of this report focuses on this area, which we call simply ‘the HMA’.
July 2015 17Objectively Assessed Housing Need Study
3 THE OFFICIAL HOUSEHOLD PROJECTIONS
Introduction
3.1 As required by national policy and guidance, in assessing housing need we start from
the latest official household projections published by the Department of Communities
and Local Government (CLG). In later chapters we will sensitivity-test the projections
and consider alternative scenarios to deal with any factors that the projections do not
capture, in line with the PPG. All our data and projections are taken from the Greater
Essex Demographic Forecasts report produced by Edge Analytics for the Essex
Planning Officers Association (EPOA). Specifically we use the Phase 7 Edge
Analytics report, which is the most up-to-date in the series4. For the purposes of
brevity this will be referred to as the Edge report for the rest of this report.
3.2 The official demographic projections are issued in two separate publications:
ONS produces the Sub-National Population Projections (SNPP), which show
population by age and sex, based on rolling forward past rates of natural change
(births minus deaths) and migration for each demographic group.
CLG then converts each SNPP into household projections.
3.3 The factors that translate population into households, known as Household
Representative Rates (HRRs, also known as headship rates or housing formation
rates), are based on rolling forward past trends for different demographic groups. The
resulting household numbers, with a small adjustment for vacant and second homes,
are used as a measure of future housing demand, or objectively assessed need.
Recent releases
3.4 The NPPF, published in March 2012, advised that the official CLG household
projections should be the starting point for assessing housing need. But at that time,
and until very recently, we did not have a full set of recent projections that were fit for
purpose. The 2008-based projections were increasingly out of date. The 2011-based
projections, published in 2013, were labelled ‘interim’ because of data limitations, and
they only ran to 2021.
3.5 To fill the gap, Councils and their consultants developed a range of alternative
demographic scenarios that extended or adjusted the 2011 projections, or ‘blended’
them with the 2008 ones in an attempt to capture long-term trends. Different
authorities used different approaches, making it difficult to compare or aggregate
neighbouring areas.
3.6 On 27 February 2015 CLG finally produced 2012-based household projections (‘CLG
2012’), which supersede earlier versions. The new CLG projections are derived from
the 2012-based sub-national population projections (‘SNPP 2012’) published in 2014.
To model future HRRs the CLG 2012 projections use the same method as CLG 2011,
4
Edge Analytics, Greater Essex Demographic Forecast 2013-37, Phase 7 Main Report, May 2015
July 2015 18Objectively Assessed Housing Need Study
but a different starting point, in that they are based on revised estimates of actual
HRRs at 2011. Although these estimates are still imperfect, due to difficulties in
processing Census results, they are the best information available at present.
3.7 The PPG, in a new paragraph published on the same day as CLG 2012, has
endorsed that projection as ‘the most up-to-date estimate of future household
growth4. This statement establishes a new starting point for assessing housing need
and implies that earlier official projections may now be dismissed.
The 2012-based projections
3.8 Table 3.1 below shows the 2012-based official projections for the HMA. The figures
are from the EPOA Stage 7 report, which has re-based the projection to start in 2013
and translated households into dwellings through a small adjustment for vacant and
second homes. We show these and later numbers per annum, because this is how
local plans and monitoring reports normally express housing targets. For the HMA the
projections show a need for 2,916 net new dwellings per annum (dpa).
Table 3.1 Population, households and dwellings, 2013-37, ONS/CLG 2012
Change p.a. Population Households Dwellings
Braintree 1,171 668 686
Chelmsford 1,108 643 657
Colchester 1,638 834 868
Tendring 1,068 654 705
HMA 4,986 2,799 2,916
Source: Edge Analytics Greater Essex Demographic Forecasts Phase 7 Report
3.9 Table 3.2 shows the split of projected population growth between migration and
natural change. It demonstrates that population growth in the HMA is highly
dependent on migration. Of the 5,000 net additional people in the HMA each year
84% are net in-migrants5.
Table 3.2 Components of population change, 2013-37, ONS/CLG 20126
Total Net Natural %
Change p.a. %
population migration change
Braintree 1,171 985 84% 186 16%
Chelmsford 1,108 628 57% 480 43%
Colchester 1,638 822 50% 816 50%
Tendring 1,068 1,737 163% -669 -63%
HMA 4,986 4,172 84% 814 16%
Source: Edge Analytics Greater Essex Demographic Forecasts Phase 7 Report
5
As a reminder. ‘migration’ and ‘migrants’ in the present context include people moving house within the UK as
well as international migration
6
In this table natural change includes births and associated with migrants, so if a woman who moved into the
area one year gives birth the following year that birth counts as part of natural change. An alternative assessment
of the relative contributions of migration and natural change is provided in the EPOA ‘natural change scenario’
(not shown here), in which babies born to migrants and deaths of migrants are excluded from natural change.
July 2015 19Objectively Assessed Housing Need Study
3.10 In Tendring the picture is even starker. There are more deaths than births each year,
because the population is much older than in the rest of the HMA, so migration tops
up what would otherwise be a declining population.
July 2015 20Objectively Assessed Housing Need Study
4 ALTERNATIVE DEMOGRAPHIC SCENARIOS
Introduction
4.1 As mentioned earlier the official projections should be tested at the local level before
being accepted as a measure of housing need. This is usually done through
alternative scenarios which vary some of the methods and assumptions used by
ONS/CLG. In the present case the Councils have the benefit of regionally consistent
alternative scenarios provided by the Edge report.
4.2 That report provides 10 variations on the official projections, from which we have
selected those most relevant to future housing needs. In this chapter we review two
alternative scenarios based on varying projections methods. In Chapters 5 and 6 we
will move on to scenarios that assess the implications of wider factors, first London’s
unmet needs and then future job growth. But first, in the next section we discuss a
technical question which applies to all scenarios: the choice between fixed and non-
fixed migration profiles.
Fixed vs non-fixed migration profiles
4.3 The Edge projections use two alternative methods for determining the amount and
age profile of future migration:
‘Fixed’ scenarios carry forward past migration flows from the base period
(reference period), ignoring any impact that the population’s changing age profile
might have on migration.
Other scenarios, which may be called non-fixed or dynamic (though the report
does not give them a particular label) use age-specific migration rates. Rather
than numbers of migrants, these scenarios carry forward the likelihood (or
propensity) to migrate of different age groups. Because different age groups have
different propensities, this means that future migration will change as the age
structure of the population changes.
4.4 To take an example, in the base periods used (which may be five or 10 years as
discussed later) migration from the rest of the UK to Tendring has been weighted
towards the older age groups. The proportion of all UK residents who moved to
Tendring was much higher for (say) over-65s than younger age groups. In future the
over-65s will form a growing proportion of the UK’s population. In the fixed scenarios,
this ageing population makes no difference to the projected migration into Tendring.
In the non-fixed scenarios it results in more migration into Tendring, because there is
a large pool of older people.
4.5 The Edge report does not recommend either method, leaving the choice (like all such
choices) to the client authorities. In our analysis below we show both variants.
We prefer the non-fixed (dynamic) version, because common sense suggests that the
different behaviour of people at different ages is an important driver of demographic
July 2015 21Objectively Assessed Housing Need Study
change – especially given that in the next 20 years or so the UK’s population is set to
age dramatically.
4.6 As a caveat, however, we note that the dynamic method may exaggerate the impact
of this ageing on migration, because as older age groups form a higher proportion of
the population their behaviour might change (‘60 is new 50’). The postponement of
the State Pension Age is already causing this kind of effect. For women in their early
60s, for example, the likelihood of being retired is becoming similar to that which
previously applied to those in their late 50s. A natural consequence might be that
people will move to the Essex coast at later ages than they did in the past.
Unattributable Population Change
4.7 The Edge report provides alternative projection scenarios ‘with Unattributable
Population Change (UPC) and ‘excluding UPC’ (labelled ‘X’ scenarios). To choose
between these alternatives, we need to understand what the UPC is and how it
affects the HMA.
What is UPC?
4.8 UPC is a discrepancy in the official population statistics that arose between the 2001
and 2011 Censuses. In this inter-censal period the ONS makes estimates of the
components of population change, which are published as Mid-year Population
Estimates (MYEs). Births and deaths are measured easily and accurately, because
the UK has an efficient registration system. But migration (UK and international)
cannot be measured directly, and is estimated from indirect and incomplete data such
as GP registrations.
4.9 When the 2011 Census results came to light, the population in many places was
different from what had previously been estimated. ONS accordingly revised the
MYEs for the intercensal period to bring them into line with the Census. But for many
places it proved impossible to fully reconcile the revised components of change with
population numbers at the two Censuses. To deal with this remaining discrepancy,
ONS introduced an additional component of change, in effect an ‘errors and
omissions’ factor. This is the UPC.
4.10 The UPC may be due to miscounted population in one or both Censuses – though
this is more likely to be in 2001 than 2011, because by 2011 methods had been
considerably improved. It may also be due to unrecorded or misrecorded migration
between the Censuses. More likely both factors are at work.
4.11 For England the UPC is positive and amounts to 103,000 persons between 2001 and
2011. At this level, insofar as the UPC is due to misrecorded migration it is likely to
relate to international migration rather than cross-border movements within the four
countries of the UK. This view is supported by ONS in its 2014 review ‘Quality of
International Migration Estimates from 2001 to 2011’, which shows that net
international migration to the UK may have been originally underestimated by over
340,000 over the period. This was mainly caused by the failure in mid-decade of the
July 2015 22Objectively Assessed Housing Need Study
International Passenger Survey (IPS) to cover the arrivals of budget airline flights
from Eastern Europe at regional airports. These airports are now covered by IPS.
4.12 At the local authority level the UPC is more complicated. The national total of 103,000
is the net outcome of positive UPC in some authorities and negative UPC in others.
Although the initial problem (or some of it) may have been in counting international
migrants, further issues arise in relation to the correct assignment of these migrants
to local authorities. Incorrect initial assignments are compounded when new
immigrants to the UK change address and their move is picked up by the NHS and
translated by ONS into its estimates of internal migration.
4.13 UPC, therefore, is at least partly a correction for failings in the combination of
measuring and assigning international migrants at the local authority level. This
correction should not be needed in future, because ONS has now improved its
processes to better distribute international immigrants to their first true area of
settlement (where they register with the NHS) rather than where they may first live
temporarily. But we still need to consider it when projecting from base periods that
pre-date these improvements.
4.14 Although it has already improved its methods, we understand that ONS has a
provisional plan for revised MYEs back to 2011 to be published in 2016, using any
new methods arising from its current research into international and internal
migration. This implies that its current annual estimates of migration since mid-2011
are not sacrosanct, and therefore should be used with caution in using past migration
trends as the springboard for future projections.
UPC and the official population projections
4.15 ONS decided not to adjust its 2012-based Sub-national Population Projections
(SNPP 2012) to take account of the UPC. This means that the UPC is excluded from
the past migration flows which the projections carry forward. Therefore the CLG
household projections, which are derived from SNPP 2012, also exclude the UPC. An
ONS Questions and Answer document7 gives two reasons for the ONS’s decision:
UPC is unlikely to measure a bias in the trend data that will continue in the future;
and
It would be methodologically difficult to adjust for, because it is unclear what
proportions of the UPC are due to errors in the Census population counts as
against errors in the migration estimates.
4.16 In an earlier consultation document8, ONS expands on the first point, noting that,
insofar as the UPC is due to international migration ‘it is likely that the biggest impacts
will be seen earlier in the decade [2001-11] and will have less of an impact in the later
years, because of improvements introduced to migration estimates in the majority of
these years’.
7
Office for National Statistics, Questions and Answers: 2012-based Subnational Population Projections, May
2014
8
ONS, Report on Unattributable Population Change ; January 2014
July 2015 23Objectively Assessed Housing Need Study
4.17 Among respondents to the consultation was the GLA Intelligence Unit, which has
particular expertise in demography and a particular interest in the issue, because the
UPC was relatively large for a number of London boroughs. The GLA paper9
questions whether the MYE population counts should be corrected for distortions
related to UPC, recognising that these distortions are likely to impact on the 2012-
based projections. Its answer to the question is that correcting the MYEs ‘would be a
very large undertaking and is probably unrealistic at this time’. The GLA then asks if
projected migration should be corrected through ‘a mechanism such as rolling
forward the UPC’, but answers that this ‘would likely prove unsuccessful and
generate confusion’. Therefore the paper advises that ‘the GLA agrees with [the
ONS’s] decision… not to attempt to incorporate the UPC component within the
projections’.
UPC in the HMA
4.18 As noted above the ONS has decided to exclude UPC from the official projections,
and is satisfied that this is a robust national response. But to decide whether the
same response is valid in any particular area we need to look closely at the local
situation. This applies particularly to our HMA, because two of its districts, Colchester
and Tendring, have large UPCs.
UPC in Chelmsford and Braintree
4.19 In Chelmsford and Braintree the UPC is positive, at some 1,500 people over the
intercensal 10 years for each authority. These discrepancies are too small to call into
question the official projections.
UPC in Colchester
4.20 The Census found a lower population in Colchester than was expected, by around
10,000 people. But after the revisions to the MYE only a deficit of 2,700 remained
unattributed.
4.21 To try and understand who these people are, so we can develop a working theory
about how the error emerged, we have estimated the age structure of the UPC. This
is not provided by the ONS, but can be derived by comparing two sets of adjustments
to the 2012 MYEs, before and after the UPC emerged.
4.22 We find that most of this unattributed population comprises younger people, between
the ages of 18 and 30, and especially males. The Census reported many fewer young
males than expected and slightly fewer young females.
9
GLA Intelligence, Response to the SNPP 2012-based Subnational Population Projections consultation, February
2012
July 2015 24Objectively Assessed Housing Need Study
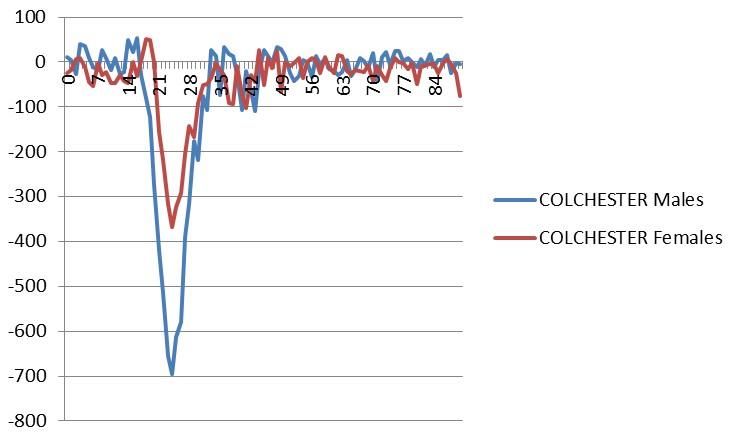
Figure 4-1Colchester estimate of UPC by age
Source: ONS Mid-2010 Population Estimates (original and revised)
4.23 The most likely reason for this is misrecording of either students or members of the
armed forces. This is a well-known problem with official statistics, which rely on GP
registrations to record domestic migration.
4.24 It is not uncommon for universities (including the University of Essex, which has an
on campus health centre) to require students to register with local doctors on arrival
at university. But following completion of their courses former students move away
but do not re-register with a new surgery until they need access to healthcare
services. A similar pattern applies to army personnel; official statistics report them
arriving, but slow to acknowledge them leaving.
4.25 So, in Colchester an adjustment to the official projections to remove these
unattributable people appears justified. Projections that take account of the UPC are
more likely to be robust because here the UPC represents those students and army
personnel who moved out of the area unnoticed by the official statistics at time.
UPC In Tendring
4.26 Tendring has a large UPC adjustment. Here UPC was over 9,000 people negative
over the 10 year (Census to Census) period. The Census reported many fewer
people in the district than were expected. The impact on the projected housing need
is around 200 new homes per year.
4.27 Contrary to Colchester, the UPC appears to be spread evenly across the age groups
(Figure 4-2)10. In this case the age breakdown provides no clue to the cause of the
UPC. For Tendring Council this presents a dilemma that official statistics cannot
answer.
10
The ‘bunching’ at 90+ is because the data combines all people above 90 years old.
July 2015 25Objectively Assessed Housing Need Study
Figure 4-2 Tendring estimate of UPC by age
Source: ONS Mid-2010 Population Estimates (Difference between original and revised population profiles)
4.28 If the Council believes both the 2001 and 2011 Census to be correct, then a
(negative) UPC adjustment should be made to the official projections to take account
of the UPC. If the Council thinks either Census was miscounted (2001 is the more
likely), then it should rely on a projection that excludes the UPC, as the official
projections already do. To also help decide how to manage this uncertainty the
Council should consider the other market signal and economic evidence we examine
in later sections.
Alternative base periods
4.29 As we explained earlier, to predict UK migration the ONS population projections carry
forward the trends of the previous five years11. This choice of base period can be
critical to the projection, because for many areas migration has varied greatly over
time.
4.30 To sensitivity-test the impact of this, the Edge scenarios use two alternative base
periods: five years from 2008-9 to 2012-13 and 10 years from 2003-04 to 2012-13.
The tables below show the results.
4.31 In the tables below, reproduced from the Edge report, we show the CLG 2012
projection (labelled SNPP 2012) and these alternative scenarios. We also show the
EPOA’s Natural Change scenario. This is not a measure of housing need. It is of
interest only because by comparing it with the other scenario we can see how much
of the growth in the other scenarios is due to migration.
11
Similarly the distribution of international migration across local authority areas is projected from the previous six
years.
July 2015 26Objectively Assessed Housing Need Study
Braintree
Table 4.1 Alternative scenarios, change p.a. 2013-37, Braintree
Scenario Population Households Dwellings
SNPP-2012 1,171 668 686
PG-10Yr-X 1,169 654 672
PG-5Yr-X 912 565 580
PG-10Yr 1,238 650 668
PG-5Yr 984 563 579
PG-10Yr-Fixed 1,261 598 614
PG-5Yr-Fixed 808 446 458
Natural Change 284 268 276
Source: Edge Analytics Greater Essex Demographic Forecasts Phase 7 Report
4.32 For Braintree the 2012-based official projection is the highest demographic projection
tested. But it is also very similar to the 10-year which adds credibility to the SNPP
2012 as a base for long term planning; despite its short trend period.
4.33 UPC, as noted above, makes very little difference to the projections here. There is
also little difference between the fixed and dynamic migration scenarios.
Chelmsford
Table 4.2 Alternative scenarios, change p.a. 2013-37, Chelmsford
Scenario Population Households Dwellings
SNPP-2012 1,108 643 657
PG-10Yr-X 1,031 571 584
PG-5Yr-X 975 590 603
PG-10Yr 1,096 595 608
PG-5Yr 1,026 605 618
PG-10Yr-Fixed 793 479 490
PG-5Yr-Fixed 800 503 514
Natural Change 310 395 404
Source: Edge Analytics Greater Essex Demographic Forecasts Phase 7 Report
4.34 For Chelmsford most of the projections, except the fixed versions, are very similar.
Alternative trend-based projections are slightly lower than the SNPP 2012 but not so
different to cast doubt on the use of the SNPP 2012 as the starting point. The
difference between the 10 year projection (excluding UPC) and the SNPP 2012
(which is also excluding UPC) is around 10% and given the large margin for error in
all the data is not sufficient to depart from the SNPP 2012 as the starting point.
Colchester
Table 4.3 Alternative scenarios, change p.a. 2013-37, Colchester
Scenario Population Households Dwellings
SNPP-2012 1,638 834 868
PG-10Yr-X 1,824 952 990
July 2015 27You can also read