Appendix G Current State 2019 - Hawke's Bay Three Waters ...
←
→
Page content transcription
If your browser does not render page correctly, please read the page content below
Appendix G Current State - 2019 Morrison Low
Hawke’s Bay Three Waters Service Delivery
Current State Assessment
April 2019
Morrison Low 1
Document status

 Ref             Approving Director                                                                        Date
 2418            Dan Bonifant                                                                              1 March 2019
 2418V2          Dan Bonifant                                                                              15 April 2019
 2418V3          Dan Bonifant                                                                              22 May 2019

© Morrison Low

Except for all client data and factual information contained herein, this document is the copyright of Morrison Low. All or any part of it
may only be used, copied or reproduced for the purpose for which it was originally intended, except where the prior permission to do
otherwise has been sought from and granted by Morrison Low. Prospective users are invited to make enquiries of Morrison Low
concerning using all or part of this copyright document for purposes other than that for which it was intended.
Contents
1 Introduction 1
1.1 National context 1
1.2 Regional context 2
2 Methodology 3
2.1 Project 3
2.2 Current state assessment 3
3 Hawke’s Bay 5
3.1 General information 5
3.2 The councils of the region 6
3.3 Three waters service 6
3.4 Funding and financing 8
3.5 Human resources involved in three waters services 12
3.6 Governance of three waters 19
4 Water 21
4.1 Assets 22
4.2 Financial 32
5 Wastewater 38
5.1 Assets 39
5.2 Financial 46
6 Stormwater 51
6.1 Assets 52
6.2 Financial 58
7 Further observations 63
7.1 Good practice 63
7.2 Regional opportunities 63
Appendix A Summary of Infrastructure Strategy Key Themes 64
Appendix B Failure Analysis 69
Morrison Low i
Tables Table 1 Territorial Authority key statistics 6 Table 2 Region wide summary of three water assets 7 Table 3 Region wide summary of three water customers 7 Table 4 Three waters key financial information 8 Table 5 Council approaches to three waters charges 9 Table 6 Council approaches to funding renewal and depreciation 9 Table 7 Internal delivery of three waters services 16 Table 8 Extent of in-house delivery and outsourcing for three waters operations and maintenance 16 Table 9 Major water issues (as identified by the Councils) 21 Table 10 DIA performance measures: water 30 Table 11 Water revenue and charges 32 Table 12 Water debt 34 Table 13 Major wastewater issues (as identified by the Councils) 38 Table 14 DIA performance measures: wastewater 44 Table 15 Wastewater revenue and charges 46 Table 16 Wastewater debt 48 Table 17 Major stormwater issues (as identified by the Councils) 51 Table 18 DIA performance measures: stormwater 57 Table 19 Stormwater revenue and charges 58 Table 20 Stormwater debt 58 Table 21 Data supplied for failure analysis 69 Figures Figure 1 Summary of project methodology 3 Figure 2 Map of the Hawke's Bay Region 5 Figure 3 Key themes for three waters (from 30-year infrastructure strategies) 7 Figure 4 Region wide summary of three water asset condition (by length) 8 Figure 5 Total three waters debt across the Hawke’s Bay Region (2019/20 budgets) - $000s 10 Figure 6 Three waters debt to asset ratio 11 Figure 7 Three waters debt to revenue ratio 11 Figure 8 Central Hawke’s Bay District Council three waters team structure 12 Figure 9 Hastings District Council three waters team structure 13 Figure 10 Napier City Council three waters team structure 14 Figure 11 Wairoa District Council three waters team structure 15 Figure 12 Number of employees and full-time-equivalent employees in each council’s water team(s) 16 Figure 13 Proportion of employees and proportion of FTEs involved in delivering three waters services 17 Figure 14 Breakdown of three waters expenditure 18 Figure 15 Water supply service key information 22 Morrison Low ii
Figure 16 Water pipe length 23 Figure 17 Pump stations and treatment plants 23 Figure 18 Age profiles of water networks (watermains) 24 Figure 19 Network composition by material type 25 Figure 20 Number of reservoirs 25 Figure 21 Reservoir storage 26 Figure 22 Water asset condition (by length) 27 Figure 23 Annual faults normalised by network length (all material types) 28 Figure 24 Cost per cubic metre of water produced and consumed in Hawke’s Bay Region 33 Figure 25 Water asset renewal ratio (long term plan) 36 Figure 26 Planned water capital expenditure per ratepayer (Long term plan, NPV 5% discount rate) 36 Figure 27 Wastewater service key information 39 Figure 28 Wastewater pipe length 40 Figure 29 Number of pump stations and treatment plants 40 Figure 30 Wastewater pipe average age 41 Figure 31 Wastewater asset condition (by length) 42 Figure 32 Cost per cubic metre of wastewater treated in Hawke’s Bay Region 47 Figure 33 Wastewater renewal ratio 49 Figure 34 Planned wastewater capital expenditure per ratepayer (LTP, NPV 5% discount rate) 50 Figure 35 Stormwater service key information 52 Figure 36 Stormwater pipe length 53 Figure 37 Stormwater pump stations 53 Figure 38 Stormwater pipe average age 54 Figure 39 Stormwater asset condition 55 Figure 40 Stormwater renewal ratio 60 Figure 41 Planned stormwater capital expenditure [per ratepayer (LTP, NPV 5% discount rate) 61 Figure 42 Annual AC faults normalised by network length 70 Figure 43 Annual PVC faults normalised by network length 70 Figure 44 Annual steel faults normalised by network length 71 Figure 45 Age distribution by pipe material 71 Morrison Low iii
1 Introduction
1.1 National context
The New Zealand Government is currently reviewing how three waters services are delivered across New
Zealand. In a Cabinet paper released on 20 November 2018, the Government indicated that alongside
regulatory changes there may be major structural reform of the water sector. The Cabinet paper described a
system facing significant issues where “the scale of the challenge indicates that the status quo is not
sustainable in the long term”. Among the key issues identified were weak regulation, capability challenges
(particularly for smaller councils), funding and financing issues for upgrading infrastructure, where the
Government stated “for many smaller councils, there is no clear way forward given the scale of the
challenges”.
The Government has identified the following as the major outcomes it seeks for the reform of the three
waters system:
• Existing three waters assets and services must remain in public ownership, and the system will
incorporate safeguards to protect public ownership of this essential infrastructure, both now and in
the future
• A sustainable three waters system that operates in the long-term interests of consumers,
communities, tangata whenua, and New Zealand generally
• Drinking water that is safe, acceptable and reliable
• Environmental performance of wastewater and stormwater realise the aspirations of communities in
which they are situated, including tangata whenua and New Zealand generally
• Three waters services are delivered in a way that is efficient, effective, resilient and accountable, with
transparent information about performance, and prices consumers can afford
• Regulatory stewardship of the three waters system is fit for purpose, and provides assurance that
these outcomes are being achieved and safeguarded.
The Cabinet paper identified three high level options for reform.
1. Regulatory reforms only, with voluntary, sector led reforms to service delivery arrangements.
2. A three waters fund to support voluntary service delivery improvements.
3. An aggregated system of dedicated, publicly owned, drinking water and wastewater providers
– On a regional basis – 12 providers
– On a multi-regional basis, with approximately three to five providers.
Through the Government’s consultation process around the Cabinet paper and three waters review generally,
it has encouraged stakeholders to put forward their best suggestions as to what that reform may look like.
The three options for reform are now expected to be considered progressively with the first announcements
relating to the regulatory reform package expected in June 2019.
This review does not assume any outcomes of the Government’s reform program. However, as
announcements are made providing certainty over outcomes, they will be taken into consideration and
adjustments to the project made as required. We also recognise the political environment and growing
expectation within the sector that significant regulatory reform will be made.
Morrison Low 11.2 Regional context
The five councils within the Hawke’s Bay Region, including Napier City Council, Hastings District Council,
Central Hawke’s Bay District Council, Wairoa District Council and Hawke’s Bay Regional Council (“the
Councils”) have collectively commenced this review of the three waters service delivery.
The Hawke’s Bay has been a focal point for the three waters discussion due to the 2016 Havelock North water
contamination event. Following this, the Councils have collectively worked together to respond to
recommendations arising from the inquiry into the Havelock North water contamination event. The region is
now one of the few who have joined together to engage with the government on the issues identified by the
November 2018 Cabinet paper.
The primary objective of this review is to complete an assessment and recommendations of the current and
potential delivery models for three waters in the Hawke’s Bay region. It is focussed on the three waters
service provided by the Councils, but in doing so needs to acknowledge the broader issues and emerging
community concerns relating to water and the management of water within the Hawke’s Bay and more
generally across the country. The review is concerned with the three waters services – drinking water,
wastewater and stormwater. Issues relating to the wider management of rivers, lakes and harbours for
example is not part of this study except to the extent that the three waters services impact on rivers, lakes
and harbours.
While parts of the Rangitīkei and Taupō District Councils are within the Hawke’s Bay Regional Council area,
those areas are not within the scope of this study.
This study is intended to provide the Councils with information to engage effectively with central government
on the three waters reforms. Ultimately a recommendation will be provided to the Councils about the best
way forward. It will then be for the Councils and their communities to decide the next steps.
1.2.1 Current state assessment
The purpose of this initial phase of the project, the current state assessment, is to complete a stocktake of the
current three waters service delivery in the Hawke’s Bay in order to inform all later parts of the study. This
includes gathering data and information relating to:
• the infrastructure and physical assets that provide the services
• the funding and financing of the service
• the people involved in providing the service (both employed by the Councils and through contracts)
• the performance of the three waters system and compliance with current regulatory standards.
This report does not analyse the data to compare relative performance across the region nor draw
conclusions on future options from the information contained within it. The report is presented solely to
provide an assessment of the current situation such that it can be used to inform later analysis of the options.
It does however quite clearly identify some common themes, the similarity of challenges, but quite stark
differences between the respective councils’ situations. Taken together, these create opportunities at a
regional level.
Morrison Low 22 Methodology
2.1 Project
An overview of the methodology for the entire project is set out below to give context to this current state
assessment. The project follows a structured, staged process moving from current state assessment,
definition of key principles into analysis of a long and short list of options over time. The approach and then
analysis will be consistent with the Better Business Case approach and the requirements of Section 17A of the
Local Government Act.
Throughout the process there was engagement with the Councils’ project team as well as the Councils
themselves and identified stakeholders. It is important to note that the review is intended to provide analysis
of the costs and benefits of different service delivery models for three waters in Hawke’s Bay. The report
should therefore be seen as only the first step in a process and not an outcome in and of itself.
The report will need to be considered individually and collectively by the Councils, including, we anticipate,
identification of the future work required to identify a preferred option and the approach to those phases of
work, then engagement with the respective communities and the region as a whole before any determination
by a council or the Councils is made.
Figure 1 Summary of project methodology
Project Current State Detailed analysis of
Options Review Reporting
Establishment Assessment shortlisted options
• Project planning • Assets • Council and Iwi • Detailed analysis • Draft
• Kick off meetings • Finance engagement • Challenge • Final
• Human • Identify key workshop
resources objectives
• Service delivery • High level review
of all options
2.2 Current state assessment
The purpose of this phase is to achieve clarity around the services, assets and resources of three waters in the
region. It is not possible to undertake meaningful analysis of the options or consideration of the benefits of
changing approach without first having a consistent, common understanding of the status quo across the
region.
The process has included a number of data requests, a questionnaire sent to the Councils for completion,
data validation meetings, web-conferences and telephone discussions. We would like to acknowledge and
thank the Councils for their openness and the willingness of the project team and wider council staff to
respond to our numerous requests.
The results of the current state assessment are presented in separate sections for each service (i.e. water
supply, wastewater and stormwater) with numeric and qualitative information collated at council level that
shows the contribution each council makes to the total. A regional view has also been provided where that is
relevant.
Morrison Low 3The current state assessment has been presented using a range of suitable benchmarks and measures covering the resources (financial, asset and human resources) and the services themselves. Our approach has been to present a summary of the information in charts, tables and figures with explanatory notes throughout. 2.2.1 Data limitations and clarifications Financial data Financial information is based on three years of information provided by each council, and LTP projections for the years beyond that. Figures used in this report may therefore differ from the published LTP. DIA performance measures DIA requires all councils in New Zealand to report against mandatory non-financial performance measures. These measures have been used in this report. However, we note that while the measures themselves are mandatory, each council may set its own targets. This means that although, for example, all councils may meet a particular measure, their performance can be quite different. This also means that the most useful comparison requires analysis of both the target and the actual performance. Asset condition While each council reports condition data based on the same scale of 1 – 5, we acknowledge that each council has its own approach to determining the actual condition of its assets. A comparison between the respective conditions of the Councils’ three waters assets should only therefore be treated as indicative. Morrison Low 4
3 Hawke’s Bay
3.1 General information
The Hawke’s Bay region lies on the east coast of the North island of New Zealand and is home to an estimated
165,900 1 people. The main cities are located close to each other - Napier on the coast, and Hastings 17 km
inland. Smaller towns are Wairoa, Waipawa and Waipukurau, with other small settlements found throughout
the region.
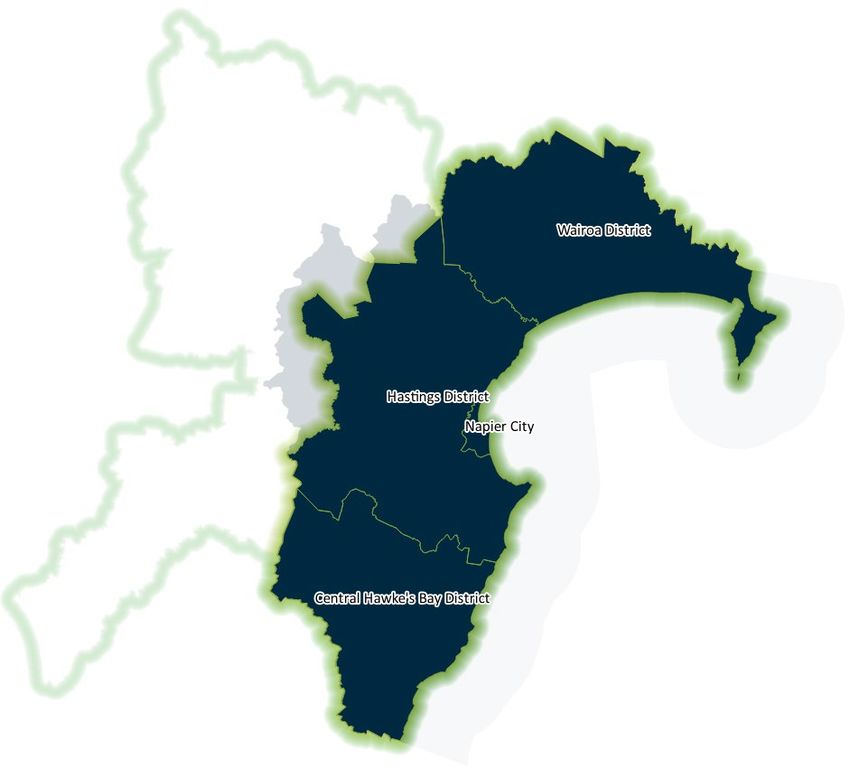
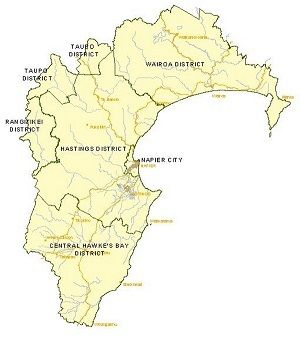
Figure 2 Map of the Hawke's Bay Region
Figure 2 above shows the area covered by the Hawke’s Bay Regional Council and within that area there are six
territorial authorities (one city council and five district councils). For the purposes of this study the region
does not include the area within the boundaries of Rangitīkei or Taupō District Councils.
1 Sub-national population estimates, June 2018, Stats NZ
Morrison Low 53.2 The councils of the region
Based on population and size of council operations, there are two large and two small territorial authorities
within the Hawke’s Bay region. The www.localcouncils.govt.nz website publishes comparative information
about the councils. It states that Napier City Council and Hastings District Council are roughly equivalent, each
with approximately $100 million operating revenue and over 400 employees. Central Hawke’s Bay District
Council and Wairoa District Council each have revenue of $25 million and $19 million respectively, and less
than 60 employees. This is significant in the context of delivering three waters service and, as noted later in
the human resources section, results in employees having to cover a broad range of duties and act as
generalists, not specialists. The population and rating base in the smaller councils also limits the funds
available for capital works. The capital works budget (across all council activities) in Hastings District Council is
over ten times larger than the capital works budget for Wairoa District Council. Napier is unique in the
context of the Hawke’s Bay as a City Council, with a significantly smaller land area and one population centre.
Table 1 Territorial Authority key statistics
Central Hawke’s
Hastings Napier Wairoa
Bay
Land area 3,332 km2 5,226km2 105km2 4,077km2
Population 2 14,150 80,600 62,800 8,230
Council operating revenue
3
24,989 104,635 99,160 18,974
($000)
Council operating expenditure
29,649 113,855 80,915 21,209
($000)
Council capital expenditure
12,742 54,069 38,342 5,086
($000)
Council rates revenue ($000) 18,520 70,469 51,029 11,736
Median personal income $26,800 $26,500 $26,000 $22,000
Council employees 51 403 428 56
3.3 Three waters service
The ‘three waters’ refers to the provision of drinking water, wastewater and stormwater services. These
services are largely provided by the Central Hawke’s Bay District, Hastings District, Napier City and Wairoa
District Councils. Hawke’s Bay Regional Council has no direct role in the delivery of three waters services
except in a number of overlaps between land drainage and urban stormwater.
The three waters services are critical to the communities they serve. They link to almost all the economic,
social, cultural and environmental outcomes of the individual councils.
While the Councils’ 30-year infrastructure strategies are structured differently there are some common
themes that emerge in relation to the three waters. Those are shown in Figure 3 below, with a summary set
out in Appendix A.
2 Ibid
3 www.localcouncils.govt.nz – key financial statistics (2017)
Morrison Low 6Figure 3 Key themes for three waters (from 30-year infrastructure strategies)
Demand and Growth Asset Condition and
• requiring extension to Performance
existing networks and/or • renewal of infrastructure
supply challenges (age, condition)
Resilience Risk and compliance
• safety and security of water
• impact of floods, slips,
supply, ability of stormwater
coastal inundation,
and wastewater systems to
inflitration)
meet standards
Table 2 Region wide summary of three water assets
Water Wastewater Stormwater
Length of pipe (km) 1,441 1,082 760
No of reservoirs 101 n/a n/a
No of pump stations 35 n/a 24
No of wastewater pump stations n/a 115 n/a
Average age of pipes 36 47 46
No of treatment plants 4 33 13 n/a
Table 3 Region wide summary of three water customers
Water Wastewater Stormwater
No. of serviced properties 55,664 52,479 52,068
Population served 129,408 127,917 126,835
Communities served 26 24 n/a
Serviced Area (ha) 1,322,900 948,260 1,271,000
4 The size of treatment plants varies from small, low complexity to large, complex plants. Differences would be recognised in the
valuations of the treatment plants.
Morrison Low 7Figure 4 Region wide summary of three water asset condition (by length)
3.4 Funding and financing
Financial information for the delivery of three waters was provided by all Councils and supplemented with
data from long term plans and annual reports where necessary. The total annual operating expenditure and
rates revenue are outlined in the table below, along with the percentage of three waters to total council
operating expenditure and rates revenue. This data is sourced from 2018 annual reports.
Table 4 Three waters key financial information
Central Hawke’s
Hastings Napier Wairoa
Bay
Rates revenue $6,209,000 $15,864,000 $14,461,000 $2,790,000
% of Council total 32% 22% 27% 23%
Operating costs
$7,102,000 $31,942,000 $20,467,000 $4,914,000
including depreciation
% of Council total 22% 28% 20% 18%
Average three waters
$1,798.02 $773.30 $752.50 $1,265.75
residential rate 5
5 Based on sum of average weighted residential rate from funding impact statements (2018 LTPs).
Morrison Low 8There is a clear difference, not just in absolute terms but in per ratepayer costs, between the large councils
(Napier and Hastings) and the smaller rural councils (Wairoa and Central Hawke’s Bay).
The way in which these costs are recovered also differs across the Councils, as outlined in the table below.
Table 5 Council approaches to three waters charges
Water Wastewater Stormwater
District wide targeted rate
Targeted, undifferentiated
Central Hawke’s Bay Metered water for District wide targeted rate
rate on catchment area
extraordinary users
Targeted rate differentiated
District wide targeted rate. for properties in Waipatiki
Hastings General rates
Metered for high users Wastewater treatment 20%
funded by UAGC
District wide targeted water
rate
Targeted rate differentiated
Targeted fire protection rate
Napier for properties in Bay View General rates
differentiated based on
property use
Metered for high users
Targeted rate differentiated
Targeted rate differentiated Targeted rate differentiated
Wairoa by supply area
by supply area by urban area
Some metered properties
These differences also flow into the Councils’ approaches to funding asset renewal and depreciation. The
table below outlines the approach to renewals funding for each council.
Table 6 Council approaches to funding renewal and depreciation
Water Wastewater Stormwater
Rate fund renewals Rate fund renewals Rate fund renewals
Central Hawke’s
Borrow for large capital Borrow for large capital Borrow for large capital
Bay
expenditure expenditure expenditure
Don’t fully fund
Don’t fully fund depreciation, depreciation, rates fund
Hastings Fully fund depreciation renewals funded from a mix of $750,000 for renewals, if
debt and rates not required used to repay
debt
Fully fund planned renewals Fully fund planned renewals Fully fund planned renewals
Napier
rather than depreciation rather than depreciation rather than depreciation
Fund depreciation unless Fund depreciation unless asset Fund depreciation unless
Wairoa asset was debt funded (then was debt funded (then fund asset was debt funded (then
fund debt servicing cost) debt servicing cost) fund debt servicing cost)
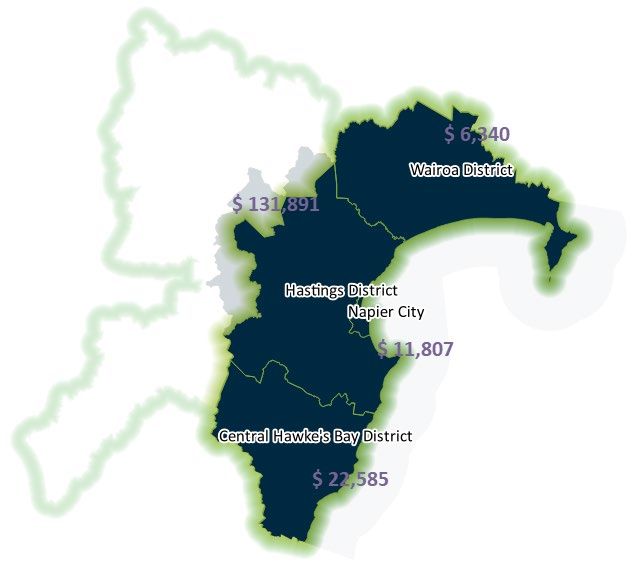
Morrison Low 9The differences in approach to funding renewals and other capital expenditure impact the levels of debt
carried by each council. The charts and figures below show the Councils’ total debt, debt to asset, and debt to
revenue ratios respectively. The chart data is based on projected debt levels in 2019/20, and in addition to
being reflective of differences in funding and financing policies, also demonstrates differences in level of
investment.
Figure 5 Total three waters projected debt across the Hawke’s Bay (2019/20 budgets) - $000s
Morrison Low 10Figure 6 Three waters debt to asset ratio
25%
20%
15%
10%
5%
0%
Central Hawkes Bay Hastings Napier Wairoa
Figure 7 Three waters debt to revenue ratio
600.00%
500.00%
400.00%
300.00%
200.00%
100.00%
0.00%
Central Hawkes Bay Hastings Napier Wairoa
The charts demonstrate a wide variation in the Councils’ approach to managing debt.
Morrison Low 113.5 Human resources involved in three waters services
Human resources information for the delivery of three waters services has been provided by Central Hawke’s
Bay, Hastings, Napier and Wairoa. A summary of the Council staff involved for each territorial authority is
shown below. The organisational structures are shown at a high level to show the relationship between the
three waters’ team(s) and the other infrastructure services. Support functions such as finance, human
resources, planning, information technology and customer services are not shown. A key to the charts is
shown below.
3W Operations
Team shared with other Other infrastructure teams
Dedicated 3W team
infrastructure services
3.5.1 Central Hawke’s Bay District Council
In Central Hawke’s Bay, all three waters services are delivered through the Community Infrastructure and
Development department, with dedicated three waters operations and programme teams, as well as a shared
asset strategy team with other council assets. The total team comprises six dedicated water specialists. There
is only one employee who is shared across water and other assets, as well as the General Manager of
Community Infrastructure and Development.
Figure 8 Central Hawke’s Bay District Council three waters team structure
CEO
GM Community
Infrastructure and
Development
Other infrastructure
3W Operations 3W Programme Asset Strategy
teams
Morrison Low 123.5.2 Hastings District Council
Hastings’s structure is the most clearly delineated by asset class, with one three waters team covering asset
management, capital works, operations and assurance. There is not the same degree of overlap with other
infrastructure as in the other councils.
Figure 9 Hastings District Council three waters team structure
CEO
Director – GM Asset
Capital Projects Management
Capital Projects 3W Manager
3W Asset 3W Capital 3W Services
3W Operations
Management works Assurance
3.5.3 Napier City Council
Napier has five teams delivering three waters services, reporting through to the Director of City Services and
the Director of Infrastructure. These are
• Asset Strategy – includes a dedicated three waters team and an asset management team and
development and standards team shared with transportation and parks, reserves and sportsgrounds
• Design and Projects – providing internal design and project management services across all of
Council’s assets
• Environmental Solutions – providing environmental compliance services
• City Services Management Accounts – providing accounting, procurement and administration support
to the City Services team (which is wider than three waters)
• City Operations – providing operations of the water, wastewater and drainage networks and
treatment plants, as well as transfer station operations.
The Napier service delivery model has a high degree of in-house services with a higher proportion of
employees being functional specialists (e.g. asset management, capital projects) rather than asset specialists.
The size of Napier’s network allows for more specialised roles within the Council.
Morrison Low 13Figure 10 Napier City Council three waters team structure
CEO
Director Infrastructure Director City Services
3W Operations
Asset Strategy Design and Projects
Management Accounts
3W
Other infrastructure
teams
3.5.4 Wairoa District Council
Wairoa’s water services are provided through the Community Assets and Services team. Due to the small size
of Council, there are often only one or two positions for each function, with these individuals responsible for
all asset classes. Wairoa has two dedicated three waters positions, with another five individuals providing
support on a part-time basis.
Morrison Low 14Figure 11 Wairoa District Council three waters team structure
CEO
GM Community Assets
and Services
Other infrastructure
Water treatment Projects
and property teams
3.5.5 Hawke’s Bay Regional Council
Hawke’s Bay Regional Council has no direct role in the delivery of three waters services except in a number of
overlaps between land drainage and urban stormwater. A small overlap of services occurs in the provision of
stormwater services to urban customers through the use of drainage networks owned, operated and
maintained by Hawke’s Bay Regional Council. There are also very small areas of reverse overlap where a
district council operates natural streams or manmade drains as part of a greater stormwater service to their
customers.
The Regional Council’s in-house Works Group undertakes the significant share of scheme maintenance and
minor capital works for the land drainage schemes. The Works Group also undertakes work on a commercial
basis for Napier, Hastings and Wairoa.
3.5.6 Relative scale of the three waters service
The number of employees directly involved in delivering water services varies, from less than ten in Central
Hawke’s Bay and Wairoa, through to 80 at Napier. This represents both the size of each council’s three waters
network, and the service delivery model utilised at each council. The number of full-time equivalent staff
(FTEs) involved in the three waters delivery is generally lower than the number of employees as some
employees work across a number of different council assets, not only three waters.
These figures exclude management and corporate support roles that are shared with other council areas. All
three waters teams make use of centralised finance, human resources, information technology and customer
services teams. The only exception to this is the dedicated management accounting team supporting the City
Services division at Napier. Customer services is an important support function for three waters provision,
with 24-hour contact centres necessary to allow rapid response to high priority incidents.
Note, the Napier figures are much higher due to the in-house operations team.
Morrison Low 15Figure 12 Number of employees and full-time-equivalent employees in each council’s water team(s)
Central Hawke's Bay Hastings Napier Wairoa
Number of employees in water team(s) Number FTE in waters team(s)
3.5.7 Service delivery models
The different service delivery models are illustrated in the tables below.
Table 7 Internal delivery of three waters services
Central Hawke’s Bay Hastings Napier Wairoa
Dedicated Three
Asset management Across all assets Across all assets Across all assets
Waters
Dedicated Three Dedicated Three
Capital projects Across all assets Across all assets
Waters Waters
Dedicated Three Dedicated Three Dedicated Three Dedicated Three
Operations
Waters Waters Waters Waters
Table 8 Extent of in-house delivery and outsourcing for three waters
Central Hawke’s Bay Hastings Napier Wairoa
In-house with
Reticulation O&M Outsourced Outsourced specialist contract Outsourced
support
In-house with
In-house with
Treatment O&M Outsourced specialist contract Outsourced
contract support
support
In-house with
Design/project
Professional Outsourced on an as specialists Outsourced on an as
management largely
Services required basis contracted as required basis
outsourced
required
Morrison Low 16We note the following expiry dates for the term contracts:
• Hastings Operations and Maintenance and Professionals Services contracts: June 2020
• Central Hawkes Bay Operations and Treatment contract: Dec 2023
• Wairoa three Waters Operations and Maintenance contract: (2 + 2 +2)
3.5.8 Scale relative to council size
The proportion of council staff directly involved in the delivery of three waters varies 6, from 5% in HDC to 14%
in NCC. This is driven by the different delivery models including
• the proportion of in-house delivery versus outsourcing, and
• the use of either dedicated functional teams (e.g. asset management, capital works) versus teams
dedicated to the various asset types (e.g. water, transport).
Figure 13 Proportion of employees and proportion of FTEs involved in delivering three waters services
16%
14%
12%
10%
8%
6%
4%
2%
0%
Central Hawke's Bay Hastings Napier Wairoa
% staff delivering water services % FTE delivering water services
The proportion of the Councils’ full-time equivalent staff delivering three waters services varies slightly from
the proportion of employees. In Napier and Wairoa, the proportion is lower reflecting the higher number of
employees who are engaged in three waters delivery as well as other activities (e.g. transport). In Central
Hawke’s Bay and Hastings, the proportion is higher due to the presence of a dedicated three waters team. To
a lesser extent, these figures also reflect the different proportion of part-time employees at each council.
This can be further seen in the proportion of three waters expenditure on salaries and wages when compared
to other operational expenditure. This varies from 6% in Wairoa to 21% in Napier. Equally it shows through
the significant difference between other expenditure which varies from 55% in Wairoa to 21% at Napier.
Other expenditure includes contractors, consultants, insurance, finance costs, potentially some maintenance
or small repair costs, electricity, monitoring, etc. All the Councils will have a different mix of costs in that
category depending on how they allocate and code expenses, and the extent to which they contract out
services. Figure 14 provides a demonstration of the different approaches that the Councils use to deliver the
services.
6 Note all figures exclude corporate services and customer services staff supporting three waters delivery.
Morrison Low 17Figure 14 Breakdown of three waters expenditure
100%
90% 21%
34%
80% 41%
Percentage of total expenditure
55%
70% 21%
60% 9%
8%
50% 15%
23%
18% 6%
40%
30% 19%
20% 44%
34% 33%
10% 20%
0%
Napier Hastings Central Hawke's Bay Wairoa
Depreciation Overhead Salary and wages Other expenditure
3.5.9 Culture
Different cultures exist within the four territorial authorities. This is partly driven by the different size of the
organisation, with 552 employees at Napier versus 66 at Central Hawke’s Bay. This impacts the depth of
corporate support such as the provision of dedicated water or infrastructure support roles e.g. infrastructure
management accountants. In the smaller councils, officers are required to cover a number of different roles
and are more likely to be generalists, while there are more specialists within the larger councils. Examples of
specialists include a dedicated Contract Manager in Hastings and a Drinking Water Quality Lead and Network
Control Systems Engineer in Napier. The different delivery models are important to allow the Councils to
effectively and efficiently deliver services to their communities.
There are many other elements to culture including the level of customer focus, the degree to which the
council is risk adverse, the willingness to work collaboratively across departments, willingness to embrace
new technology and solutions to become more efficient and effective. There will naturally be differences
between the Councils and differences in culture may become relevant if changes are made to the current
service delivery model.
The culture also reflects the different urban or rural nature of the region as well as the key community
priorities. The extent of in-house delivery versus outsourcing will also impact the culture of the team. A
number of the Councils have had restructures in recent years and the HDC team has recently been through a
significant period of change with the Government Inquiry into Havelock North Drinking Water.
Most of the councils have some very long-serving water services employees with tenures exceeding fifteen or
twenty years.
Morrison Low 18This means that there is significant knowledge and expertise that exists within the water services teams. In
some cases, however, the expertise and knowledge which has been built over years resides with single
individuals in specialist roles.
Workforce risks identified by the Council’s include aging workforce demographic, the need to mitigate
potential loss of expertise through resignation/retirement, and the current tight labour market for systems,
operations and water quality engineers and drinking water specialists. We note that structural engineers,
construction project managers (roading and infrastructure) are on the NZ Immigration Skills Shortage List.
3.5.10 Employment terms and conditions
A mixture of individual employment agreements and collective agreements are used by the Councils, with
varying terms and conditions. Specifics have not been provided for confidentiality reasons, however
differences in terms and conditions include
• annual, sick and long service leave allowances
• provision of vehicles, terms of use and corresponding salary sacrifice
• standard hours of work
• overtime and on-call provisions
• superannuation provisions
• redundancy provisions
– notice period
– redundancy compensation
– provisions regarding transfer of business to new entity including distance to location of new
position.
Provisions vary by employee as well as between the different councils, with numerous versions of
employment agreements depending on the tenure of employees.
3.6 Governance of three waters
3.6.1 Regional
Following the Havelock North water contamination event, a joint working group comprising members of
Hastings District Council staff, Hawke’s Bay Regional Council staff and Hawkes Bay District Health Board staff
was established to implement the initial recommendations. Napier City Council staff subsequently joined the
working group.
Subsequently a joint committee, the Hawke’s Bay Drinking Water Governance Joint Committee was formerly
established under the Local Government Act to provide governance oversight and direction in a range of
drinking water related matters across the region. The joint committee has members from
• Hastings District Council
• Hawke’s Bay Regional Council
• Hawkes Bay District Health Board
• Central Hawke’s Bay District Council
• Napier City Council
• Wairoa District Council.
The Committee is Chaired by an independent member.
Morrison Low 193.6.2 Councils
The current arrangement within each council is that each of the four Territorial Authorities have standing
committees of council that have differing responsibilities and oversight of three waters.
• Wairoa District Council – Infrastructure Committee where the committee’s role is one of oversight,
reviewing plans, policies and projects and making recommendations to Council on matters that
include the three waters.
• Hastings District Council – Has both a portfolio leader “Our Water” to provide leadership, and a
Works and Services Standing Committee with a broad range of delegated authority “to exercise
functions, duties and powers” within approved budgets of LTP/AP on matters which include the three
waters.
• Napier City Council – Strategy and Infrastructure Committee whose role is to provide leadership,
develop policy, govern and make recommendations to Council on matters which include the three
waters.
• Central Hawkes Bay District Council – Finance and Planning Committee role is to support Council in
preparing key planning documents such as the LTP and AP, assess current and future projects and
review policies on matters which include the three waters.
Ultimately however, in each case Council provides the governance of the three waters.
3.6.3 Involvement of Māori in governance of three waters
Each of the Councils has one or more Māori standing or advisory committees.
• Hawkes Bay Regional Council – Hawke’s Bay Regional Council Regional Planning Committee 7 and
Māori Committee
• Wairoa District Council – Wairoa Māori Standing Committee
• Hastings District Council – Hastings Māori Joint Committee
• Napier City Council – Napier Māori Consultative Committee
• Central Hawkes Bay District Council
While none of the committees have specific three waters responsibilities, their terms of reference or charters
typically have broad ranging roles including advising the Council, considering and providing leadership on
matters of importance to Māori and tangata whenua. Generally, the role of the committees is to make
recommendations to Council but there are some cases where they are delegated decision-making powers e.g.
Hastings for the allocation of Marae Development grants (within approved budgets).
7 The Regional Planning Committee was established under the Hawke’s Bay Regional Planning Committee Act 2005 with specific
responsibilities relating to the Resource Management Act
Morrison Low 204 Water
The table below summaries the major issues and challenges for the Councils relating to the water service.
Table 9 Major water issues (as identified by the Councils)
Central Hawke’s Bay Hastings Napier Wairoa
Priorities Challenges Priorities Challenges Priorities Challenges Priorities Challenges
Meeting Drinking
Water Standards Accessing sufficient
Development and Water quality due to Water leak
compliance. Changing and appropriate Water leak
implementation of Resourcing the clarity, management
Particularly creating environment with information for management (Wairoa
the Source Water Strategy microbiological, (Wairoa and Tūai)
and implementing meeting the Drinking strategic planning. and Tūai) due to
Protection adequately chemical due to ageing
effective and Water Standards (models, masterplans, ageing infrastructure
Strategy contamination. infrastructure
approved Water strategies etc.)
Safety Plans
Organisational
Asset knowledge.
capacity to deliver
Lack of asset data
Upgrading water capital plan (projects
Creating a second Predicting growth accuracy and
treatment team, engineering Secure, safe water Maintaining secure,
supply for Waipukurau and where growth Long term Aquifer completeness for all
facilities and scoping. Constrained river intake (major safe water river intake
to improve capacity will impact on our health monitoring 3-W laterals
reticulation local capacity to do bank erosion) (major bank erosion)
and resilience networks networks. Above
network work (e.g. NCC Depot
ground inventory is
and external
only at high level.
contractors).
Design and
Management and Water demand.
construction of new Changing
Ensuring network development of Unmetered supply New water supplies Ageing infrastructure
treatment plants for compliance and
capacity to meet backflow and therefore no (Blue Bay, difficult to fund due to
Pōrangahau and regulatory
growth prevention disincentive to high Mahanga) economy of scale
Takapau to remove framework
programme consumption
iron and magnesium
Morrison Low 214.1 Assets
4.1.1 Water supplied and consumed
The figure below demonstrates the populations served, water supplied and consumed by each of the
Councils respectively. Also depicted are the relevant consents; all consents are for total water take. The
difference between the amount produced and the amount consumed is the unaccounted-for water. In this
case, it is largely assumed to be network losses and of a much smaller scale, the unauthorised users of
water.
Figure 15 Water supply service key information 8
1.7 million m3 5.8 million m3
4,900 0.9 million m3 2032
14 million m3 16 million m3
11 million m3 2023 – 2040
58,445
10 million m3 20 million m3
8.1 million m3 2037
57,660
2.4 million m3 .1- 3 million m3
8,403
1.9 million m3 2028 - 2034
Bulk water supplied (per year) Consent Volume
Water consumed (per year) Consent Expiry
8 Wairoa consumption estimated using results reporting against DIA Performance Measure 2: Percentage of real water loss.
Morrison Low 224.1.2 Asset information
The figures below set out information about the number and type of assets involved in the water supply
service. The type of pipe material and age of the assets is also set out. This information begins to highlight
the differences between the respective councils’ networks.
What follows in the next sections is a comparison of the condition of the network and comparison of the
failure rates in the network.
Figure 16 Water pipe length
700
600
500
Pipe length (km)
400
300
200
100
0
Napier Hastings Central Hawkes Bay Wairoa
Figure 17 Pump stations and treatment plants
20
18
16
14
12
10
8
6
4
2
0
0 0 0 0
Pumpstations Treatment Plants
Morrison Low 23We note that treatment plants can vary in scale from small scale Chlorine dosing units at bore to full scale,
complex water treatment plants.
The age of each council’s watermains is shown below, with ages of some pipes exceeding 100 years. There is
a significant length in the 40 – 45 year age bracket for all four councils due to urban expansion in the 1970s.
Wairoa in particular noted the impact of aging infrastructure as one of its key challenges for its water
network.
Figure 18 Age profiles of water networks (watermains)
Central Hawke's Bay Napier Hastings Wairoa
25
Kilometres
Installed Pipe Length (total watermain network)
20
15
10
5
0
0 20 40 60 80 100 120
Age (years)
As expected, due to the age profile of the network, there is a variety of materials currently in place. Figure
19 shows the composition of the water network by pipe material with the different pipe types explained in
Appendix B. The type of pipes that make-up of each council’s water network is relevant due to the different
requirements for repair and replacement of each pipe type. We note that each council’s forward program
should take into account the different types of pipes within its network.
Morrison Low 24Figure 19 Network composition by material type
Network composition by material type
AC Cast Iron PE PVC Steel Other
100%
90%
Percentage of overal watermain network
80%
70%
60%
50%
40%
30%
20%
10%
0%
Central Hawke's Bay Napier Hastings Wairoa
4.1.3 Water Reservoirs
There is also differences in the Council’s water storage capacity. This is show by reference to the number of reservoirs
then also the capacity in cubic metres and hours of supply. Central Hawke’s Bay has a system characterised by a lot of
smaller schemes and a large number of reservoirs. Napier and Hastings have a smaller number of reservoirs supporting
larger networks servicing bigger populations.
Figure 20 Number of reservoirs
60
50
40
No. of storages
30
20
10
0
Napier Hastings Central Hawkes Bay Wairoa
Morrison Low 25The Councils’ water storage in the reservoirs also varies. Hastings has five hours (with Napier over 40 hours).
Hastings storage is at a low level (five hours) and low in comparison to the other councils but an explanation
from the AMP states
“The primary Hastings and Havelock North reservoirs only have approximately 5 hrs of storage
during peak summer flows, however this is on the basis that Council relies on groundwater stored in
the underground aquifers rather than investing in above ground storage. A greater reliance is
therefore placed on the ability to extract water to meet peak demands.”
Figure 21 Reservoir storage
50 35,000
45
30,000
40
35 25,000
30
20,000
Cubic metres
25
Hours
15,000
20
15 10,000
10
5,000
5
0 -
Central Hawkes Bay Hastings Napier Wairoa
Hours Cubic metres
Morrison Low 264.1.4 Asset Condition
A comparison of the respective condition of each council’s water services assets is set out below. While each council has different approaches to rating their assets and
different confidence levels in the data on which the assessment is based there are significant differences in the condition of the assets across the group of councils.
Figure 22 Water asset condition (by length)
Central Hawke's Bay Hastings
Excellent Excellent
0%
1%
22% 9% 4%
Good Good
11%
Average Average
8%
15% 61%
69% Poor Poor
Very Poor Very Poor
Napier Wairoa
1%
Excellent
Excellent
6% 0%
23% Good
15% Good
35%
42% Average
Average
Poor
Poor
Very Poor
55% Very Poor 23%
Morrison Low 274.1.5 Analysis of pipe failures in the water network
An initial high-level statistical analysis of the water network was undertaken by reference to the number of
failures on each Council’s networks over a four-year period. The purpose of the analysis is to understand the
actual performance of the network as compared to the condition of the network, which has been considered
above.
The analysis found that there was no direct correlation between network composition, age and annual faults
per kilometre. We note that Central Hawke’s Bay was not able to provide failure data. A summary of the
analysis is set out below with further detail (including analysis of failure by pipe type) is set out in Appendix
B.
Overall, Napier has the lowest failure rates we note that this is based on a limited data sets so no strong
conclusions should be drawn and Napier has one of the oldest networks and the second most AC pipes in
their network. The results from the Councils who provided failure data linked to material type show no
consistent pattern between material type and failure rates, though they do show decreasing failure trends in
the worst material type, suggesting problems are being addressed as they arise.
Figure 23 Annual faults normalised by network length (all material types)
0.400
0.350
0.300
Recorded Faults per km
0.250
0.200
0.150
0.100
0.050
0.000
2006 2008 2010 2012 2014 2016 2018 2020
Wairoa Napier Hastings
Further observations
Central Hawke’s Bay has a similar age profile to Napier, but with more PVC and less AC installed. Hastings
has the youngest average network age and the highest pipe length under 25 years old, implying there has
been an active replacement programme (or new growth) in the area. The other three councils all have
watermain ages peaking around the 40-year mark, which is typical of most New Zealand councils.
Morrison Low 28Hasting’s younger network overall does not translate into less faults per kilometre, with Napier having less
recorded faults over the 2014-2018 period. In fact, Napier has the lowest recorded faults per kilometre yet
has the second oldest average network age and the second highest percentage of AC installed.
Wairoa has seen a sharp decline in the number of recorded faults per kilometre, particularly in AC
watermains which make up 40% of their network, bringing down their total faults per kilometre. The overall
age profile of the Wairoa network does not suggest an aggressive replacement programme has been
underway, so this reduction is likely to be due to the targeted replacement of mains causing multiple
failures.
The number of annual faults per kilometre has been relatively consistent in Napier and Hastings over the
time period supplied. Hastings may be trending upwards, with an increase in failures in PVC and AC, but the
trend is not yet well established.
Fault data by material is limited to two councils, Wairoa and Hastings. Comparing these two:
• Wairoa AC and Hastings steel watermains both have above ‘average’ annual faults per kilometre and
both with a decreasing trend over time, suggesting these issues are being or have been addressed by
the respective councils.
• PVC generally has the lowest annual fault rate per kilometre, though in Wairoa it is comparable to
steel. This may because of the relative urban/rural composition. Elsewhere we have seen rural PVC
with poor installation techniques, pull down overall PVC performance.
4.1.6 Performance and levels of service
The Councils have varying levels of service and performance against those targets. Each council’s targets for
the Department of Internal Affairs (DIA) performance measures and their actual performance against these
is set out in the table below this brief summary.
All the Councils currently meet the DIA mandatory performance measures for compliance with drinking
water. Targets for water loss (network maintenance) range from 20% to 30%. Wairoa has a target of 30%
and an estimated current level of 50%, Hastings is close to achieving its target of 20% and Napier meets its
target of 22%. Central Hawke’s Bay however records zero water loss against a target of 30%.
Demand management (water use per person) targets and performance against those targets varies
considerably. Targets range from 400 to 666 litres per person per day with actual performance ranging from
current usage of 350l/p/d 9 to a high of 1420l/p/d.
Response times are fairly similar and all Councils report meeting these.
Customer satisfaction criteria targets vary significantly but show Councils are meeting these.
9 WSP Estimate based on information provided by the Councils
Morrison Low 29Table 10 DIA performance measures: water (17/18)
Central Hawke’s Bay Hastings Napier Wairoa
Current
DIA performance measurement Target Current Actual Target Target Current Actual Target Current Actual
Actual
DIA Non-financial performance Measure 1: (safety
‐ Otāne100%
of drinking water) ‐ Waipawa100%
The extent to which the local authority's drinking
‐ Waipukurau100% a) Target
‐ Takapau in achieved a) Not achieved
water supply complies with:
100% progress 100% 100% 100% 100%
a) part 4 of the drinking-water standards (bacteria b) Target not b) Not achieved
compliance criteria), and ‐ Kairakau in
progress achieved
b) part 5 of the drinking-water standards
‐ Pōrangahau in
(protozoal compliance criteria).
progress
Estimate 50% -
based on
DIA Non-Financial performance Measure 2:
nightflows,
(maintenance of the reticulation network)
Water Loss
The percentage of real water loss from the local
30% 0% 20% 21% 22% 18.8% 25% Management
authority's networked reticulation system
Plan in progress
(Including a description of the methodology used
to better
to calculate this).
understand
water loss
DIA Non-Financial performance Measure 3: (fault a) 1 hour for a) 1 hour for
response times) Wairoa/Fras Wairoa/
Where the local authority attends a call-out in ertown and Frasertown
response to a fault or unplanned interruption to 2 hours for and 2 hours
its networked reticulation system, the following other areas for other
median response times measured: a)1 Hour b) 4 hours from areas
a)Central Hawke’s Bay Hastings Napier Wairoa
Current
DIA performance measurement Target Current Actual Target Target Current Actual Target Current Actual
Actual
c) attendance for non-urgent call-outs: from the
time that the local authority receives
notification to the time that service personnel
reach the site, and c) 3 Days c) 2 Days c) 2 days and
c)4.2 Financial
The average water rates for the 2018/19 financial year are detailed below. The amount paid for water
services in Wairoa and Central Hawke’s Bay is higher than that of Napier and Hastings.
Table 11 Water charges
Central Hawke’s
Hastings Napier Wairoa
Bay
Average residential rate
$668 $357 11 $234 $698
for water 10
Detailed budgets for the 2019/20 year show significant variation across the region in the amount that
ratepayers are paying for water services.
Table 12 Water revenue
Central Hawke’s
Hastings Napier Wairoa
Bay
Total revenue from
$3,027,880 $10,938,000 $5,228,797 $2,442,037
targeted rates
Total revenue from
0 $83,000 0 0
general rates
Percentage of targeted
rates revenue from 14% 4.5% 11% 34%
metered water
These differences are also reflected in the cost for each council of water consumed and produced within the
district as shown in Figure 24 below. The differences between the cost produced and the cost consumed
again represents the unaccounted-for water which is predominantly network losses.
10 Weighted average across schemes
11 Plus contribution from general rates
Morrison Low 32You can also read