Gravel Resource Inventory (Issue 3) - Gravel Management Plan For Hawke's Bay Regional Council - Hawke's Bay Regional Council
←
→
Page content transcription
If your browser does not render page correctly, please read the page content below
Gravel Resource Inventory - Hawke’s Bay Regional Council

                                           Gravel Management Plan

                                  Gravel Resource Inventory (Issue 3)
                                                                 For

                                        Hawke’s Bay Regional Council

                                                            Prepared by

                                                          Murray Stevens

                                                                  And

                                                            Barry Larsen

                                                                                                    Page 1 of 77
11 August, 2015
Murray Stevens and Barry Larsen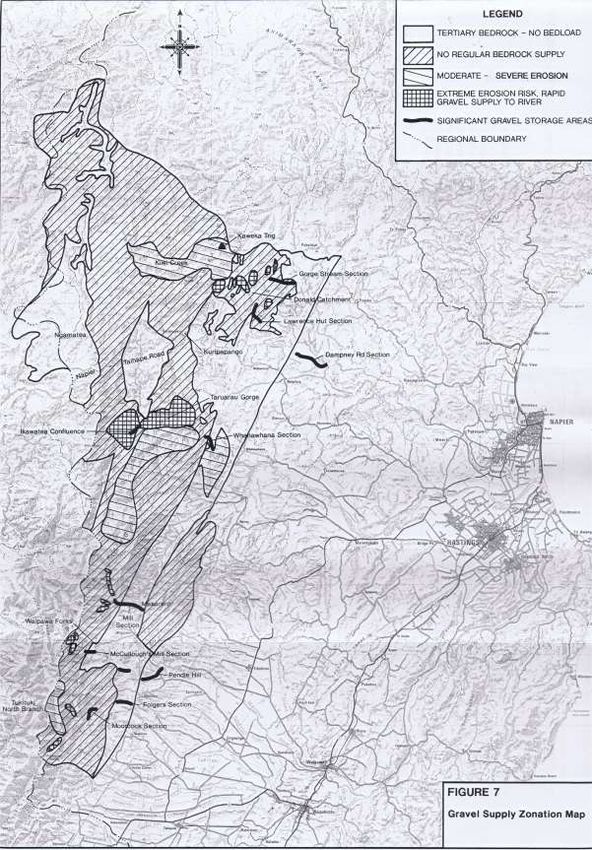
Gravel Resource Inventory - Hawke’s Bay Regional Council
Contents
EXECUTIVE SUMMARY ............................................................................................................................ 6
1.0 BACKGROUND ........................................................................................................................... 10
2.0 SCOPE AND OBJECTIVES............................................................................................................ 10
3.0 METHODOLOGY ........................................................................................................................ 11
3.1 Site Visits ............................................................................................................................... 11
3.2 Programmes/GIS ................................................................................................................... 11
3.3 Interviews.............................................................................................................................. 11
3.4 Literature research................................................................................................................ 11
4.0 RIVER CATCHMENTS AND GEOMORPHOLGY............................................................................ 12
4.1 General.................................................................................................................................. 12
4.2 Ruataniwha Plains ................................................................................................................. 12
4.3 Heretaunga Plains ................................................................................................................. 12
4.4 Northern Hawke’s Bay Hill Country ...................................................................................... 13
4.5 North Island Axial Ranges ..................................................................................................... 13
5.0 GEOLOGY................................................................................................................................... 13
5.1 Hawke’s Bay Regional Geology ............................................................................................. 13
5.2 Source Rock Geology............................................................................................................. 17
6.0 RESOURCE INVENTORY ............................................................................................................. 20
6.1 General.................................................................................................................................. 20
6.2 Assumptions, modelling parameters, limitations ................................................................. 20
7.0 RIVER BASED GRAVEL INVENTORY............................................................................................ 21
7.1 Ngaruroro River..................................................................................................................... 21
7.1.1 Base Case Grade Line .................................................................................................... 21
7.1.2 0.5m below Base Case Grade Line ................................................................................ 26
7.1.3 1.0m below Base Case Grade Line ................................................................................ 27
7.1.4 Discussion on Sustainability of Supply Issues ............................................................... 27
7.2 Upper Tukituki....................................................................................................................... 30
7.2.1 Base Case Grade Line .................................................................................................... 30
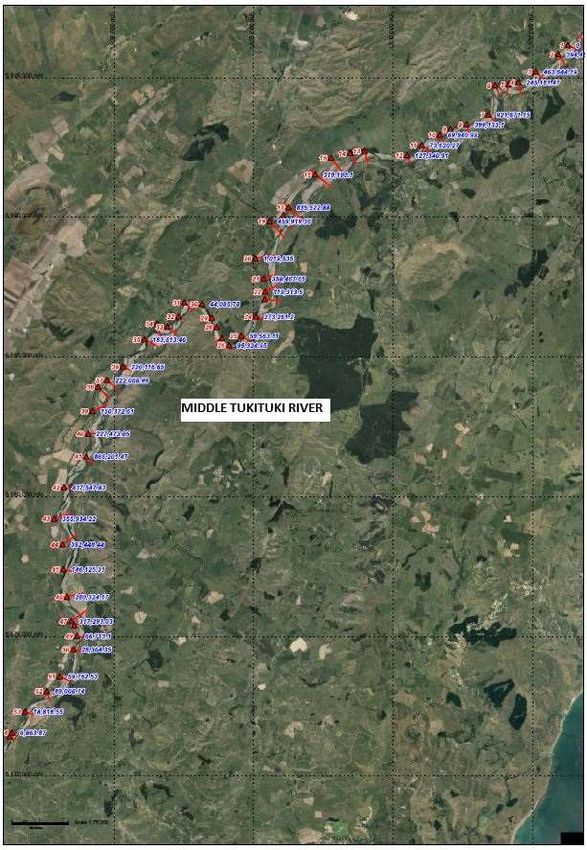
7.3 Middle Tukituki River ............................................................................................................ 34
7.4 Lower Tukituki River.............................................................................................................. 38
7.5 Waipawa River ...................................................................................................................... 42
7.6 Tutaekuri River ...................................................................................................................... 45
Page 2 of 77
11 August, 2015
Murray Stevens and Barry Larsen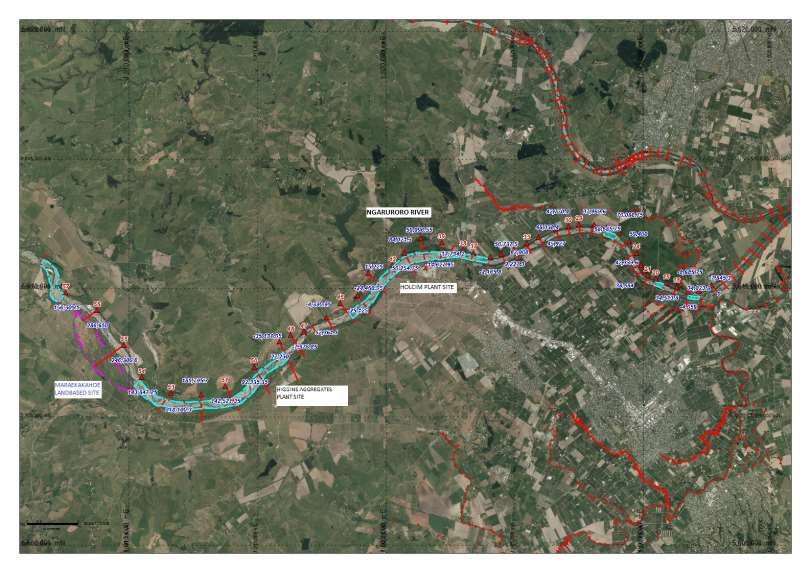
Gravel Resource Inventory - Hawke’s Bay Regional Council

                   7.7        Esk River ................................................................................................................................ 49
                   7.8        Mokaha River ........................................................................................................................ 49
                   7.9        Waiau River ........................................................................................................................... 49
                   7.10       Wairoa River.......................................................................................................................... 49
                   7.11       Other Rivers .......................................................................................................................... 50
                   7.12       Estimates of Resources Available for Extraction................................................................... 50
                8.0       LAND BASED GRAVELS .............................................................................................................. 51
                   8.1        Recent gravels ....................................................................................................................... 51
                   8.2        Terrace gravels ...................................................................................................................... 52
                9.0       HARD ROCK QUARRIES.............................................................................................................. 52
                   9.1        Limestone.............................................................................................................................. 52
                   9.2        Greywacke............................................................................................................................. 53
                10.0      AGGREGATE PRODUCTION ....................................................................................................... 53
                   10.1       Total Historic River Gravel Extraction Volumes .................................................................... 53
                   10.2       Current River based production by river .............................................................................. 53
                       10.2.1        Ngaruroro River............................................................................................................. 53
                       11.2.2        Upper Tukituki River ..................................................................................................... 56
                       11.2.3        Middle Tukituki River .................................................................................................... 57
                       11.2.4        Lower Tukituki River...................................................................................................... 57
                       11.2.5        Waipawa River .............................................................................................................. 58
                       11.2.6        Tutaekuri River .............................................................................................................. 59
                       11.2.7        Esk River ........................................................................................................................ 60
                       11.2.8        Mohaka River ................................................................................................................ 60
                       11.2.9        Waiau River ................................................................................................................... 61
                       11.2.10           Wairoa River.............................................................................................................. 62
                   11.3       Current land based................................................................................................................ 62
                   11.4       Future demand ..................................................................................................................... 62
                   11.5       Distances from plant and contract areas .............................................................................. 63
                   11.6       Aggregate product range ...................................................................................................... 63
                12.0 EXTRACTION, MINERALOGICAL AND GEOTECHNICAL CHARACTERISTICS OF RIVER BASED
                AGGREGATES ........................................................................................................................................ 64
                12.1      River Gravel Extraction.............................................................................................................. 64
                12.2      Mineralogical Characteristics.................................................................................................... 64
                12.3      Geotechnical Properties ............................................................................................................ 66
                13.0      LAND USE ZONING, CONSENTING AND ALLOCATION............................................................... 67
                                                                                                                                                        Page 3 of 77
11 August, 2015
Murray Stevens and Barry Larsen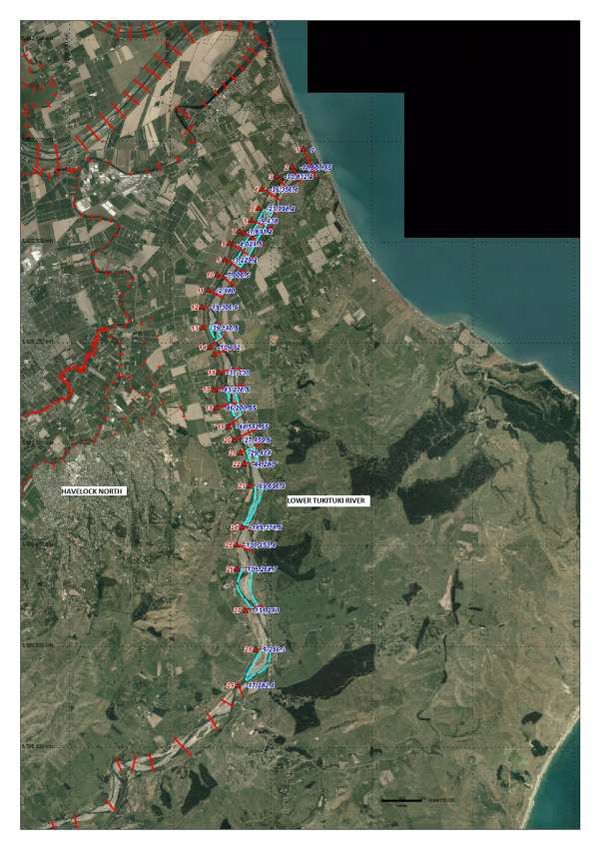
Gravel Resource Inventory - Hawke’s Bay Regional Council

                   13.1        Land Use Zoning .................................................................................................................... 67
                   13.2        Consenting and Allocation – Current Process ....................................................................... 67
                14.0       CONCLUSIONS AND RECOMMENDATIONS ............................................................................... 68
                15.0       ACKNOWLEDGEMENTS ............................................................................................................. 75
                16.0       DISCLAIMER............................................................................................................................... 75
                17.0       REFERENCES .............................................................................................................................. 75

                Figures
                Figure 1: Main catchments and geomorphic features of Hawke’s Bay (Lee et al 2011) ...................... 12
                Figure 2: Generalised geology of Hawke’s Bay (Lee et al 2011) ........................................................... 14
                Figure 3: Areas of major land slides and erosion in the axial ranges. (Source Black, 1992) ................ 16
                Figure 4: Main geological terranes in New Zealand. Hawke’s Bay highlighted, (Lee et al, 2011) ........ 19
                Figure 5: Ngaruroro River sectional gravel volumes ............................................................................. 21
                Figure 6: Plan of sectional volumes at grade line for Ngaruroro River and extraction areas. .............. 24
                Figure 7: Low Growth scenario if additional resource extracted upstream of current locations. ....... 25
                Figure 8: Medium to high growth scenario if additional resource extracted upstream of current
                locations. ............................................................................................................................................... 26
                Figure 9: Cummulative Gravel Supply (above grade line) vs. Cummulative Annual Extraction Rates in
                low growth demand forecast ................................................................................................................ 28
                Figure 10: Cummulative Gravel Supply (above grade line) vs.Cummulative Annual Extraction Rates in
                medium-high growth demand forecast ................................................................................................ 28
                Figure 11: Graph showing volumes above the extraction line for different reaches over time .......... 29
                Figure 12: Upper Tukituki Sectional Gravel Volumes ........................................................................... 30
                Figure 13: Map of Upper Tukituki River showing sectional resource volumes above grade line and
                resource extraction areas. .................................................................................................................... 33
                Figure 14: Aerial photograph plan of Tukituki River showing resource areas and section lines. ......... 35
                Figure 15: Middle Tukituki River Gravel Volumes................................................................................. 36
                Figure 16: Lower Tukituki gravel volumes by section line .................................................................... 39
                Figure 17: Lower Tukituki River sections and resource volumes. ......................................................... 41
                Figure 18: Waipawa River gravel volumes by section line .................................................................... 42
                Figure 19: Waipawa River section lines, design volumes and extraction areas ................................... 43
                Figure 20: Tutaekuri River gravel volumes by section line. .................................................................. 46
                Figure 21: Tutaekuri River gravel volumes at design and extraction locations. ................................... 47
                Figure 22: Higgins Land based gravel resource at Maraekakaho. ........................................................ 51
                Figure 23: Total recorded production of river gravels for Hawke’s Bay region .................................... 53
                Figure 24: Ngaruroro River annual extraction ...................................................................................... 54
                Figure 25: Ngaruroro River historic production and future demand growth, (low growth scenario)
                (source HBRC and Infometrics) ............................................................................................................. 55
                Figure 26: Ngaruroro River historic production and future demand growth, (medium to high growth
                scenario)................................................................................................................................................ 56
                Figure 27: Historic gravel production from Upper Tukituki River ......................................................... 56

                                                                                                                                                          Page 4 of 77
11 August, 2015
Murray Stevens and Barry Larsen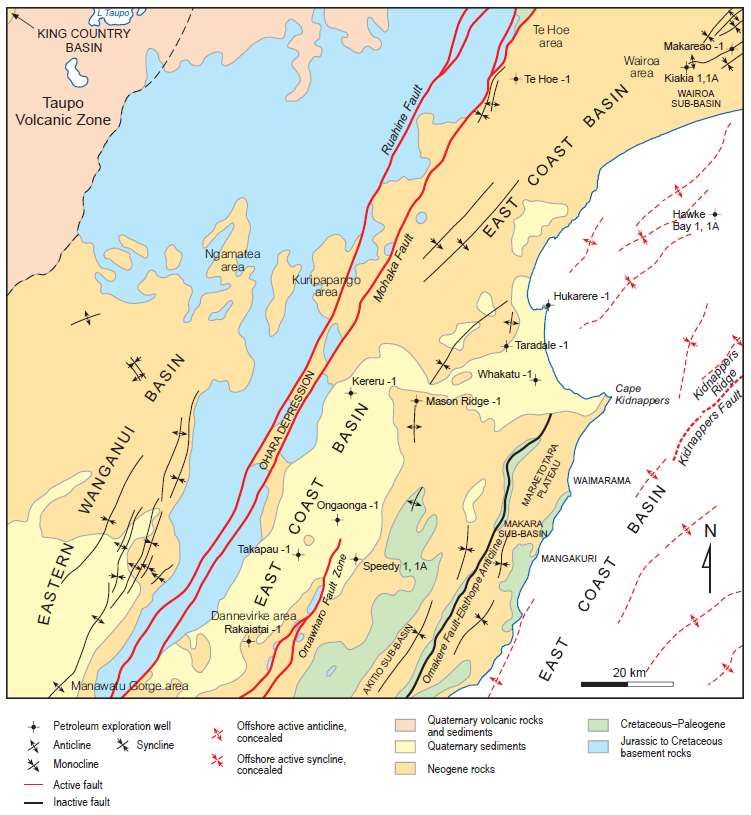
Gravel Resource Inventory - Hawke’s Bay Regional Council

                Figure 28: Historic gravel production from the Middle Tukituki River ................................................. 57
                Figure 29: Historic gravel production from the Lower Tukituki River .................................................. 58
                Figure 30: Historic gravel production from the Waipawa River ........................................................... 58
                Figure 31: Historic gravel production from Tutaekuri River ................................................................. 59
                Figure 32: Historic gravel production from Esk River ........................................................................... 60
                Figure 33: Historic gravel production from Mohaka River ................................................................... 60
                Figure 34: Historic gravel production from Waiau River ...................................................................... 61
                Figure 35: Historic gravel production from Wairoa River ..................................................................... 62
                Figure 36: Diagram of Mineralogical Characteristics of North Island aggregates, (Black, 2009) ......... 66

                Tables
                Table 1: Ngaruroro base case volumes by section line ......................................................................... 23
                Table 2: Upper Tukituki River Gravel Volumes By section at grade line, -0.5m and -1.0m below grade
                line......................................................................................................................................................... 32
                Table 3: Middle Tukituki gravel volumes by section line ...................................................................... 38
                Table 4: Lower Tukituki gravel volumes by section line ....................................................................... 40
                Table 5: Waipawa River gravel volumes by section line ....................................................................... 44
                Table 6: Tutaekuri River gravel volumes by section line....................................................................... 48
                Table 7: Summary table of available river gravel resources ................................................................. 50

                                                                                                                                                            Page 5 of 77
11 August, 2015
Murray Stevens and Barry Larsen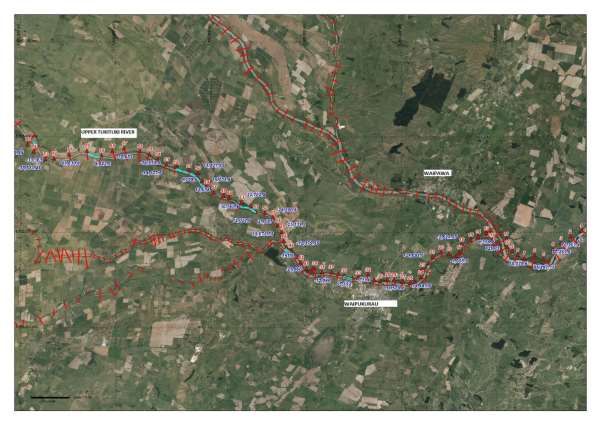
Gravel Resource Inventory - Hawke’s Bay Regional Council
EXECUTIVE SUMMARY
This report covers Issue 3 “Gravel Resource Inventory” identified as one of 13 key issues by Hawke’s
Bay Regional Council into ways of improving the council’s gravel management plan for the Region.
The key objectives of the study are;
Identification of resource locations, resource volumes available for potential extraction and
aggregate quality.
To identify and assess risks in gravel supply and quality.
Assist in determining the sustainability of the river based gravel resource.
Provide input into the gravel management plan.
The study methodology involved site visits to extraction sites and the main operations, compilation of
river production data from HBRC records and reports, compilation into a GIS, interviews with various
stakeholder groups including Hawke’s Bay Regional Council (HBRC), District Councils, the main
producers, individual roading contractors, contracting companies and a wider literature search into
aspects of the geology and aggregate quality.
The Hawke’s Bay region can be broadly divided into several physiographic regions that have distinct
features reflecting their underlying geology. The main physiographic regions that are of relevance to
the river gravel aggregate resources are the Ruataniwha and Heretaunga Plains and the North Island
axial greywacke ranges that lie to the west of the outwash gravels that form the plains.
The source rocks from the axial ranges belong mainly to the Torlesse type quartzofeldspathic
greywackes of the Kaweka Terrane as well as lesser contributions from the Pahau Terrane and
Waioeka Petrofacies that become more prevalent to the north. Kaweka Terrane greywackes in general
produce premium aggregates by the time they have been naturally abraded through fluvial processes
in the main river systems. They invariably have some laumontite veining which can have adverse
effects on aggregate if present in large quantities. Other gravels from the Pahau Terrane and Waioeka
Petrofacies are likely to have higher quantities of deleterious minerals.
Estimates of gravel sitting above the grade line in the Ngaruroro River show in the 2013-2014 year
there is an average net gravel resource availability of 2.56 million m3. Of this total there is
approximately 519,000m3 above grade line within the areas where the main extraction is occurring.
Assuming, based on gravel transport modelling an average addition of 170,000m3 per annum of new
gravel to the catchment and flowing through the extraction reaches suggests the areas of extraction
could reach grade line in 3.5 to 5 years. An additional 7 to 10 years of resource would be available
further upstream of current main extraction sites.
This scenario is at variance to other observations over time. Similar analyses based on gravel volume
data undertaken at particular time periods since 1977 produce similar results that show gravel
supplies would have run out by now.
Clearly this has not occurred and estimates are roughly the same now as in the past. This suggests
there are other inputs and refinements to the river modelling required to get an accurate estimate of
the sustainable extractable yield of gravel from the river.
It is essential that further study is carried out to determine the sustainable gravel extraction rate,
gravel transport rates and depositional site variation and grainsize variability over time.
Page 6 of 77
11 August, 2015
Murray Stevens and Barry Larsen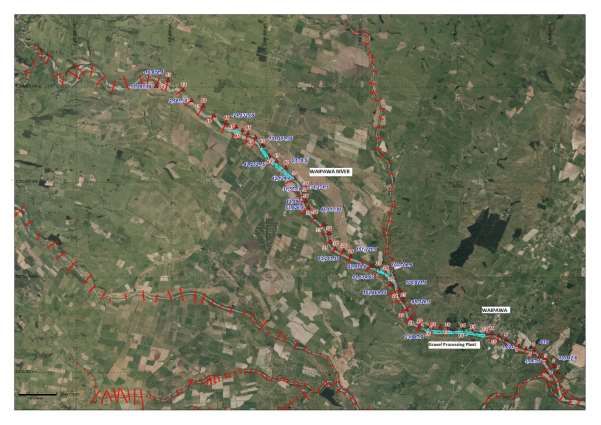
Gravel Resource Inventory - Hawke’s Bay Regional Council
If the scenario under the current analysis is correct then the implication is that aggregate supplies
could reach an unsustainable level in 3.5 to 5 years at the current sites with adverse implications for
aggregate producers and for flood control.
It is recommended that further detailed modelling is conducted to determine the drivers for gravel
supply and a more robust supply model developed.
To obtain more detailed data it is recommended:
To use lidar data and closely spaced survey sections, (250m apart) to generate a more accurate
model of the resource along with updated gravel size analysis on the surface and in depth
profiles to the depth limits that extractors are allowed to excavate to.
Assess the impact of hydrological and weather pattern changes on gravel transport. There is
a suggestion that there may be a decadal downward trend in volumes above grade line,
possibly due to changes in flood frequency and climate change.
Assess the geomorphology and geology of gravel source areas which may have changed since
the last survey was done in 1997.
Another issue is the conclusion there is or will be a gradual fining of gravel over time at the current
extraction sites due to selective targeting of coarser gravel in the river by extractors, possibly
compounded by reduced flood event frequency. There is a minimum size limit of around 30mm in
order achieve around 75% broken faces for sealing chip and premium base-course products. Currently
only approximately 50% to 60% of raw gravel extracted is utilised as saleable product for at least one
of the major producers.
Total net gravel resource above the grade line in the Upper Tukituki River are around 881,981m3 for
the 2013/2014 year. Actual recorded production of gravel from the Upper Tukituki has ranged
between 60,000 m3 in 2000 to a low of around 10,000 m3 in 2013. Current production is impacted by
one of the main producers ceasing gravel extraction.
Assuming production levels increase again to the average over the last 10 years of around 41,000 m3
and assuming that addition of new gravel to the system at least equivalent to that modelled for the
Ruataniwha Dam of between 140,000 m3 and 180,000 m3 for the other catchments feeding into the
Upper Tukituki then there should be adequate supplies for the long term in this portion of the river.
There is likely to be an issue with the build-up of gravel above grade line over time with dependency
on extraction, rate of movement of gravel through the system to lower reaches, flood event
frequency, aggradation rates etc.
The Middle Tukituki River potentially has large resources of gravel. Sectional data is available
however HBRC at this stage have not determined an appropriate grade line for this reach of the river.
Using estimates based on the most conservative scenario of using the 0.5m above Thalweg it can be
seen that there is potentially 14 million m3 of gravel available.
Morphological modelling is in progress for the whole Tukituki River utilising the GRATE simulation
programme. Once complete this will provide information on gravel supply and sustainability.
There is currently 9,246m3 of gravel above grade line at the design level in the Lower Tukituki River.
Page 7 of 77
11 August, 2015
Murray Stevens and Barry Larsen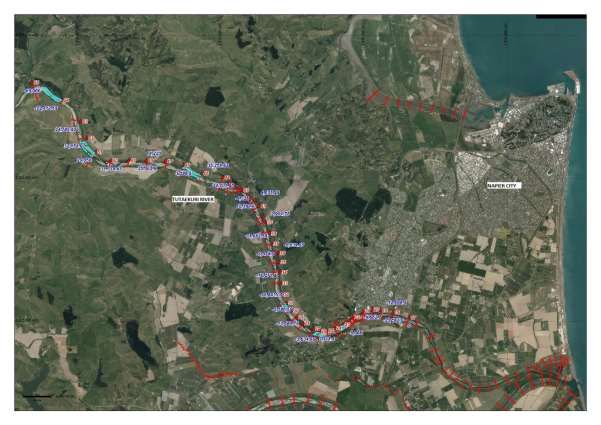
Gravel Resource Inventory - Hawke’s Bay Regional Council

                HBRC policy is to manage the resource sustainably taking into account that there has historically been
                over extraction in the Lower Tukituki River. It is the only major river system delivering gravel to the
                coast where northward longshore drift helps replenish gravel on the coast up to Napier and there is
                still a deficit of gravel in what is effectively a sink.

                The currently surveyed design volumes for the Waipawa River show a net volume of gravel above
                grade line of 1,509,935 m3. The lower reaches of the Waipawa River are at or just below grade line,
                while between Section lines 17 and 39 there is some 1,455,000m3 of gravel available.

                Average recorded production between 2003 and 2011 has been around 102,000m 3 per annum.
                Allocations for 2013-2014 are similar however the major operator here, has gone out of business.

                Estimates of sustainability of supply at the average of 100,000m3 per annum would see enough
                resource to last a minimum of at least 16 years before the grade line level is reached for the Waipawa
                River.

                Encouraging the aggregate industry to extract gravel from the Waipawa River at around the estimated
                sustainable rate is considered important for flood control management.

                Past over extraction of gravel on the Tutaekuri River now means only small volumes are available. To
                remain sustainable the current HBRC allocations of around 20,500m3 are appropriate.

                The Esk River has in the past been heavily over extracted. No major extraction is warranted here.

                Current (2013-2014) allocations for the Mohaka River (upper and lower) total approx. 100,000m3.
                Actual recorded production returns have averaged approx. 47,000m3 for the period 2003 to 2013.

                The majority of current production from fixed/mobile plant is in the lower reaches of the river and
                near the river mouth, and from the relatively small volumes involved it is concluded that there are no
                issues with the current extraction rates.

                The Waiau River produces generally small volumes which averaged 17,350m3 per annum from 2003
                to 2013. Much of the gravel is used for general road maintenance, forestry and by local contractors.
                Given the small volumes extracted and the likely subdued demand it is concluded there will no issue
                with sustainability of supply.

                Industry sources who extract gravel from this river also describe difficulties in obtaining premium
                product due to the presence of pumiceous silt and ‘papa rock’ where the gravel bed is thin above the
                Tertiary sedimentary basement.

                Recent gravels that lie outside the active river channels are potentially an important source of gravel
                in the future should extraction from the active river channels become restricted due to sustainability
                or other issues.

                At present there is thought to be only one consented land based extraction operation based near
                Maraekakaho on the Ngaruroro River, which is mining recent river gravels as opposed to the gravel
                pits in the raised terraces.

                Land based gravel pits form an important part of the overall aggregate supply to the region. Sourced
                from Quaternary aged gravel terraces of the Kidnappers Group, these are sometimes referred to

                                                                                                          Page 8 of 77
11 August, 2015
Murray Stevens and Barry Larsen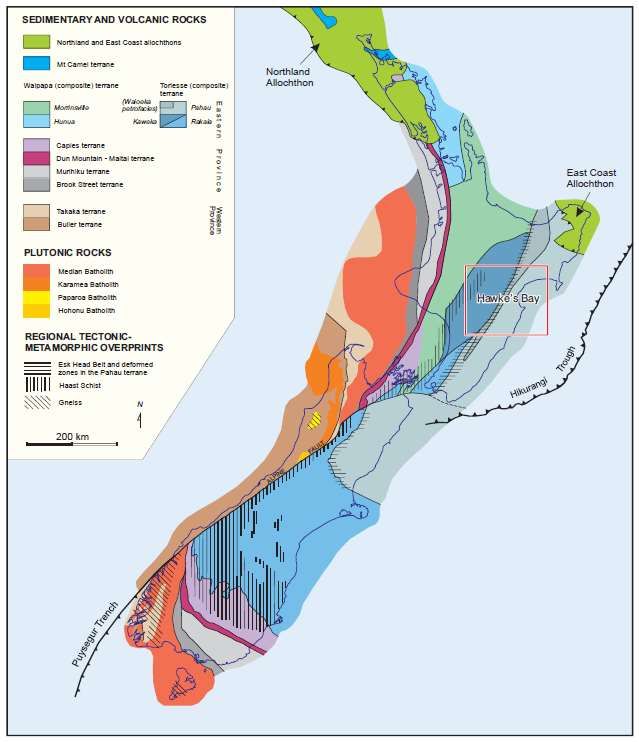
Gravel Resource Inventory - Hawke’s Bay Regional Council

                colloquially as red rock pits, and are typically slight to moderately weathered river terrace gravels
                uplifted above the main active river channels.
                They are used by the local construction industry, forestry roading, maintenance metal on unsealed
                roads and general roading maintenance and could represent about 25% of total gravel extraction for
                the region.
                Observations and industry feedback indicates that, for the large producers in particular on the
                Ngaruroro, with one exception, approximately 60% of the gravel, sand and silt excavated ends up as
                useable product. Minimum grain size for crushing is around 30mm to 40mm to ensure enough broken
                faces for chip and base course products. A certain amount of undersize is used for concrete
                aggregates, drainage products, fill etc, however, the large percentage that can’t be used for premium
                aggregate is stockpiled.

                Selective targeting coarser material is likely to result in a long term reduction in gravel grain size and
                could adversely impact on the economics of extracting from the lower reaches.

                It is recommended that in the areas of active gravel extraction a programme of pitting and/or shallow
                drilling be conducted to establish grainsize distribution through the resource areas in 3 dimensions.

                The gravel source rocks are mainly highly indurated zeolite facies metamorphosed quartzofeldspathic
                greywacke sandstones and argillites. Some elements of these are strongly veined with deleterious
                minerals such as the zeolite laumontite and some smectite, (swelling) clay minerals.

                Natural abrasion from gravel movement downstream winnows out most of the softer material.
                However zeolite and clay minerals or high sulphides can persist. Processing can remove these less
                desirable minerals however in some products such as GAP (general all passing) products the fines can
                concentrate deleterious minerals. Geotechnical testing usually detects issues however there is a lack
                of petrological data to establish baseline variability in the constituent rock types that make up the
                gravel resources from the different river catchments. It is recommended that baseline petrological
                and X-Ray diffraction studies be carried out on representative samples from each of the major
                extraction areas on each river.

                In terms of aggregate quality the gravels in the Hawke’s Bay region, being derived from Torlesse
                Terrane greywackes, are at the higher end of the range in performance.

                In terms of encouraging extractors to move some operations to other rivers where HBRC want
                extraction for flood control it would worth considering obtaining some independent geotechnical test
                data to demonstrate compliance with aggregate specifications.

                As discussed in the sister report “Gravel Demand Forecast (Issue 5) the HBRC allocates gravel
                extraction volumes on an annual basis, commencing 1 July each year. Feedback from most extractors
                is that this process works well, however some of the larger extractors have said that a one year time
                frame is too short for strategic business planning and investment purposes.

                This business risk may be even more pronounced if further studies show that the supply risk on the
                Ngaruroro River is real and HBRC needs to take action to reduce production here.

                                                                                                             Page 9 of 77
11 August, 2015
Murray Stevens and Barry Larsen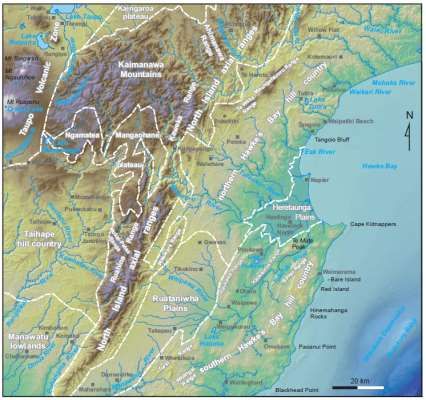
Gravel Resource Inventory - Hawke’s Bay Regional Council
1.0 BACKGROUND
This report covers one of the key issues identified in a scoping report instigated by Hawke’s Bay
Regional Council (HBRC) and prepared by Tonkin and Taylor in 2010 into ways of improving the Council
gravel management plan for the Region.
There has been recognition by stakeholders including gravel extractors, district councils, and HBRC for
better information on gravel resources in the Hawke’s Bay Region to enable more informed decisions
on resource allocation, the needs of industry for security of supply and business planning and HBRC’s
responsibilities to manage the river catchments and gravel resources sustainably.
Some 13 main issues were identified, two of which required the input from ‘independents’ with
experience in the aggregates industry. These are the Gravel Resource Inventory, (Issue 3), the subject
of this study and Gravel Demand Forecast (Issue 5), the latter which was completed in February 2015.
The other issues identified are either completed or at various stages of study with the ultimate aim of
incorporating all into a Riverbed Gravel Management Plan.
2.0 SCOPE AND OBJECTIVES
The Gravel Resource Inventory Study has the following key objectives;
Identification of resource locations, resource volumes available for potential extraction and
aggregate quality.
Identify and assess risks in gravel supply and quality.
Assist in determining the sustainability of the river based gravel resource.
Provide input into the gravel management plan
The preliminary scope of work outlined by HBRC details the following requirements:
Identification and mapping of gravel source locations (maps to be produced on GIS base).
Incorporate information from Gravel Supply and Transport study (Issue 2)
Estimate of available volumes (from Gravel Supply and Transport study (Issue 2))
Assessment of material type (quality and mineralogy) and size (including in context of industry
requirements)
Land-use zoning and constraints in district plans
Assessment of capacity of current and potential land-based quarries
River access mapping (excluded from this report)
Input on environmentally sensitive areas from Ecological Effects studies (Issues 7 and 8) (Excluded
from this report)
Gain input from industry representatives
Page 10 of 77
11 August, 2015
Murray Stevens and Barry LarsenGravel Resource Inventory - Hawke’s Bay Regional Council
The inventory is to also cover land based gravel resources as there are a number of operators using
these resources of varying quality for specific purposes, while they could be a future source of
aggregate if river gravel supply is limited in some catchments.
3.0 METHODOLOGY
3.1 Site Visits
Preliminary site visits were carried out in conjunction with the Gravel Demand study (Issue 5) on 14
and 15 October, 2014 and again on 12 to 14 November, 2014. This involved brief site visits with HBRC
personnel to several representative river extraction sites, particularly on the Tukituki and Waipawa
Rivers. Site visits were undertaken to the three main river gravel extraction operating sites on the
Ngaruroro, being Holcim and Higgins plus the Winstones/Firth site on the coast at Awatoto. In addition
the site of Infracon extraction on the Waipawa River near Waipukurau was examined and Higgins’ land
based operation at Maraekakaho.
3.2 Programmes/GIS
Databases were prepared from HBRC raw data, cross sectional survey data and volume estimates
calculated by HBRC using their Xsection programme on volumes of aggregate available for each of the
main river systems and plotted using the GIS programme MapInfo Version 12.5.2/Discover 2014.0.2
and plots produced as detailed throughout this document. Raster imagery and vector data were
obtained from LINZ and GNS Science.
3.3 Interviews
A series of interviews and meetings were held with various stakeholder groups including HBRC staff
Engineering Section and of industry representatives from the main producers including Winstone
Aggregates, Holcim, Higgins Aggregates, and Wairoa Metal Supplies. QRS, Infracon and the 4 local
authorities (Napier City, Hastings District, Central Hawke’s Bay District and Wairoa District Councils).
In addition valuable information was gathered from discussions with a number of the main road
maintenance contractors from the region.
3.4 Literature research
Data and reports were provided by HBRC as detailed in the references at the rear of the document. In
addition the GERM database of New Zealand mineral occurrences and all inactive and active quarries
and mines was reviewed. This database was current up until 1999 but does provide a useful guide to
quarrying operations throughout the region.
The geological discussion is derived from researching the available literature much of which is
summarised in the QMAP 1:250,000 Geological Map series produced by GNS Science.
Other sources of information included the work being carried out by Professor Philippa Black of
Auckland University and the FRST funded “Geologic Inventory of North Island Aggregate Resources”.
Page 11 of 77
11 August, 2015
Murray Stevens and Barry LarsenGravel Resource Inventory - Hawke’s Bay Regional Council
4.0 RIVER CATCHMENTS AND GEOMORPHOLGY
4.1 General
The Hawke’s Bay area can be broadly divided into several physiographic regions that have distinct
features reflecting their underlying geology. The main physiographic regions that are of relevance to
the aggregate resources are discussed as follows. Figure 1 shows the main physiographic regions.
4.2 Ruataniwha Plains
The Ruataniwha Plains between Dannevirke and Tikokino are underlain by Quaternary alluvial gravels
eroded from the adjacent Ruahine Range. The oldest terraces, of early Quaternary age, are folded and
warped by surface and sub-surface reverse faults (Lillie 1953; Melhuish 1990; Beanland et al. 1998).
Along the Ruahine Range front, terraces between Wakarara and Norsewood reach elevations of circa
500 m. South of Takapau, rivers drain south into the Manawatu River, which flows west through the
axial ranges via the Manawatu Gorge and drains to the west coast. North of Takapau, rivers including
the Tukipo, Waipawa, Makaroro and Makaretu Rivers drain into the Tukituki River, which flows into
Hawke Bay.
4.3 Heretaunga Plains
Napier, Hastings and Havelock North are sited on an extensive alluvial plain deposited adjacent to
southern Hawke Bay where the Tukituki, Ngaruroro and Tutaekuri rivers converge. These rivers have
a catchment area of 5,900 km2. Within about five kilometres of the coast near Clive, estuarine, lagoon
and beach sediments underlie surficial alluvial gravels and were deposited before progradation of the
coastline began about 6,500 years ago (Dravid & Brown 1997). Part of the coastal area between the
Napier harbour entrance and the Esk River mouth, formerly known as the Ahuriri Lagoon, was uplifted
by at least one metre (Hull 1986, 1990; Litchfield et al. 2005) during the 1931 Hawke’s Bay Earthquake.
Figure 1: Main catchments and geomorphic features of Hawke’s Bay (Lee et al 2011)
Page 12 of 77
11 August, 2015
Murray Stevens and Barry LarsenGravel Resource Inventory - Hawke’s Bay Regional Council
4.4 Northern Hawke’s Bay Hill Country
Northeast-trending strike ridges of Neogene sandstone, limestone and conglomerate are prominent
features of the landscape of northern Hawke’s Bay, and in general, bedding dips gently to the
southeast. The Mohaka, Ngaruroro, Tutaekuri and Waiau rivers that begin in the axial ranges, cut
through the hill country to the coast.
4.5 North Island Axial Ranges
The southwest-northeast trending axial ranges of the North Island, pass through the Hawke’s Bay on
the western side of the region. They include the Ruahine, Wakarara, Kaweka, Ahimanawa ranges and
Kaimanawa Mountains. These are mostly composed of greywacke and are the main source rock for
the gravel resources in the Heretaunga and Ruataniwha Plains. They are onlapped by Paleogene and
Neogene sedimentary rocks or, in the northwest, mantled by Quaternary volcanic rocks. Major,
sometimes active, faults within the ranges control the drainage pattern, as seen with the Ruahine and
Mohaka Faults in the Ruahine Range. Localised remnants of Neogene rocks found hundreds of metres
above sea level in the Ruahine Range imply that the erosion surface was formed before the Pliocene
(Beu et al. 1981; Browne 2004a).
5.0 GEOLOGY
5.1 Hawke’s Bay Regional Geology
The regional geology of the Hawke’s Bay comprises Jurassic to Cretaceous aged greywacke rocks that
form the Ruahine, Kaweka, Kaimanawa and Ahimanawa north-east trending axial ranges in the
western part of the region. Uplift and erosion of these rocks over time has produced the primary
source rocks of the gravels that are extracted in Hawke’s Bay region.
Figure 2 shows a generalised geological map of Hawke’s Bay region.
Page 13 of 77
11 August, 2015
Murray Stevens and Barry LarsenGravel Resource Inventory - Hawke’s Bay Regional Council
Figure 2: Generalised geology of Hawke’s Bay (Lee et al 2011)
These rocks are separated by several NE trending major active faults, namely the Ruahine and Mohaka
Faults, from the East Coast Basin comprised of Cretaceous to Plio-Pleistocene aged (Neogene)
sequences of marine to terrestrial sediments that include significant mudstone, sandstone and
limestone deposits. In terms of source rocks for aggregate these are of minor importance apart from
some conglomeratic units that get eroded and reworked into the active river systems.
Within the Hawke’s Bay region the youngest rocks of Quaternary age have been divided based on
age and stratigraphy. The main groups recognised are:
Kidnappers Group - mid to late Quaternary sediments in the East Coast Basin, (Fleming 1959; Kingma
1971) and its correlatives, of Pleistocene age, are up to 600 m thick and unconformably overlie
Pliocene Mangaheia Group. The deposits crop out in the Ruataniwha area, to the east of the Ruahine
Page 14 of 77
11 August, 2015
Murray Stevens and Barry LarsenGravel Resource Inventory - Hawke’s Bay Regional Council
and Wakarara ranges, in the Waipawa and Waipukurau areas, at Cape Kidnappers and locally in the
Napier area. These sediments are less pumiceous in the east, where they are mainly conglomeratic.
At the type section at Cape Kidnappers, basal fossiliferous sandstone, unconformably overlying Late
Pliocene rocks, passes upward into thick-bedded conglomerate, sandstone and carbonaceous
mudstone, with intercalated tephra and ignimbrite beds. In the Napier area, Kidnappers Group
deposits are mostly poorly sorted greywacke gravels with interbedded sand and silt (Bland et al. 2007).
Thinly layered sandstone and siltstone, with locally abundant plant material, are probably lake
deposits (Kingma 1971).
Landslide deposits -Landslide deposits comprise a variety of rock and soil debris, depending on source
area rock types. Landslides are common in hilly and mountainous areas, although most are small.
Major landslides within the axial ranges are shown in Figure 3 and are an important source of
greywacke for the river catchments of the Ruataniwha and Heretaunga Plains as well as the more
northerly rivers such as the Mohaka and Waiau.
Page 15 of 77
11 August, 2015
Murray Stevens and Barry LarsenGravel Resource Inventory - Hawke’s Bay Regional Council
Figure 3: Areas of major land slides and erosion in the axial ranges. (Source Black, 1992)
Alluvial fan, scree and colluvial deposits
Page 16 of 77
11 August, 2015
Murray Stevens and Barry LarsenGravel Resource Inventory - Hawke’s Bay Regional Council
Alluvial fan, scree and colluvial deposits are present in areas with steep topography. They commonly
contain a higher proportion of silt and clay than alluvial terrace deposits. The deposits consist of
unconsolidated, locally derived, angular to sub-rounded pebbles, cobbles and boulders.
Alluvial terrace and floodplain deposits
Alluvial terrace and floodplain gravel, sand, silt and mud, deposited by rivers and streams, occur in
large areas along river edges and in the Heretaunga and Ruataniwha plains. They typically comprise
moderately to well-sorted, sandy, rounded greywacke gravel. Deposits are up to several metres thick
in river valleys, tens of metres thick beneath the Ruataniwha Plains, or hundreds of metres thick
beneath the Heretaunga Plains (Dravid & Brown 1997; Francis 2001). Loess, paleosols and tephra are
common constituents. Terraces east of the ranges are poorly dated, particularly in the Ruataniwha
Plains.
Slightly weathered grey brown alluvium forms low terraces, typically only a few metres above a
broader aggradational plain built from Last Glacial Stage outwash gravels. Unweathered Holocene
alluvium covers the floors of entrenched stream valleys and is extensive in the Ruataniwha and
Heretaunga plains.
Other Deposits – There are a variety of other deposits recognised in the region that are of Holocene
age and these include swamp deposits, frequently formed as a result of Quaternary fault movement
impeding drainage.
There are coastal dune deposits including those approx. 7km south of Cape Kidnappers and beach and
estuarine deposits. These include the dominantly gravel beaches at Awatoto and the estuarine
deposits that underlie the former Ahuriri Lagoon at Napier, which was uplifted by 1–2 m during the
1931 Hawke’s Bay Earthquake (Hull 1990).
There are deposits of human origin particularly in the urban areas, these include fill, reclaimed
land, along roads and railways, under bridge abutments, and stop banks.
Pliocene to Holocene sediments of the Tauranga Group are exposed mostly in the north of the region,
and consist of mainly alluvial volcanoclastic sediments (see Leonard et al. 2010). The Taupo Pumice
Formation (see below) was fluvially reworked to form extensive, low-level terraces of pumiceous
alluvium in the northwest and in the headwaters of the Ngaruroro River (Segschneider 2000;
Segschneider et al. 2002).
5.2 Source Rock Geology
The source rocks for the gravel deposits in the Ruataniwha and Heretaunga Plains all are originally
derived from the axial ranges. There is some reworking of gravel material from the Kidnappers Group
and the gravels forming the low terraces of post glacial aggradational outwash.
The main elements of the greywackes are shown in Figure 4 which is a generalised geological map of
New Zealand that highlights the Hawke’s Bay region. This shows that the main source rocks in the axial
ranges are described as Torlesse type rocks now ascribed to the Kaweka Terrane, (Adams et al, 2009).
This is equivalent to the Rakaia Terrane as used by Black, 2009.
Page 17 of 77
11 August, 2015
Murray Stevens and Barry LarsenGravel Resource Inventory - Hawke’s Bay Regional Council
Kaweka Terrane rocks are dominantly composed of massive fine to medium grained
quartzofeldspathic sandstone and well bedded indurated mudstone and sandstone with quartz and
zeolite veining.
Minor components include conglomerate, limestone, chert and volcanics.
Most of the Kaweka Terrane is metamorphosed to zeolite facies which can have implications for
aggregate quality in some instances.
To the east of the Kaweka Terrane rocks lies a relatively narrow southwest-northeast trending belt of
rocks along the eastern Ruahine Range that have been classified as Pahau Terrane within which there
is a distinctive petrofacies described and known as the Waioeka Petrofacies.
This belt is bisected by the Mohaka Fault. Undifferentiated Pahau Terrane rocks lie west of the fault,
whereas Waioeka petrofacies rocks are found only east of it. The undifferentiated Pahau Terrane rocks
are mostly thinly bedded, alternating sandstone and mudstone, massive sandstone and concretionary
mudstone.
Sandstones are fine to medium grained quartzofeldspathic arenites, with carbonaceous material
present. Areas of mélange, and basalt, limestone and chert are unknown in the map area.
Undifferentiated Pahau Terrane rocks are inferred to be of prehnite-pumpellyite metamorphic facies
(Spörli & Bell 1976).
Page 18 of 77
11 August, 2015
Murray Stevens and Barry LarsenGravel Resource Inventory - Hawke’s Bay Regional Council
Figure 4: Main geological terranes in New Zealand. Hawke’s Bay highlighted, (Lee et al, 2011)
The Waioeka petrofacies rocks crop out discontinuously east of the Mohaka Fault from northwest of
Dannevirke to the Wakarara Range (Mortimer 1995). The easternmost exposures are faulted slivers
along the Oruawharo Fault Zone, near Takapau. The Waioeka petrofacies differs from the other
Kaweka Terrane and Pahau Terrane rocks in that the thin bedded fine to medium grained sandstones
and mudstones and more thick bedded sandstones have a higher abundance of carbonised plant
fragments and are distinctly more volcaniclastic in their mineralogy.
Page 19 of 77
11 August, 2015
Murray Stevens and Barry LarsenGravel Resource Inventory - Hawke’s Bay Regional Council
Black, 2009 identifies the Pahau Terrane rocks as having the potential to have the zeolite laumontite
present plus smectite and other swelling clays. It is also notable that the Kaweka terrane is
metamorphosed to zeolite facies and again zeolite veins are recorded in these rocks.
6.0 RESOURCE INVENTORY
6.1 General
The inventory of aggregate resources focuses on those resources in the active river systems that are
currently forming the main supply of aggregate for the Hawke’s Bay region. Commentary is also made
on the so called “red rock” aggregates that form the terraces of the post glacial outflow deposits and
kidnappers group deposits as well as and the potential for aggregate resources in the margins of the
main river channels where river channels have migrated over time.
6.2 Assumptions, modelling parameters, limitations
Following major reviews by the Hawke’s Bay Catchment Board and Regional Water Board in 1987 and
prepared by G J Williams plus additional studies for the Hawke’s Bay Regional Council (HBRC) on the
Ngaruroro River by G J Williams in 1997 lead to defining a set of parameters to sustainably manage
the river systems and control aggregate extraction.
More recently NIWA in conjunction with HBRC developed modelling software known as GRATE to
model gravel transport, extraction and bed level change in the Ngaruroro River. This model was
refined using the cross-sectional database on aggregate volumes since 1961. This modelling software
is now being applied to model the gravel transport in the other major river systems in the region.
The HBRC have established a series of cross sections at regular intervals on all major river systems in
the region. These range from approximately 500m to 1.3km apart and are surveyed approximately
every two years and volume changes measured. This sectional data has been used to determine a
grade line for each major river based on a 2 year return flood event.
HBRC policy has been to manage extraction so that it, in general, is only allowed in parts of the rivers
where gravel accumulations are above grade line. This is the base case for determining available gravel
supplies for extraction.
The evaluation of aggregate resource available was also determined using a 0.5m below grade line
and a 1.0m below grade line.
G. Edmondson from HBRC estimated the volumes based on the cross-sectional areas of contiguous
sections estimating the volumes between as either above or below grade line for the active river
channel only.
Resource estimates have been calculated for the sections for which there are data. There are a number
of other sections where volumetric data is not available and where grade line has not been
determined, for instance the Middle Tukituki.
It is evident from HBRC records that the volume of aggregate supply to the river catchments is episodic
and driven primarily by flood events.
Page 20 of 77
11 August, 2015
Murray Stevens and Barry LarsenGravel Resource Inventory - Hawke’s Bay Regional Council
For the purposes of this inventory compilation the 2013-2014 year has been used as a representative
base case. This will vary both in volume of new supply to the catchments and where the resource
occurs as the sediment load moves down stream.
7.0 RIVER BASED GRAVEL INVENTORY
7.1 Ngaruroro River
7.1.1 Base Case Grade Line
The current extraction sites on the Ngaruroro River cover an approximate river length of 32km starting
around 5km from the coast at Section line 14 near Chesterhope and upstream to the confluence of
the Mangatahi Stream and the Ngaruroro River at Section line 57 west of Maraekakahoe.
The bulk of the allocated extraction comes from three main producers between Section lines 36 to 51,
a distance of around 12.4km.
1000000
Ngaruroro River Gravel Volume Above Grade Line
NGATARAWA ACCESS
800000 Design
Design-0.5
Volume above Grade Line (m3)
Design-1.0
600000
CARRICK ROAD
400000
CHESTERHOPE
FERNHILL
200000
0
15 17 19 21 23 25 27 29 31 33 35 37 39 41 43 45 47 49 51 53 55 57
-200000
Cross Section
Figure 5: Ngaruroro River sectional gravel volumes
Figure 5 shows graphically the volumes currently available at each section line. Table 1 shows the
calculated volumes by section line and the net total volume above the base case grade line.
Page 21 of 77
11 August, 2015
Murray Stevens and Barry LarsenGravel Resource Inventory - Hawke’s Bay Regional Council
CROSS SECT CROSS CROSS MBL GRADE VOLUME VOLUME DESIGN VOLUME DESIGN
NO SECT DIST SECT CHANNEL LINE DESIGN (M3) ( -0.5M) (M3) ( -1.0M) (M3)
FROM WIDT (MASL) DESIGN
COAST H (M) (MASL)
(KM)
14 5.78 47 10.91 11.40
15 6.15 52 11.31 11.77 - 8,686 472 9,629
16 6.84 118 12.48 12.47 - 7,845 21,480 50,805
17 7.29 62 12.62 12.93 - 4,059 16,191 36,441
18 7.86 180 14.28 13.51 34,023 68,508 102,993
19 8.27 48 14.52 13.90 34,514 57,884 81,254
20 8.72 172 15.09 14.54 27,981 52,731 77,481
21 9.08 178 15.85 15.06 42,340 73,840 105,340
22 9.48 132 16.00 15.60 38,684 69,684 100,684
23 9.77 189 16.81 16.05 28,484 51,756 75,029
24 10.26 194 17.75 16.75 82,722 129,639 176,557
25 10.75 157 18.00 17.45 68,686 111,683 154,681
26 11.20 187 19.05 18.10 59,400 98,100 136,800
27 11.71 162 19.63 19.03 70,087 114,584 159,082
28 12.19 149 20.31 19.90 37,990 75,310 112,630
29 12.67 183 21.42 20.78 42,770 82,610 122,450
30 13.11 190 22.12 21.58 48,338 89,368 130,398
31 13.56 188 22.94 22.40 45,927 88,452 130,977
32 14.26 188 24.74 24.02 82,908 148,708 214,508
33 14.81 182 25.56 25.29 50,737 101,613 152,488
34 15.34 179 26.44 26.52 9,227 57,060 104,892
35 15.87 199 27.82 27.75 - 103 49,982 100,067
36 16.55 203 29.22 29.32 - 2,166 66,174 134,514
37 17.21 209 30.69 30.85 - 17,734 50,246 118,226
38 17.58 169 31.35 31.62 - 14,628 20,337 55,302
39 18.41 317 34.10 33.50 59,997 160,842 261,687
40 19.07 339 35.83 35.64 84,021 192,261 300,501
41 19.72 347 38.00 37.74 50,255 161,730 273,205
42 20.42 292 39.84 40.00 15,225 127,050 238,875
43 21.29 317 42.79 42.82 - 24,460 107,997 240,455
44 22.29 291 45.92 46.06 - 25,125 126,875 278,875
45 23.02 319 48.49 48.40 - 4,391 106,934 218,259
46 23.88 282 51.84 51.51 52,361 181,576 310,791
47 24.95 177 54.79 55.40 - 7,977 114,806 237,588
48 25.48 246 56.74 56.84 - 35,131 20,916 76,964
49 26.13 310 58.90 58.60 22,230 112,580 202,930
50 27.44 369 63.60 63.47 92,335 314,708 537,080
51 28.95 320 69.52 69.08 142,521 402,619 662,716
52 30.24 299 74.56 73.90 218,100 417,728 617,355
53 31.65 331 80.00 79.80 185,796 407,871 629,946
54 33.10 339 85.72 85.33 143,847 386,722 629,597
Page 22 of 77
11 August, 2015
Murray Stevens and Barry LarsenGravel Resource Inventory - Hawke’s Bay Regional Council
CROSS SECT CROSS CROSS MBL GRADE VOLUME VOLUME DESIGN VOLUME DESIGN
NO SECT DIST SECT CHANNEL LINE DESIGN (M3) ( -0.5M) (M3) ( -1.0M) (M3)
FROM WIDT (MASL) DESIGN
COAST H (M) (MASL)
(KM)
55 34.66 353 91.81 91.29 246,301 516,181 786,061
56 36.46 346 98.55 98.16 286,650 601,200 915,750
57 37.85 346 103.76 103.50 156,306 396,776 637,246
Total
Resource
above
Grade Line 2,560,763 6,553,783 10,699,108
Net Total
Resource 2,408,458 6,553,783 10,699,108
Table 1: Ngaruroro base case volumes by section line
The volume of gravel for each section line is also shown on the aerial photograph in Figure 6.
The estimates show in the 2013-2014 year that there is an average gravel resource availability of
2.56 million m3 above grade line.
Importantly, the available gravel for extraction where the main producers operate between Section
lines 36 to 51 amounts to 518,945.0 m3.
Williams 1997 estimated using a gravel balance approach that an average addition of 170,000 m3 of
gravel is added to the system annually. Williams 1997 and Measures 2012 using the GRATE model
note wide variability on an annual basis dependant largely on frequency of storm and flood events.
Current and future demand forecasts indicate production for the Ngaruroro is estimated at 270,000
m3 in the low case scenario and 315,000 m3 for a medium to high case demand growth forecast over
the next 5 years.
Assuming the natural average addition of aggregate estimated by Williams, 1997 at 170,000 m3 and
available supplies (assuming the 2013-2014 volumes are representative) leads to the conclusion that
over extraction of between 100,000 m3 and 145,000 m3 is or will occur at the projected extraction
rates.
This implies that with an average of 518,945 m3 of gravel in the main extraction areas available above
grade line for extraction there is likely to be a 3.5 to 5 year time period before gravel resources in the
main extraction areas fall below grade line. (See discussion below in Section 7.1.4).
Page 23 of 77
11 August, 2015
Murray Stevens and Barry LarsenYou can also read