Telescope Concepts in Gamma-Ray Astronomy - arXiv
←
→
Page content transcription
If your browser does not render page correctly, please read the page content below
Telescope Concepts in Gamma-Ray Astronomy

                                              Thomas Siegert, Deirdre Horan, Gottfried Kanbach
arXiv:2207.02248v1 [astro-ph.HE] 5 Jul 2022

                                              Abstract This chapter outlines the general principles for the detection and char-
                                              acterisation of high-energy γ-ray photons in the energy range from MeV to GeV.
                                              Applications of these fundamental photon–matter interaction processes to the con-
                                              struction of instruments for γ-ray astronomy are described, including a short review
                                              of past and present realisations of telescopes. The constraints encountered in op-
                                              erating telescopes on high-altitude balloon and satellite platforms are described in
                                              the context of the strong instrumental background from cosmic rays as well as as-
                                              trophysical sources. The basic telescope concepts start from the general collimator
                                              aperture in the MeV range over its improvements through coded-mask and Compton
                                              telescopes, to pair production telescopes in the GeV range. Other apertures as well
                                              as understanding the measurement principles of γ-ray astrophysics from simulations
                                              to calibrations are also provided.

                                              Keywords Gamma-ray measurements, collimator, coded-mask, Compton telescope,
                                              Pair creation telescope, space environment, instrumental background

                                              Thomas Siegert
                                              Institut für Theoretische Physik und Astrophysik, Universität Würzburg, Campus Hub-
                                              land Nord, Emil-Fischer-Str. 31, 97074 Würzburg, Germany e-mail: thomas.siegert@
                                              uni-wuerzburg.de
                                              Deirdre Horan
                                              Laboratoire Leprince-Ringuet, CNRS/IN2P3, Institut Polytechnique de Paris, F-91128 Palaiseau,
                                              France e-mail: deirdre@llr.in2p3.fr
                                              Gottfried Kanbach
                                              Max Planck Institute for Extraterrestrial Physics, Giessenbachstrasse 1, 85748 Garching, Germany,
                                              e-mail: gok@mpe.mpg.de

                                                                                                                                             1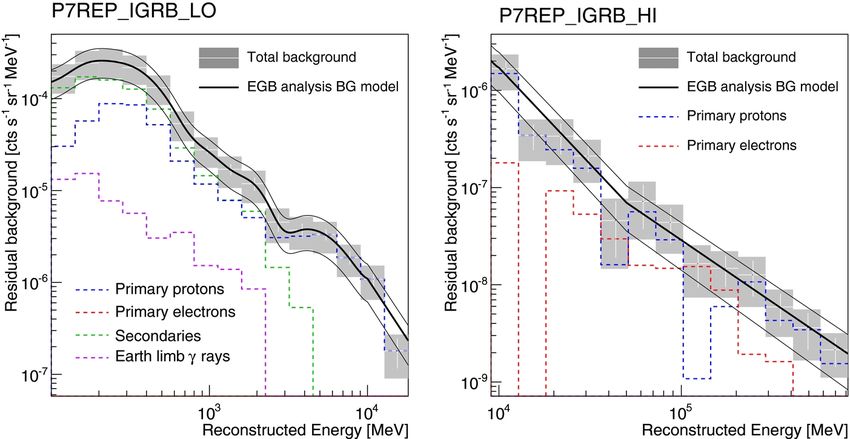
2                                        Thomas Siegert, Deirdre Horan, Gottfried Kanbach

1 Introduction

Gamma rays (γ-rays) are traditionally defined as penetrating electromagnetic radi-
ation that arise from the radioactive decay of an atomic nucleus and, indeed, for
γ-rays produced naturally on Earth, this is the case. Gamma rays constitute the elec-
tromagnetic radiation having energy of & 100 keV and, therefore, have energies
that traverse more than ten decades of the electromagnetic spectrum. In addition to
those γ-rays coming from radioactive decays, the extra-terrestrial γ-rays incident on
Earth are produced in a variety of different astrophysical scenarios. These include
when extremely energetic charged particles accelerate in magnetic fields or upscat-
ter ambient radiation to γ-ray energies, hadronic processes such as cosmic-ray (CR)
interactions in the Galaxy and, indeed, possibly in more exotic interactions such as,
for example, the self-annihilation of dark matter particles (Sec. 3).
    In this Chapter an outline of the various techniques and instruments for the detec-
tion and characterisation of γ-rays will be presented. The limitations and advantages
of each particular detection technique, the backgrounds that must be overcome, and
the environmental circumstances that must be considered will be reviewed. Only the
direct detection of γ-rays will be discussed here thus effectively limiting the upper
energy range to approximately 100 GeV. For the detection techniques at so-called
very-high energy (VHE; Eγ & 100 GeV) the reader is referred to other chapters of
this book.
    In order to detect γ-rays, we rely on one of their three interactions with matter:
the photoelectric effect, Compton scattering and pair production, whose respective
cross sections depend on the energy of the γ-ray and on the material in which it in-
teracts (Sec. 1.3). Since γ-rays cannot penetrate the Earth’s atmosphere, it having an
equivalent thickness of approximately 0.9 m of lead, a detector needs to be placed
above the atmosphere in order to detect γ-rays directly (Sec. 2.1). Like no other en-
ergy range the γ-ray regime is dominated by an irreducible instrumental background
(MeV energies) and limited by collection area (GeV energies) and telemetry (MeV
& GeV energies; Sec. 2.2). Due to these factors and to the energy-dependant cross
section of a γ-ray’s interaction with matter, the discussions in this Chapter will be
split according to the detection technique being employed, which is itself a function
of the energy range of the γ-rays being studied.
    Because of CR bombardment, MeV telescopes suffer from a high level of sec-
ondary γ radiation. This includes electron bremsstrahlung, spallation, nuclear exci-
tation, delayed decay, and annihilation, all of which contribute to the instrumental
background in the MeV range. This orders of magnitude enhanced rate of unwanted
events leads to a worse instrument sensitivity – the ‘MeV Sensitivity Gap’ – com-
pared to neighboring photon energy bands (Sec. 1.2). The correct identification of
background photons from celestial emission leads to an artificial split in the science
cases (Sec. 3) because γ-ray instruments are built to observe either in the MeV or in
the GeV. Even though astrophysical high-energy sources can span several decades
in the electromagnetic spectrum, the MeV regime is often omitted because the sensi-
tivities of current instruments rarely add much spectral information. In this Chapter
we therefore handle MeV- and GeV-type instruments separately. We note, however,
Telescope Concepts in Gamma-Ray Astronomy                                             3

that leaving out information, even though it appears weak in the first place, leads to
a biased view of the astrophysics to be understood.
    In the pair-production regime at tens of MeV to GeV energies, the spectra of
γ-ray sources phenomenologically follow a power law such that the flux changes
rapidly as a function of energy. With the exception of grazing incident mirrors used
for hard X-rays in the energy range up to ∼ 100 keV (Sec. 4.6), γ-rays cannot be
focused and, therefore, in order to be detected, need to enter the detector and interact
with it. So, unlike optical telescopes where a large effective area can be achieved
by using a huge mirror to focus the optical photons onto a small detector, a large
collection area can only be achieved at γ-ray energies by having a large detector
volume. This requirement coupled with the constraints of launching a large mass
high enough in the atmosphere that it can detect sufficient γ-rays (Sec. 2.1.1) limit
the upper bound energy at which γ-rays can effectively be detected directly: for the
direct detection of γ-rays the physical volume of the detector is always larger than
its effecting detecting volume and, therefore, its effective area. The requirement to
observe from space has the advantage of fewer constraints with respect to observing
schedules (e.g., no day and night cycles), however limits the sensitive collecting
areas of the telescopes because of the mass that can be transferred into an orbit.
    In this Chapter, we will introduce the only 60-year long history of γ-ray observa-
tions (Sec. 1.1), describe the least explored range of the electromagnetic spectrum,
the MeV range (Sec. 1.2), and present the basic interactions of high-energy pho-
tons with matter that are used in all γ-ray telescopes (Sec. 1.3). Details about the
instruments’ current capabilities and requirements to study high-energy sources are
given in Sec. 2, followed by an extensive discussion of instrumental background
origins in Sec. 2.2, and state-of-the-art suppression mechanisms (Sec. 2.3). Based
on the different science cases in the MeV and GeV range (Sec. 3), we detail princi-
pal instrument designs in Sec. 4. This includes the basic collimator (Sec. 4.1), coded
mask telescopes (Sec. 4.2), Compton telescopes (Sec. 4.3), pair creation telescopes
(Sec. 4.4), γ-ray polarimeters (Sec. 4.5), as well as other, alternative, but not neces-
sarily yet realised instruments (Sec. 4.6). Gamma-ray detectors are briefly explained
in Sec. 4.7, followed by how γ-ray measurements are to be understood, evaluated
(Sec. 4.8), and compared to simulations (Sec. 4.9) and calibrations (Sec. 4.10). We
close this Chapter with an outlook about future, and possible more advanced con-
cepts in Sec. 5.

1.1 Historical Perspective

1.1.1 First Observations

Gamma-ray astronomy, the highest-energy range of multi-wavelength astronomy,
was already recognised in the 1950’s as having the potential to provide direct in-
sight into astrophysical processes with particles, fields, and dynamics of extreme
conditions in the Universe. The principal source processes for high-energy γ radi-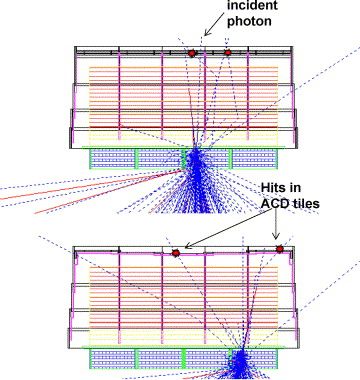
4                                                                               Thomas Siegert, Deirdre Horan, Gottfried Kanbach

ation in space (beyond the energy range of radioactivity) were studied first. These
include synchrotron radiation [1], Compton scattering [2], meson production and
the decay of π 0 → 2γ [3], and bremsstrahlung [4].
    The status of particle physics, CR research, and radio astronomy in the 1950’s
raised widely-debated questions such as: ‘Where do CRs come from and how are
they produced?’, ‘What is the photon fraction in the CR beam?’, ‘What powers the
strong Galactic radio emission?’, ‘Are there discrete γ-ray sources in the sky and
what could be the nature of such sources?’, ‘Do the observed particle emissions
from solar flares lead to γ-ray emissions (nuclear lines and continua)?’, and ‘Is
there antimatter around?’.
    Estimates for the strength of cosmic γ-ray sources were mainly based on the con-
temporary knowledge of CRs, the distribution and density of the Galactic interstellar
medium (HI radio emission), and the observations of radio emission from individ-
ual objects like the Crab nebula or radio galaxies. Morrison (1958, [5]) estimated
that the active Sun would emit 0.1–1 ph cm−2 s−1 between 10 and 100 MeV, and 1-
100 ph cm−2 s−1 in the neutron-proton capture line at 2.23 MeV. The Crab nebula
(the pulsar was unknown at the time) and typical radio galaxies should have intensi-
ties of 10−2 ph cm−2 s−1 . A thorough study of γ-ray production by CRs interacting
with the interstellar medium in the Galaxy by Pollack & Fazio (1963, [6]) predicted
a flux from the Galactic Centre of ∼ 10−4 ph cm−2 s−1 sr−1 and half that intensity
from the Anticentre. All of these flux estimates turned out to be much too high, but
nevertheless many experiments were started to detect celestial γ-rays. Short expo-
sures on balloons and a very strong environmental background prevented significant
detection of γ-rays from the Milky Way or from discrete sources. The beginning of
the space age in 1958 finally provided the facilities to operate γ-ray experiments
above the atmosphere. The clear, unabsorbed view of the sky, the longer exposures,
the absence of the atmospheric background, and advanced instruments succeeded in
establishing γ-ray astronomy as a new and promising branch of astrophysics.
    Gamma-ray astronomy is a discipline that depends on the technical resources
of the space age. The ground level of Earth-bound observatories is shielded from
cosmic γ radiation by the atmosphere (Fig. 1), with roughly 20 (resp. 60) mean
free path lengths of attenuation at 1 GeV (resp. 1 MeV) Furthermore, the charged
                                                                                    Optical

                                                                                              Ultra-
                                                 Radiowaves          Infrared                        X-Rays         Gamma-Rays
                                                                                              violet

                          500
              Altitude [klm]

                          100
                                                                                                Absorption Bands
                                                                                                  from O, O3, N

                               50
                                    Reflection

                                                                                                                   Atmospheric
                               10                                                                                   Absorption
                                                                    CO2, H2O
                                                  neV         μeV       meV         eV                 keV         MeV       GeV
                                                                          Photon Energy

Fig. 1 Absorption of cosmic electromagnetic radiation in Earth’s atmosphere.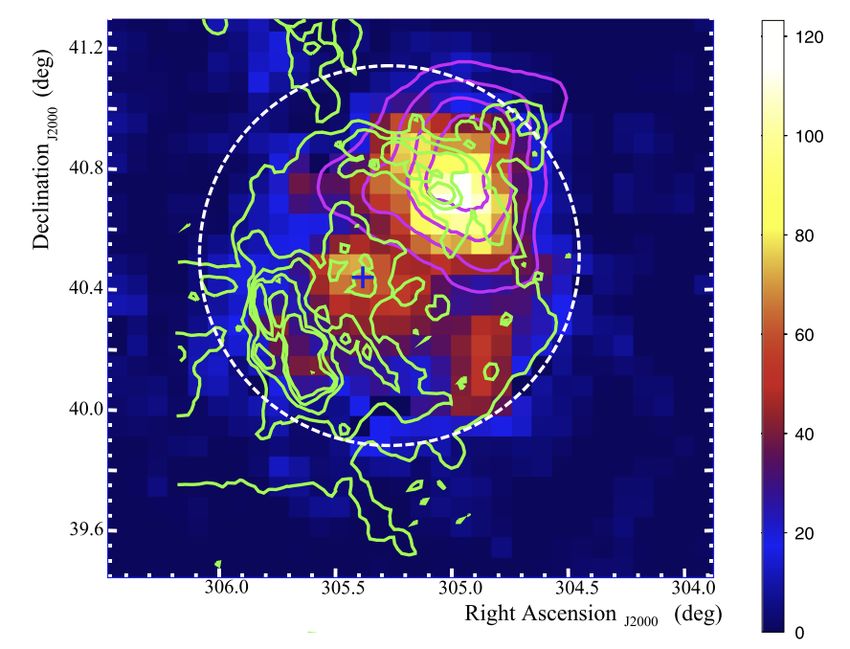
Telescope Concepts in Gamma-Ray Astronomy                                                            5

fraction of cosmic radiation, which dominates primary γ-rays by roughly a factor of
104 , generates a high level of secondary γ-ray background in the atmosphere and in
detector equipment. It is therefore essential to expose a γ-ray telescope in a low level
of external background, i.e. above the atmosphere but below the Earth’s radiation
belts, for long periods of observation to obtain the necessary detection statistics. For
satellites this is best achieved in a low Earth orbit (LEO) above the equator with
an altitude of 400–500 km. Equally important is the design of the telescope so as
to suppress the recording of unwanted charged particles (veto systems) and local γ
radiation (material selections).
   Both requirements directly impact the sensitivity of a γ-ray telescope with de-
tector exposure area A, detection efficiency ε, and angular resolution elements of
size θ . Discrete cosmic sources with fluxes of Fγ embedded in a ‘quasi’ continuous
background intensity IB observed for an exposure time tobs are then detected with a
statistical sensitivity of S:
                                                                           1/2
                                    Fγ Aεtobs             Fγ       Aεtobs
                         S=                           =                                            (1)
                               (IB Aεtobs πθ 2 )1/2       θ         IB π

It is evident from Eq. (1) that high sensitivity is the result of a large effective area,
Aeff = Aε, and long observation times, combined with small angular resolution and
low background intensities. Of course this formulation is extremely simplified com-
pared to more appropriate analysis tools using proper instrument response functions
for effective detector area, angular and energy resolution, and detailed models for
the background radiation, all as a function of primary energy and incidence direc-
tion.

Fig. 2 Left: Explorer XI (Apr–Nov, 1961): The small effective area (∼ 5 cm2 ), and a useful ob-
servation time of ∼ 6 d resulted in only 22 detected high-energy γ-rays, mostly from Earth’s at-
mosphere. Right: OSO-3 (1967–69): The successor of Explorer XI. A typical scintillator counter
telescope with a multi-layer conversion detector (CsI), a fast trigger system and a calorimeter with
layers of NaI and tungsten. The instrument is surrounded by an anti coincidence veto counter made
of plastic scintillator. A Galactic map of 621 events (E > 50 MeV) was derived from ∼ 16 months
of observations [7], but the coarse angular resolution (15◦ ) prevented the detection of point-sources.
6 Thomas Siegert, Deirdre Horan, Gottfried Kanbach
1.1.2 Missions 1960-1990
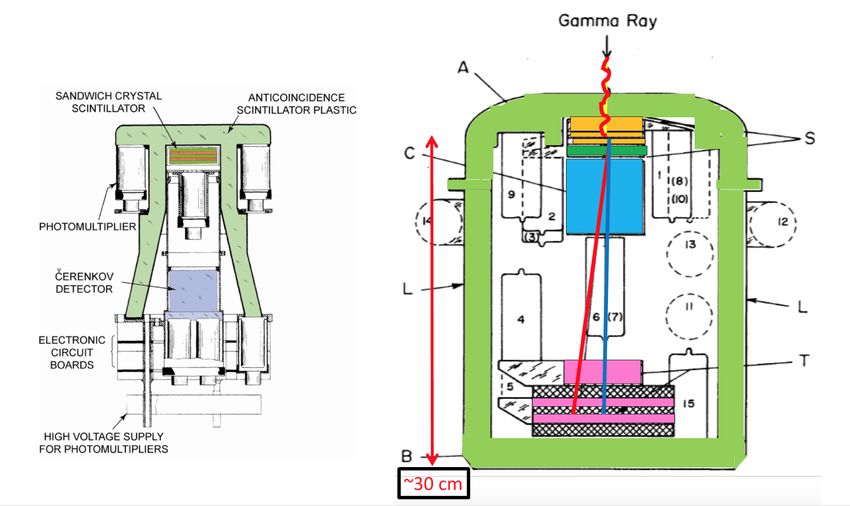
The first successful satellite detectors for high-energy γ-radiation were small scin-
tillation Čerenkov counter assemblies with anticoincidence shields. As depicted in
Fig. 2 they had to fit on the satellites of the 1960’s and could only transmit data
with limited rates. The emission of > 100 MeV photons from the inner Galaxy
was, however, clearly established by the OSO-3 measurements [7] and confirmed
by a spark-chamber imaging balloon experiment [9]. Here, it is interesting to note a
performance comparison between the scintillator telescope and the pointed balloon
instrument: both could achieve similar results on the Galactic emission with an ef-
fective area of 2–8 cm2 even though the former required ∼ 16 months of observation
time whereas the balloon flight only required several hours.
Gamma-ray instruments for the low-energy range < 10 MeV can be based on
Compton interactions (e.g., CGRO-COMPTEL) or be designed as spectrometers for
more narrowly defined targets and scientific objectives. In order to restrict the ac-
ceptance angle of a scintillator or solid-state spectrometer, with its omni-directional
response, a massive ‘well-type’ collimator is placed around a central detector. Col-
limators can be either active radiation detectors, for example made of BGO or CsI
scintillators, or passive structures made of high-Z metals. Two examples of success-
ful instruments are the γ-ray spectrometer (GRS) on the Solar Maximum Mission
(SMM, 1981–90; Fig. 3), and the Oriented Scintillation-Spectrometer Experiment
(OSSE) on the Compton Gamma-Ray Observatory (CGRO, 1991–2000).
The advantage of an imaging telescope for astronomical observations was clearly
established and led to the next generation of high-energy detectors, SAS-2 and
COS-B. Both high-energy satellite telescopes were based on digital readout spark-
chambers that allowed for the reconstruction of pair-creation events by tracking
the electron-positron pairs. Around the central tracker a charged particle anti-
coincidence shield made of plastic scintillator and, for COS-B, a calorimeter to
measure the deposited pair energy, were used. SAS-2 was developed on the basis
Fig. 3 SMM/GRS (1981–90): an actively shielded multi-crystal scintillation spectrometer, sensi-
tive to photons in the range 0.3–100 MeV [8]. SMM was continuously pointed at the Sun. The open
acceptance angle of about (135◦ ) in the forward direction prevented the identification of individual
sources, but allowed the instrument to monitor the temporal signatures of solar flares.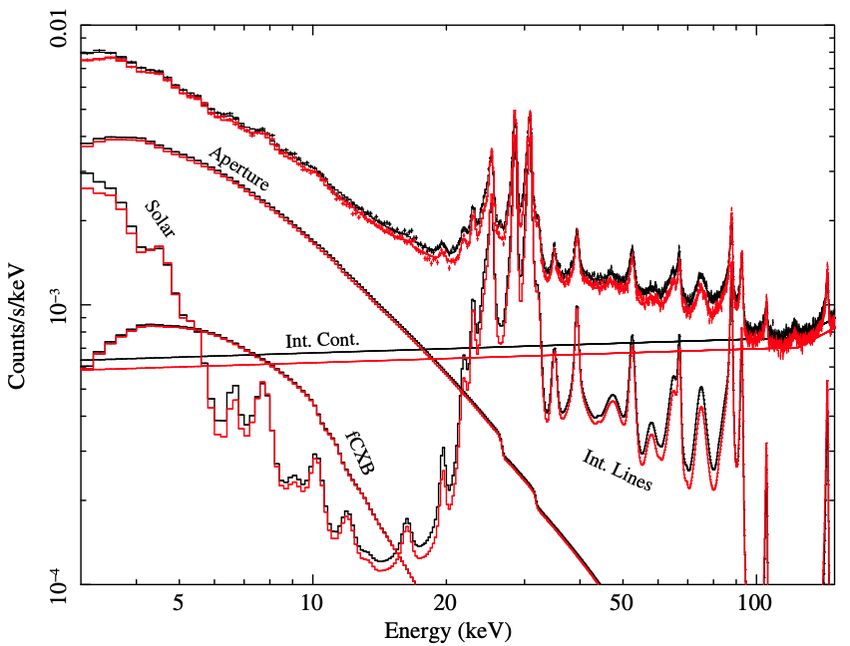
Telescope Concepts in Gamma-Ray Astronomy                                                                        7

of previous balloon detectors at NASA/GSFC and the COS-B instrument was built
by a European consortium of research institutes.

1.2 The ‘MeV Sensitivity’ Gap

Fig. 4 shows the sensitivities for past and current γ-ray instruments in the range
between 10−2 and 105 MeV. While sensitivity should be defined case by case, i.e.
depending on the source spectrum, its spatial distribution, and position in the instru-
ment field of view, an order of magnitude estimate of the instrument performance
can be given assuming a generic spectral shape at each photon energy. When pro-
vided with background estimates, the effective area, and a typical exposure time
(here 1 Ms), the sensitivity can be calculated from Eq. (1) to the desired level (here
3σ ). In general, the lower the sensitivity the better the instrument performs. It is ev-
ident that the currently flying telescopes NuSTAR (< 80 keV), INTEGRAL’s ISGRI
and SPI (0.02–8 MeV), and Fermi-LAT (> 0.03 GeV) shape a region in sensitivity
space that peaks in the MeV. This several orders of magnitude worse sensitivity is
called the ‘MeV Sensitivity Gap’, and is the direct result of a small collection area
(Sec. 4) combined with a high instrumental background (Sec. 2.2). Reducing this
MeV gap is a currently an active field of technological, methodological, and con-
ceptual development, and attempts to alleviate the problems in the MeV range are
described in Secs. 4.6 and 5.

                                                10   3
           3 Continuum Sensitivity (E 2 × FE)

                                                10   4                                                   Crab
                  [MeV phcm 2 s 1]

                                                10   5

                                                10   6

                                                10   7             MeV Gap                             NuSTAR
                                                                                                       BAT
                                                                                                       ISGRI
                                                                                         mCrab         SPI
                                                10   8                                                 COMPTEL
                                                                                                       COS-B
                                                10   9                                                 EGRET
                                                                                  Crab                 LAT
                                                     10   2   10   1   100   101 102 103         104      105
                                                                              Energy [MeV]
Fig. 4 Continuum sensitivities of hard X-ray to high-energy γ-ray instruments. Shown is the 3σ
sensitivity for an observation time of 1 Ms. The Crab’s spectral energy distribution from [10] is
shown with respect to the sensitivities as it is the ‘standard candle’ of high-energy sources. Mil-
liCrab (mCrab) flux levels can only be seen with deep exposures in the 0.3–100 GeV range or
below 100 keV. This defines the ‘MeV Gap’ of instrument sensitivities (red shaded area) – the least
explored region in the electromagnetic spectrum.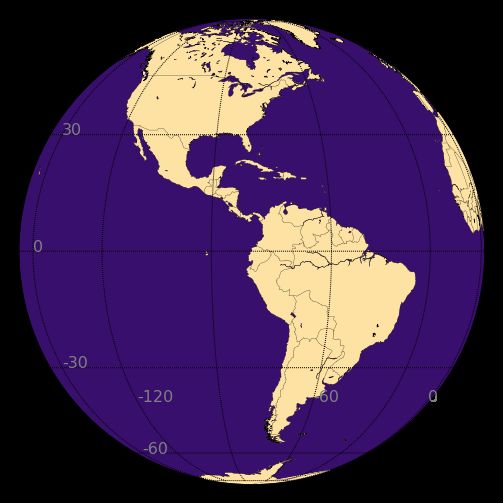
8                                         Thomas Siegert, Deirdre Horan, Gottfried Kanbach

    In addition to this MeV gap for continuum emission, there is also a similar prob-
lem for nuclear γ-ray lines. While COMPTEL on CGRO could, for example, iden-
tify narrow line emission at 1.8 MeV, its spectral resolution was only 10 % (FWHM)
so that many lines blended together to form one broad feature. High spectral resolu-
tion in the MeV range can be achieved by the use of germanium detectors (Sec. 4.7),
such as in RHESSI or SPI. While increased spectral resolution helps to identify back-
ground features more easily, the small collecting area still prohibits the investigation
of many potential astrophysical sources. As of now, only a dozen nuclear lines of
astrophysical origin have been observed with HEAO-3, COMPTEL, RHESSI, SPI
(and NuSTAR). These include the positron annihilation line from the centre of the
Galaxy at 511 keV [e.g., 11, 12, 13, 14, 15, 16], short- and long-lived ejecta from
massive stars and their supernovae such as 44 Ti [e.g., 17, 18, 19, 20, 21, 22, at 68, 78,
1157 keV], 26 Al [e.g., 23, 24, 25, 26, 27, at 1809 keV], and 60 Fe [e.g., 28, 29, 30, at
1173 and 1332 keV], short-lived isotopes powering the early light-curves of type Ia
supernovae [e.g., 31, 32, 33, 34, with 56 Ni and 56 Co at 158, 812, and 847, 1238 keV,
respectively], as well as nuclear excitation lines from solar flares [e.g., 35, 36, with
511 keV from electron-positron annihilation, 2 H at 2223, 12 C at 4438, and 16 O at
6129 keV, among others]. With a factor of ten improvement in the line sensitiv-
ity, the number of detected lines, and therefore the science enabled by this, could
increase by the same order of magnitude, eventually finding CR excitation of inter-
stellar medium material, ejecta from classical novae, and multiple supernova lines
[e.g., 37]. The advantage of nuclear line studies is the possibility of finding an abso-
lute measure of ejecta masses, CR fluxes, and kinematics, which may be biased by
using observations at other wavelengths.

1.3 Interactions of Light with Matter

While for longer-wavelength light, most interactions with matter are either of re-
fractive, reflective or diffractive nature owing to the wave character of light, higher
energy photons experience processes prone to particles instead of waves. These are
used to determine the energy of the incoming light by measuring their partial or total
deposits in the detecting material. While more processes can occur, the most rele-
vant reactions for X- and γ-ray photons are photoelectric absorption (photo-effect),
Compton scattering, and pair production.
   The photo effect [38] describes a photon undergoing an interaction with an atom
in which the photon deposits its total energy and is removed completely. To conserve
momentum and energy, a photoelectron is emitted by the absorbing atom. Since
the interaction is with the atom as a whole, having bound electrons in its shells,
the photo effect cannot occur on free electrons. The most probable electron to be
ejected in photoelectric absorption is the one most tightly bound in the K-shell. The
photoelectron has an energy of Ee = Eγ − Eb where Eb is the binding energy of the
electron in the atom. The interaction probability for a γ-ray photon to undergo the
photo effect is described by the cross section, typically as a function of energy,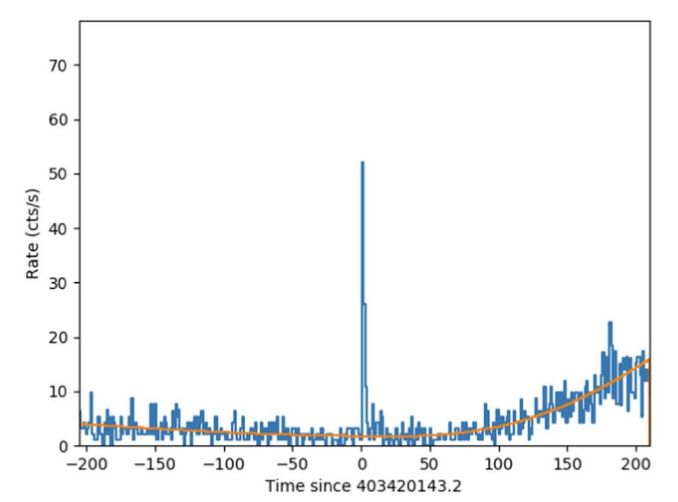
Telescope Concepts in Gamma-Ray Astronomy                                             9

                                      16 √          Z5
                              σPE =       2πre2 α 4 3.5 ,                           (2)
                                      3            k
where re is the classical electron radius, α is the finestructure constant, Z is the
atomic charge number, and k = Eγ /(me c2 ) is the photon energy in units of electron
rest masses [39]. Equation (2) is a valid approximation for k . 0.9; for higher ener-
gies and, for more precision over large photon energy ranges, the cross section from
[40] should be used.
   At photon energies of approximately between k = 0.1–1.0, depending on the
material, the Compton effect [41] becomes the dominant interaction process of light
with matter. Compton scattering describes the process of a γ-ray undergoing scatter-
ing with an electron, assumed to be at rest. The photon changes its path as a result
of this process and transfers some of its energy to the electron which then recoils.
The deflection angle, also called the Compton scattering angle ϕ, is the fundamental
property that determines the origin of the γ-rays in Compton telescopes (Sec. 4.3).
Because, in principle, the range of scattering angles covers a full circle, the process
of Compton scattering, i.e. the photon loses energy to enhance the kinetic energy
of the electron, can also be inverted to Inverse Compton scattering, i.e. the photon
gains energy by scattering with fast electrons. In the range k = 0.2–20 [39], the total
cross section for Compton scattering is approximated by

                   1 + k 2(1 + k) ln(1 + 2k)           ln(1 + 2k)     1 + 3k
   σCE = Z2πre2                     −               +             −              . (3)
                     k2     1 + 2k         k               2k       (1 + 2k)2

Higher order corrections can again be found in [40].
   For k > 2, pair production [42], i.e. the conversion of a γ-ray into an electron-
positron-pair, becomes possible. While formally, the production of pairs starts at
twice the rest mass energy of an electron of 1.022 MeV, the interaction probabil-
ity stays at a low level until the cross sections dominate, typically above k = 20.
Pair production can occur in any electromagnetic field; for the detection of γ-rays,
the Coulomb fields of nuclei are to be considered. The γ-ray photon loses all of its
energy in the process, is removed from the scheme, and replaced by a pair that car-
ries the total energy of the photon. The kinetic energy of the electron and positron,
respectively, is symmetric about half the energy of the incident photon, minus the
rest mass energy of the electron. The interaction cross section for pair production
[39, 40] is
                                     28         218
                    σPP = Z 2 αre2      ln 2k −     + O(ln k/k2 ) ,               (4)
                                      9          27
where higher order terms span several lines of terms. The important feature to note
here is that the cross section for pair production in the field of a nucleus increases
with the charge number of the nucleus squared.
    In detail, the cross sections vary for different materials, compositions, and matter
structures. In Fig. 5, the mass attenuation coefficients, nσ /ρ, with ρ being the den-
sity and n being the number density of the material, for γ-ray detector media that are
typically used are shown. The shapes of photo effect, Compton scattering, and pair
10                                                                                                  Thomas Siegert, Deirdre Horan, Gottfried Kanbach

                              104                                      Germanium                                                   104                                        BGO
                                                                       Silicon                                                                                                CZT
                              103                                                                                                  103

Mass Attenuation [cm2 g 1]

                                                                                                      Mass Attenuation [cm2 g 1]
                                                                       Rayleigh Scattering                                                                                    Rayleigh Scattering
                                                                       Photoelectric Absorption                                    102                                        Photoelectric Absorption
                              102                                      Compton Scattering                                                                                     Compton Scattering
                                                                       Pair Production                                             101                                        Pair Production
                              101                                      Total Attenuation                                                                                      Total Attenuation
                              100                                                                                                  100
                             10 1                                                                                                  10   1

                             10 2                                                                                                  10   2

                             10 3                                                                                                  10   3

                             10 10
                                 4
                                     3   10   2   10   1    100 101 102 103          104      105                                  10 10
                                                                                                                                       4
                                                                                                                                            3   10   2   10   1    100 101 102 103          104      105
                                                           Photon Energy [MeV]                                                                                    Photon Energy [MeV]

Fig. 5 Mass attenuation coefficients for commonly used detector materials as a function of pho-
ton energy. The individual interaction processes are shown as coloured lines. Left: Germanium
(solid) and Silicon (dashed). Compton scattering dominates in the energy range ∼ 200 keV to
∼ 10 MeV which makes these semiconductors efficient scattering detectors. Right: BGO (solid)
and CZT (dashed). In these high-Z materials absorption through photo-effect or pair-creation is
more pronounced.

production are similar for the elements and compounds shown, however the minus-
cule details change the behaviours and areas of use of the detectors. For example,
plastic shows a much broader Compton scattering regime compared to other scin-
tillating materials (e.g., BGO), making it the scattering material of choice of classic
Compton telescopes (Sec. 4.3).

2 Instrument Capabilities and Requirements

In order to do γ-ray astronomy, the direction from which the γ-ray originated, its
time of arrival, its energy and its polarisation would, ideally, be determined accu-
rately. Depending upon the energy of the incident γ-ray and upon the nature of the
source of interest, different types of γ-ray detectors are required for this task. As
will be discussed in Sec. 3, some scientific objectives require highly-accurate en-
ergy resolution, usually achieved at the expense of positional accuracy i.e., angular
resolution. Conversely, when high angular resolution is required, the spectral accu-
racy of the measurement usually has to be compromised. Gamma-ray polarimetry is
an upcoming field and individual Chapters in this book are dedicated to this topic;
a brief overview of measuring the polarisation of γ-rays is provided later in this
current Chapter.
    A massive detector with limited positional but good energy resolution and deep
enough to absorb most of the scattered photons can be used as calorimeter to mea-
sure spectra of incident γ radiation. Limited angular resolution can be achieved by
fitting massive anti-coincidence wells around the detectors leaving an ‘acceptance
angle’ free, or by constraining the field of view with a passive or active collima-
tor. A modern high-resolution Ge spectrometer is the MeV spectrometer SPI on
Telescope Concepts in Gamma-Ray Astronomy 11
104 101
Angular Resolution [deg]
100
Effective Area [cm2]
103
NuSTAR 10 1
BAT
102 ISGRI
SPI
RHESSI 10 2
COMPTEL
COS-B
101 EGRET 10 3
LAT
10 2 10 1 100 101 102 103 104 105 10 2 10 1 100 101 102 103 104 105
Energy [MeV] Energy [MeV]
100 103
Energy Resolution [FWHM/E]
Timing Resolution [ s]
10 1 102
NuSTAR
BAT
ISGRI
10 2
SPI 101
RHESSI
COMPTEL
COS-B
EGRET
10 3
LAT
10 2 10 1 100 101 102 103 104 105 1010
0
2 10 1 100 101 102 103 104 105
Energy [MeV] Energy [MeV]
Fig. 6 Characteristics of a selection of historic and current instruments as a function of photon
energy. Top left: Effective area. Top Right: Angular resolution. Bottom left: FWHM energy reso-
lution. Bottom right: Timing Accuracy.
the INTEGRAL mission [43, 44], which in addition to a massive anti-coincidence
well encodes the incident γ-ray beam through a coded mask to enable imaging of
radiation sources (Sec. 4.2).
In order to detect a γ-ray via its pair-production interaction whilst extracting
as much positional and energy information as possible, two main elements are re-
quired: Firstly, the γ-ray must be made to interact, i.e. pair produce, in the detector.
In order to increase the probability of the γ-ray pair-producing, a high-Z material
is required. For the Energetic Gamma Ray Experiment Telescope (EGRET) detec-
tor aboard CGRO, this comprised tantalum foils [45] while for both the Large Area
Telescope (LAT), on board the Fermi satellite and the Gamma-Ray Imaging Detec-
tor (GRID) on the Astro-rivelatore Gamma a Immagini LEggero (AGILE) satellite,
the high-Z converter material used is by tungsten [46, 47]. The resulting electron-
positron pair must then be tracked as accurately as possible so that the direction of
the incident γ-ray can be reconstructed. This is done by measuring the passage of
the electron/positron pair by the tracker. For EGRET this was achieved by means
of a multilevel spark chamber [45]. In both LAT and AGILE’s GRID, the trajec-
tory of the charged particles is recorded by layers of silicon strip detectors [46, 47]
(Sec. 4.4).12 Thomas Siegert, Deirdre Horan, Gottfried Kanbach To determine the energy of a γ-ray, it is desirable to stop the electron-positron pair in the detector via a calorimeter, where the total energy deposit is measured. For EGRET a large NaI Total Absorption Shower Counter was the principal energy- measuring device while in LAT the calorimeter comprises 16 modules, each of which is composed of 96 CsI(T1) crystals. The calorimeter on AGILE’s GRID is also composed of CsI(T1), in this case 30 bars arranged in two planes [47]. In addi- tion to providing an energy measurement, a segmented calorimeter can also act as an anchor for the electromagnetic particle shower, providing further positional infor- mation to aid with pinpointing the direction of the incident γ-ray and to help with background discrimination (Sec. 2.3.3). The required elements of a γ-ray detector operating in the pair-production regime are, therefore, a tracker and a calorimeter. Not essential for the detection of the γ-ray but absolutely necessary so as to reject the overwhelming background of charged CRs that constantly bombard the instrument is an anticoincidence detector (ACD, Sec. 2.3.1). This allows the detec- tor to self-veto upon the entry of a charged particle so it is essential that it have high detection efficiency for such particles. The ACD of EGRET comprised a large scintillator which surrounded the spark chamber. As is discussed in chapter about EGRET in this book, backsplash, whereby a charged particle generated inside the detector traversed the ACD and thus caused a false veto, became a problem above 10 GeV (Sec. 2.2.2). To avoid backsplash, the ACDs of both the LAT and AGILE are segmented allowing only the segment adjacent to the incident photon candidate to be examined when searching for a veto. This drastically reduces the effects of backsplash allowing for a much more efficient background rejection by the ACD. All these considerations are summarised in the four basic parameters of any γ- ray telescope, most importantly the effective area, as well as the energy, angular and temporal resolution. An overview of current and past γ-ray instruments in the MeV– GeV range is provided in Fig. 6. It is clear that the effective area is the reason why there is such a great loss in sensitivity in the MeV range (. 100 cm2 ) compared to the keV or GeV range (both & 1000 cm2 ; Sec. 1.2). However, because of Ge detec- tors, for example, the spectral resolution of MeV instruments (FWHM/E ≈ 10−3 – 10−2 ) can supersede those of GeV instruments by two orders of magnitude. The angular resolution of MeV telescopes can be similar to those of GeV telescopes, but only under specific circumstances, for example when observing the Sun in the case of RHESSI with a temporal modulation aperture (Sec. 4.2). Normally, Compton telescopes suffer from their inherently poor angular resolution on the order of de- grees, whereas coded-mask telescopes could achieve arcminute resolutions or better (see Sec. 4.2). GeV telescopes can be considered almost direct imaging telescopes as the dispersion is only important for lower energies. Because of the trackers, an- gular resolutions below the 0.1◦ -scale are possible. Finally, the scarcity of γ-rays from celestial sources as well as their intrinsic temporal variability imposes a tim- ing resolution requirement of approximately 100 µs.
Telescope Concepts in Gamma-Ray Astronomy                                                                                                                       13

2.1 Earth’s Atmosphere and Space Environment

2.1.1 Atmospheric Effects

While at sea level the Earth’s atmosphere blocks almost all low- and high-energy
γ-rays to the extent that ground-based observations are impossible, high-altitude
observations are still worth the effort and reduce the cost. For instrument prototypes,
in particular, balloon flights are often used to test new apertures and concepts.

                     100                                                                                        100      Energy:
                                                                                                                         10 keV
                                                                                                                         511 keV
                     80                                                                                         80       2 MeV
                                                           Air plane                                                     5 GeV
                                                           cruising altitude (12 km)
Transmissivity [%]

                                                                                           Transmissivity [%]
                                                           Zero pressure balloon                                         100 GeV
                                                           altitude (33 km)                                              Zenith:
                     60                                    Start of mesosphere (80 km)                          60       0 deg
                                                           Zenith:                                                       30 deg
                                                           0 deg                                                         60 deg
                     40                                    30 deg                                               40       90 deg
                                                           60 deg
                                                           90 deg
                     20                                                                                         20

                      0
                      10   3   10   2   10   1    100 101 102 103            104     105                         0 101                                          102
                                                 Photon Energy [MeV]                                                               Altitude above Ground [km]

Fig. 7 Transmissivity of Earth’s atmosphere as a function of incoming photon energy (left) and
observation altitude above surface (right) for different zenith angles.

    In Fig. 7 the transmissivity of the Earth’s atmosphere is shown for different pho-
ton energies, incidence angles (zenith), and altitudes above the surface [48, 49]. The
transmissivity is defined as the probability for a photon to reach a certain altitude
without previous interaction and therefore to be unabsorbed. At aeroplane cruising
altitudes (12 km), for example, the chance for a 1 MeV photon to pass through the
upper layers of the atmosphere is 0.001 % at most (i.e. at zenith). At this height,
the transmissivity is maximised for 40 MeV photons at about 5 %. Because of the
exponential decrease in the density of the atmosphere, the stratosphere layers of the
atmosphere (up to 50 km above ground) provide a useful environment for γ-rays
telescopes. At typical balloon flight altitudes of around 30 km, the zenith transmis-
sivity is already around 30 % for photon energies of 50 keV. Up to 40 MeV, the
transmissivity grows exponentially to about 85 % and slightly declines afterwards
to flatten out at 80 % for GeV energies. Clearly, with the beginning of the meso-
sphere at altitude of approximately 80 km, essentially all γ-rays photons are directly
measurable, and only soft and hard X-ray photons remain absorbed. Beyond the von
Karman line at around 100 km, which conventionally defines the border between the
atmosphere and space, all photons are readily detected as the transmissivity is nearly
100 % throughout the electromagnetic spectrum.
    Most important for γ-ray observations at balloon altitudes, however, is the zenith
angle dependence. For the same photon energy and observation altitude, different
zenith angles lead to vastly different transmissivities and therefore a much more
drastic change in the effective area of the instrument (Sec. 4). While response func-
14 Thomas Siegert, Deirdre Horan, Gottfried Kanbach
tions for balloon experiments take into account the zenith dependence of their effec-
tive area, the simulations to provide a reasonable measure of the atmosphere effects
require different setups depending on the balloon position around the Earth. This
is the case because the local atmospheric conditions, including density and temper-
ature for example, and in particular, the magnetic cutoff rigidity change with the
Earth’s latitude and longitude [50].
2.1.2 In-Space Observations
Passing the 100 km mark, γ-ray instruments experience the space environment
which mainly concerns the distributions of charged particles. In terms of onboard
electronics, the instruments start to suffer more single event latch-ups and other ef-
fects. These are short circuits caused by heavy ions or protons hitting the electronics
and triggering semiconductor band transitions. Apart from the latch-ups the detec-
tors themselves are also more susceptible to incoming radiation. This can be used
as an advantage to measure the in-orbit particle spectrum, and therefore provide a
measure for the instrumental background (Sec. 2.2). Depending on the energy of the
charged particles, they produce secondary particles when interacting with the instru-
ment or satellite material. The secondary particles compose most of the instrumental
background for γ-ray measurements in space, especially in the MeV range.
Rotational
Axis
30°N
Inner 0°
SAA Belt
Outer
Belt
30°S
Magnetic
Axis
60°S
Fig. 8 Van Allen Radiation Belts around Earth (left) with Inner and Outer belts (to scale). Because
the Earth’s magnetic field is tilted with respect to its rotational axis (dashed line), the closest part
of the Inner belt can reach to about 200 km above the southern Atlantic. This is called the South
Atlantic Anomaly (SAA, right, adapted from [51], and reproduced with permission). Shown is the
difference to the mean magnetic field intensity of 45.8 µT (red solid line) in steps of 4.1 µT until
the region defining the SAA (solid purple line). Inside the purple region, the steps are 0.6 µT for a
minimum around Earth longitude and latitude of 60◦ W and 28◦ S.
The concentration of charged particles around Earth is not homogeneous. Be-
cause of the Earth’s magnetic field, charged particles are trapped around the planet in
torus-like accumulations (Fig. 8). These are known as the Van Allen Radiation Belts
[e.g., 52]. Two tori trap electrons and protons, and to a lesser extent α-particles,
reaching from 0.2 out to 2 Earth radii (Inner belt) and from 3 to 10 Earth radiiTelescope Concepts in Gamma-Ray Astronomy 15
(Outer belt), respectively. While the Inner belt contains sub-relativistic electrons
(few hundred keV) and protons (∼ 100 MeV), the Outer belt also holds relativistic
electrons (up to 10 MeV). The Outer belt is more easily influenced by the Sun and
therefore more variable than the Inner belt.
Because the magnetic field of Earth is slightly tilted with respect to its rotational
axis the centres of the belts are further shifted from Earth’s centre, the Inner belt
has an anomalously close approach at one specific region to the East of the South
American continent. This is called the South Atlantic Anomaly [SAA, e.g., 53, 51].
The anomaly represents an area in which the Earth’s magnetic field is weakest rela-
tive to its surroundings (Fig. 8, right). In this region, the Inner belt approaches within
200 km of the surface which results in higher abundances of energetic particles. This
leads to an enhanced instrumental background for satellite observatories (Sec. 2.2).
2.1.3 Orbit Considerations
There are options to alleviate the impact of the SAA and Van Allen Radiation Belts
when the orbit of the satellite onboard which the instrument will be mounted is cho-
sen. However, not all instruments suffer from the effects of the increased radiation
in the same way. While MeV telescopes without major event selection capabilities
(Sec. 2.3.3) should avoid the SAA altogether, GeV instruments are typically placed
in LEO, i.e. orbits between 200 and 2000 km. Most astronomical observatories in
LEO are found between 450 and 600 km. Above an orbit of 1200 km, the radia-
tion belts would again lead to a much increased instrumental background. For MeV
transient observatories in particular, such as, for example Fermi-GBM, the enhanced
particle flux at LEO is of only mediocre concern because the background for short
time scales (on the order of seconds or less) can easily be determined from adjacent
times.
0
30
-30 -120
-60
Start
0 -60
Flight Path
-180
End
0
60 120 -180
120
60
Fig. 9 Satellite orbits and balloon flight paths. From left to right are shown the Fermi orbit, the
INTEGRAL orbit, and the COSI balloon path from a campaign during 2016. The orbits in each
panel are to scale.16 Thomas Siegert, Deirdre Horan, Gottfried Kanbach
For longer and targeted MeV observations, the radiation belts would lead to an
insurmountable background rate which would heavily reduce the sensitivity of the
instrument. For this reason, MeV observatories like INTEGRAL chose high ec-
centricity and high inclination orbits to escape the radiation belts for a significant
amount of their orbits. The initial INTEGRAL orbit, for example, was a 72-hour
orbit with an inclination of 52◦ and an apogee and perigee of 154000 and 9000 km,
respectively. Since the Outer belt is populated with charged particles to at most 10
Earth radii (∼ 65000 km), most of the time spent in this orbit (∼ 90 %) is far away
from the increased radiation. However, the instruments onboard INTEGRAL have
to be switched off every time it approaches Earth.
For special tasks which cannot (or can only inaccurately) be performed by single
instruments, special orbits can be considered. For example, some transient moni-
tors have hardly any spatial resolution but can, however, be used in combination
to provide highly accurate localisations (Sec. 4.6.4). The difference in the photon
arrival times of transients can be used in triangulation to map overlapping annuli
onto the sphere of the sky. The larger the leverage arm, i.e. the larger the light travel
distance between instruments, the better the localisation accuracy. In particular, the
Gamma-Ray Spectrometer onboard Mars Odyssey in a Mars orbit provides a valu-
able baseline for Earth-orbiting transient detectors. This technique led to the term
Interplanetary Network (IPN, [e.g., 54]; Sec. 4.6.4), for transient localisation with
triangulation. Another ‘orbit’ of interest for γ-ray and other observatories is the La-
grange points, L2, of the Sun-Earth system (e.g., Wind, Spektr-RG), which also
provide an excellent baseline for IPN measurements.
While satellites follow a specified path and can, most of the time, perform ma-
noeuvres to correct their orbits (and to make sure that they re-enter the atmosphere
when the mission is decommissioned), balloons have no or only little capability to
adjust their flight paths. Because of security concerns, among others, balloon flights
are typically launched from remote areas, such as Antarctica, or those which are
only sparsely populated. After the launch, the balloons experience the natural Earth
environment and float freely governed by wind (lower atmosphere), temperature
(day and night cycle), and torque (rotation of the Earth). Because the power genera-
tion has to be secured, which is mostly done with solar panels, the balloon gondolas
are rotated towards the Sun during daylight. This also holds the aspect angle of the
instruments, which simplifies the analysis. At night, the gondolas can again tumble
freely and minuscule changes in the altitude can lead to extreme variations in the
flight paths. As examples, we show two satellite orbits as well as the long-duration
balloon flight path of the COSI prototype in Fig. 9. For more details on orbital con-
siderations, the reader is referred to the Chapter on orbits and background of γ-ray
space instruments in this book.Telescope Concepts in Gamma-Ray Astronomy 17
2.2 Instrumental Background
2.2.1 Variations of the Background
The interaction of charged particles, i.e. in general CRs, with instrument and satel-
lite material leads to several different components that are summarised under the
term instrumental background. These are all unwanted primary and secondary par-
ticles and photons which lead to enhanced count rates in the instruments, dilut-
ing the celestial signals of interest. The interactions of CRs with matter lead to
inverse Compton scattering, bremsstrahlung, nuclear excitation, spallation, radioac-
tive build-up and decay, particle-antiparticle annihilation, and secondary particle
production which can also undergo all of the previous interactions again. This results
in a cascade of interactions that, depending on the energy range of the instruments,
are measured continuously.
1.6 Instrumental Continuum 175 8 60Co( )60Ni
175
(780-920 keV) (1173.23 & 1332.49 keV)
Sunspot Number 7 Sunspot Number
1.4 (monthly averaged) 150 (monthly averaged) 150
Count Rate [10 3 cnt s 1]
6
Count Rate [cnt s 1]
125 125
Sunspot Number
Sunspot Number
1.2
5
100 100
1.0 4
75 75
3
0.8 50 50
2
0.6 25 25
1
0 0 0
0.4 53000 54500 56000 57500 59000 53000 54500 56000 57500 59000
Time [MJD] Time [MJD]
1.2 48V(EC)48Ti 400 GBM (100-300 keV)
(1312.10 keV) Total Model
1.0
Fitted half-life time:
16.03 ± 0.28 d 350 Cosmic-Rays
Literature value: CGB
Count Rate [10 2 cnt s 1]
15.97 d 300 Earth Albedo
Count Rate [cnt s 1]
0.8 SAA Decay
250 Sun
0.6 200
0.4 150
100
0.2 50
0.0 0
52850 52900 52950 53000 53050 53100 0 20000 40000 60000 80000
Time [MJD] Time [Seconds of a Day]
Fig. 10 CR induced background rates for different processes from different origins. Top left:
Prompt MeV background is anticorrelated to the Sun-spot number, and thus with the solar mag-
netic field. Top right: Radioactive build-up can occur when the lifetime of isotopes (here 60 Co) is
much longer than the activation function (cosmic-ray flux, inverse proportional to Sun-spot num-
ber). Bottom left: Solar flare events provide a large single dose of mainly protons during a short
amount of time. Intermediate lifetime isotopes (here 48 V) are enhanced by a factor of ten and then
decay according to their decay constants. Bottom right: Equatorial LEO satellites pass the SAA
every 90 min, activating numerous short-lived isotopes which then decay during the next orbit.
Adapted and updated from [55] and [56] - reproduced with permission.18 Thomas Siegert, Deirdre Horan, Gottfried Kanbach
The largest impact on the amplitudes of these processes is given by the solar
activity and the terrestrial and solar magnetic field. Long-term trends in the instru-
mental background rate of MeV instruments are anti-correlated with the Sunspot
number [e.g., 57, 58], which is a direct indicator of the solar magnetic activity cy-
cle of eleven years (Fig. 10, top left). The solar modulation of CRs is related to the
intensity of the turbulent solar wind, which increases when the Sun’s magnetic field
is strong. In other words this means that when there is a high number of Sunspots,
the instruments are better shielded from CRs. This leads to a reduction of the instru-
mental background rate which is why γ-ray missions are typically launched during
or before the solar maximum. One famous example for this is the Solar Maximum
Mission (SMM) launched in 1980. Two solar cycles later in 2002, INTEGRAL was
launched – also near the solar maximum. Depending in addition on the chosen satel-
lite orbit, the background rate can more than double between the solar maximum and
minimum. This effect is visible for prompt background phenomena such as continu-
ous processes (e.g., bremsstrahlung; Fig. 10 top left), nuclear excitation followed by
fast deexcitation which typically happens on the order of nanoseconds, and particle
production with fast decays from pions or β -unstable elements.
If the lifetime of the particles produced is (much) longer than the production
time scale through CR bombardment, two other temporal evolutions of the back-
ground can be found. For example, if the radiation dose hitting the satellite is dras-
tically increased, such as during a solar flare event with a coronal mass ejection, the
background rates from γ-rays of all isotopes in the satellite can rise by several or-
ders of magnitude. For isotopes produced during such events that are longer-lived,
the background rate then stays at a high level even long after the initial dose. In
Fig. 10, bottom left, the rise of the background rate from the element 48 V is shown.
From a rather constant background rate of ∼ 6 × 10⁻⁴ cnts s−1 before the X-class
solar flare on October 23rd 2003 (= MJD 52935), the 48 V rate rises to more than
1 × 10⁻² cnts s−1 . Because 48 V has a half-life time of 16 d, its rate decays only ac-
cording to this decay time; the expected exponential decay is clearly seen. Such
nuclear reactions occur continuously, either converting stable satellite materiel to
radioactive isotopes, which then decay promptly or with some delay, or directly ex-
citing the nuclei of the instrument which then de-excite by the emission of γ-ray
photons. These γ-ray photons have specific energies so that individual isotopes and
processes can be identified which helps in suppressing the instrumental background
as a whole.
In the case of a regularly enhanced dose of radiation, for example by the passage
through the SAA for LEO missions, the decays might not even go back to the base
level because after about 90 min, the next passage of enhanced radiation occurs.
This is shown in Fig. 10, bottom right, from a measurement of Fermi-GBM over the
course of one day. Sixteen subsequent orbits and the different components making
up the total measurement are shown. While after the first three SAA passages, the
corresponding levels go back to nearly zero, orbits 4–7 obtain a higher radiation
dose so that until 40000 seconds, the background rate gradually builds up. After
orbit 8, only the very short-lived isotopes are seen in the data, while the build-up is
still decaying on its own timescale. Other components, such as the Earth albedo, theTelescope Concepts in Gamma-Ray Astronomy 19
general CR activation rate outside the SAA, the cosmic γ-ray background, as well
as the Sun as a γ-ray source itself, stay constant. Only the change in orientation and
aspect of the instrument with respect to the different astrophysical and background
sources let the rates appear varying [56]. If the radioactive decay time of isotopes
is much longer than the activation function from CRs, more and more radioactivity
is created inside the instruments. In the case of 60 Co, for example, with a half-life
time of 5.27 yr, the decay rate is so small that over very long times, the background
rate rises because there is radioactivity built up. Fig. 10, top right, shows the rate of
the two γ-ray lines at 1173 and 1332 keV from the decay of 60 Co over 19 years of
INTEGRAL/SPI measurements. Clearly, as the Sunspot number goes down, i.e. the
activation rate goes up, the 60 Co rate also rises. Since the activation rate drops again
after the solar minimum, but the material still decays, the background rate in these
lines appears constant. Then after the second maximum, the rate rises again.
Beta
Particle
Delayed
Compound Gamma Ray
Nucleus
Radioactive
Incident Nucleus
Cosmic Ray
Product
Target Nucleus
Nucleus Prompt
Gamma Ray
Bremsstrahlung
Target
Gamma Ray
Nucleus
Outgoing
Cosmic Ray
Incident
Cosmic Ray
Intermediate
Incident Meson Compound
Charged Nucleus
Particle Target
Nucleus Outgoing
Charged
Meson Decay
Particle Gamma Rays
Fig. 11 Instrumental background processes. Top: Nuclear excitation of instrument and satellite
material by CR bombardment. An incident particle interacts with a nucleus from the instrument
and forms a new isotope. This is formed in an excited state and de-excites by the emission of a
prompt photon. The nucleus might still be left radioactive and decays (shown here as β -decay)
toward a final nucleus, which may also involve the emission of a then delayed photon. Bottom
left: Bremsstrahlung of a charged particle moving in the field of a nucleus. A negatively charged
electron approaches the positively charged electric field of a target nucleus. By a change of direc-
tion due to electrostatic attraction (or repulsion in the case of positrons), the electron is emitting
bremsstrahlung photons equivalent to the change of its kinetic energy. Bottom right: Particle pro-
duction by relativistic CRs. If the incident CR is energetic enough, particle production can occur
(similar to accelerator experiments). The thresholds to produce certain particles depends on the par-
ticles’ rest masses and the interacting nuclei. In the case of mesons being produced, for example
neutral pions (π 0 ), they decay on time scales of nanoseconds or less, and emit γ-ray photons.20 Thomas Siegert, Deirdre Horan, Gottfried Kanbach 2.2.2 Background as a Function of Energy Since most γ-ray telescopes cover one or more decades of the electromagnetic spec- trum, their measurements, and in particular their background, can appear quite different. Depending on the spectral resolution, which, technologically, can be much higher at MeV energies compared to GeV energies, the general appearance changes. At MeV energies, the background spectra are dominated by an electron bremsstrahlung continuum with a multitude of γ-ray lines on top (see Fig. 11 for an overview of background processes). Above ∼ 20 MeV, the decay and de-excitation lines from nuclei cease and the spectrum is a pure continuum up even to very high energies (TeV). Pion production and decay (e.g., p + p → p + p + π 0 , followed by π 0 → γγ) describes the transition region from the MeV to the GeV background. While these interactions would produce a spectrum peaking at 67.5 MeV (half the rest mass of π 0 ) with a high-energy tail mimicking the incident proton spectrum, most of these interactions inside the instrument can be rejected due to their different signatures. Fig. 12 Example of measured (background) spectra. Top left: NuSTAR from [59]. Top right: IN- TEGRAL/SPI from [55]. Bottom left: COMPTEL reproduced with permission from [60]. Bottom right: Fermi-LAT reproduced with permission from [61]. The nuclear lines directly reflect the elemental composition of the satellite, the instrument, and the Earth’s atmosphere. For example, shown in Fig. 12, top, are the highly resolved NuSTAR and SPI background spectra. Most of the lines below ∼ 100 keV are due to X-ray fluorescence of satellite material, i.e. atoms become ion- ized due to impinging radiation, which leads to an electronic transition from higher to lower shells, followed by the emission of a characteristic photon. Depending on
Telescope Concepts in Gamma-Ray Astronomy                                            21

the element, these fluorescence photons can reach up to 115.6 keV (uranium K-
shell), formally being an X-ray photon due to its electronic nature, however falling
into the ‘γ-ray’ regime. The strongest instrumental lines in NuSTAR are due to K-
shell fluorescences of Cesium and Iodine at 28 keV and 31 keV, respectively. Beyond
the fluorescence lines, nuclear excitation lines, also appearing below 100 keV, shape
the background spectra up to ∼ 20 MeV. Nuclear excitation is the interaction of an
incoming particle with only the nucleus of an atom, therefore enhancing the energy
scale of the process. In instruments, either stable nuclei are excited directly by 1–
100 MeV particles, or nuclear reactions, such as proton or neutron capture, lead to
new nuclei which are produced in an excited state and de-excite promptly. For ex-
ample, many of the strongest background lines in SPI are due to neutron captures
and isomeric transitions of germanium isotopes. Isomeric transitions are the spon-
taneous nuclear transitions of a meta-stable nuclear configuration to a less excited
state by the emission of a characteristic γ-ray photon. In SPI and other germanium
detectors, multiple isotopes of germanium are naturally included in the crystals, so
that multiple lines according to the different isotopes occur. The SPI lines at 23.4
and 175.0 keV are due to the second isomeric state of 71m Ge (T1/2 = 20 ms), and
are coincidentally measured at 23.4 + 175.0 (T1/2 = 79 ns) = 198.4 keV to form its
strongest background line [62].
    Another strong line which always occurs in γ-ray measurements is the 511 keV
electron-positron-annihilation line. Either β + -unstable isotopes decay inside the
satellite and produce a positron which quickly finds an electron to annihilate with, or
CR bombardment leads to secondary positrons which slow down and also annihilate
inside the satellite.
    Compared to SPI, COMPTEL had poorer spectral resolution (Fig. 12, bottom
left), so that multiple lines overlapped and merged together as distinct line com-
plexes, or weak lines were just smeared out and drowned in the continuum back-
ground. A prominent line in the COMPTEL background was the neutron capture
line on protons leading to a strong feature at 2.223 MeV. Most of these interactions
occur for high accumulations of protons (hydrogen) which in COMPTEL was found
either in its upper detector module filled with the liquid scintillator NE 213A (i.e.
Xylene, C8 H10 ) or in CGRO’s fuel tanks filled with hydrazine (N2 H4 ) [60].
    In the pair-production regime a reduction in the γ-ray detection efficiency can be
due to a number of effects including instrumental pile-up, the incorrect vetoing of
γ-rays and particle leakage into the detector. One source of instrumental background
is the residual signal that remains from the shower initiated by a charged particle,
which has been vetoed, but whose decay time is such that traces still remain when
a γ-ray enters the detector volume and causes a trigger [63]. In this case, when the
signals from the instrument are read out, there will be the signal due to the gen-
uine γ-ray event but also the residual signal that remains from the previously vetoed
event. This can be seen schematically in Fig. 13. In Fermi-LAT this residual signal
is referred to as a ‘ghost’ event and it can be present in the tracker, the calorimeter,
the ACD or, indeed, in all three as is shown in Fig. 14. The effect has been mod-
elled using simulations so its effects are well understood and are incorporated in the
analysis of LAT data [64].
You can also read