Technical and Economic Feasibility of Solar Pump Irrigation in the North-Niayes Region in Senegal
←
→
Page content transcription
If your browser does not render page correctly, please read the page content below
Engineering, 2021, 13, 399-419
                                                                                                 https://www.scirp.org/journal/eng
                                                                                                            ISSN Online: 1947-394X
                                                                                                              ISSN Print: 1947-3931

Technical and Economic Feasibility of Solar
Pump Irrigation in the North-Niayes Region
in Senegal

Aminata Sarr1,2, Lamine Diop1*, Ibrahima Diatta3, Yaye Deffa Wane1, Ansouma Bodian4,
Sidy Mouhamed Seck3, Nicola Lamaddalena2, Luciano Mateos5
1
 Faculty of Agronomic Sciences, Aquaculture and Food Technology, Gaston Berger University, Sain Louis, Senegal
2
 Irrigated Agriculture, Mediterranean Agronomic Institute of Bari (CIHEAM BARI), Bari, Italy
3
 Interdisciplinary Research Group in Support of Regional Planning and Local Development, Gaston Berger University, Sain Louis,
Senegal
4
 Faculty of Arts and Humanities, Gaston Berger University, Sain Louis, Senegal
5
 Institute for Sustainable Agriculture, CSIC, Córdoba, Spain

How to cite this paper: Sarr, A., Diop, L.,       Abstract
Diatta, I., Wane, Y.D., Bodian, A., Seck, S.M.,
Lamaddalena, N. and Mateos, L. (2021) Tech-       Northern Niayes is an area where agriculture is the main activity. Water used
nical and Economic Feasibility of Solar Pump      for irrigation in this area comes exclusively from groundwater. Farmers do
Irrigation in the North-Niayes Region in          not have access to electricity, thus fuel is the main source of energy used,
Senegal. Engineering, 13, 399-419.
                                                  which is very expensive. The objective of this study was to assess the tech-
https://doi.org/10.4236/eng.2021.137029
                                                  no-economic feasibility of solar irrigation pumps. Regarding technical feasi-
Received: May 3, 2021                             bility, pump sizing was carried out on the basis of irrigation management, ir-
Accepted: July 19, 2021                           rigation techniques, and water distribution. Also, the economic feasibility was
Published: July 22, 2021                          studied on the basis of the Net Present Value, Benefit-Cost Ratio, Internal
                                                  Rate of Return and Payback Period. Results showed for cultivated area rang-
Copyright © 2021 by author(s) and
Scientific Research Publishing Inc.               ing from 0.05 ha to 1.91 ha, pumps’ flow rate does not vary greatly from one
This work is licensed under the Creative          irrigation technique to another. It varies between 2.5 m3/h and 31 m3/h.
Commons Attribution International                 However, pressure and power are higher when using drip and sprinkler irri-
License (CC BY 4.0).                              gation techniques, ranging from 27.8 m to 39.9 m for drip and 40.1 m to 58.5
http://creativecommons.org/licenses/by/4.0/
                                                  m for sprinkler irrigation. The power varies between 0.05 kW and 1.6 kW for
                 Open Access
                                                  manual, between 0.05 kW and 2.5 kW for drip and between 0.1 kW and 4.75
                                                  kW for sprinkler irrigation. The investment cost is variable (669 euros to
                                                  21,400 euros), depending on the cultivated area, pump brands and characte-
                                                  ristics, and irrigation techniques. Results show that the investment cost
                                                  ranges from 669 euros (438,500 CFA) to 4090 euros (2,683,000 CFA) when
                                                  using the manual irrigation technique, from 1281 euros to 20,600 euros when
                                                  using the drip irrigation technique and from 819 euros to 21,403 euros when
                                                  using sprinkler irrigation technique for individual pumps. The investment
                                                  cost is higher when using reservoirs. In this case, the investment cost varied

DOI: 10.4236/eng.2021.137029            Jul. 22, 2021               399                                                Engineering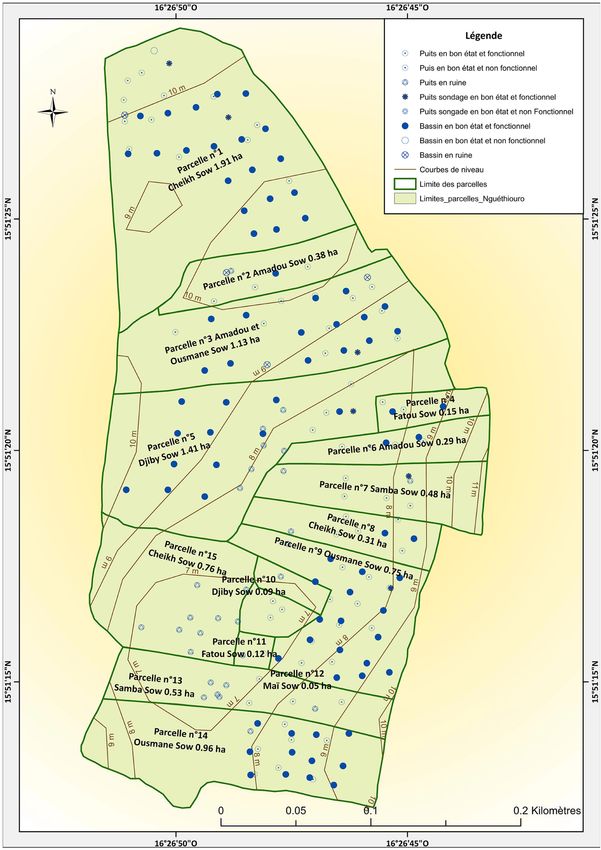
A. Sarr et al.

                                 between €722 and €6062 for manual irrigation, €1532 and €25,882 for drip ir-
                                 rigation and €900 and €28,000 for sprinkling. However, the total investment
                                 cost at the entire lowland scale is higher when farmers use the pumps indivi-
                                 dually and lower when farmers use the pumps in groups when using manual
                                 and drip irrigation techniques. NPV varies between 15,993€ (0.75 ha) and
                                 103,139€ (1.41 ha) and between 13,064€ and 86,139€ when using sprinkler ir-
                                 rigation techniques with PVC pipes and when using the drip irrigation tech-
                                 nique, respectively. BCR is estimated to average 2.2, 2, and 2 respectively
                                 when using manual, drip, and sprinkler irrigation techniques. In addition,
                                 PBP is reached more rapidly when using the manual irrigation technique.

                                 Keywords
                                 Irrigation, Solar, Feasibility, Techno-Economic, Niayes

                               1. Introduction
                               Globally, the population is increasing at significant rate resulting in an increase
                               in food insecurity [1]. Demographic growth and food insecurity must be tackled
                               with an expansion of agriculture and irrigation. Production should be increased
                               taking into account environmental concerns. Moreover, the impact on poorer
                               nations facing food scarcity is far more critical because more land and energy
                               resources are required to provide future demands. In fact, water is one of the
                               world’s most important resources used in irrigation purposes for food produc-
                               tion. Moreover, climate change is exerting negative effects on the earth’s water
                               resources which are crucial for sustainable development [2]. Crop diversification
                               as well as yield increase is possible through irrigation [3]. Irrigation is the most
                               extensive water consumption sector. About 70% of the world’s freshwater ex-
                               traction and 90% of the total water use is for irrigation. Additionally, groundwa-
                               ter remains the most important source of freshwater for many agricultural areas
                               when surface water resources are limited. In fact, underground water is a major
                               drought solution for agricultural production [4].
                                 However, irrigation consumes considerable groundwater resources and re-
                               quires large amounts of energy. The main sources of energy used for irrigation
                               are fuel and electricity which cost high, are not always accessible, and are not
                               sustainable [5]. The cost of this energy source is very high, particularly in Africa,
                               more especially among smallholder farmers, and is associated with a negative
                               environmental impact. The environmental damages mitigation is possible thanks
                               to renewable resources such as solar energy. In fact, solar powered pumping in
                               irrigation provides a green and cost-effective alternative for irrigated agriculture.
                               Solar energy is the world’s largest available energy source [3]. Thus, solar power
                               for irrigation water pumping is a promising alternative [5]. The use photovoltaic
                               solar energy in irrigation in 1977 in Nebraska was among the earliest experi-
                               mental uses of PV solar cells. Within the last decennium, the use of solar irriga-

DOI: 10.4236/eng.2021.137029                        400                                                 Engineering
A. Sarr et al.
tion pumps has expanded in both China and India [6]. More lately, it is observed
an increase in the use of solar pumps in Africa [6]. However, any study on the
technical feasibility of solar irrigation pumps in the Niayes area has not yet been
conducted in the Niayes area in Senegal, to the best of our knowledge.
In North Niayes, farmers use groundwater for irrigation and do not have
access to electricity and, consequently, use fuel as energy source. Therefore, solar
irrigation pump may be a good alternative.
2. Materials and Method
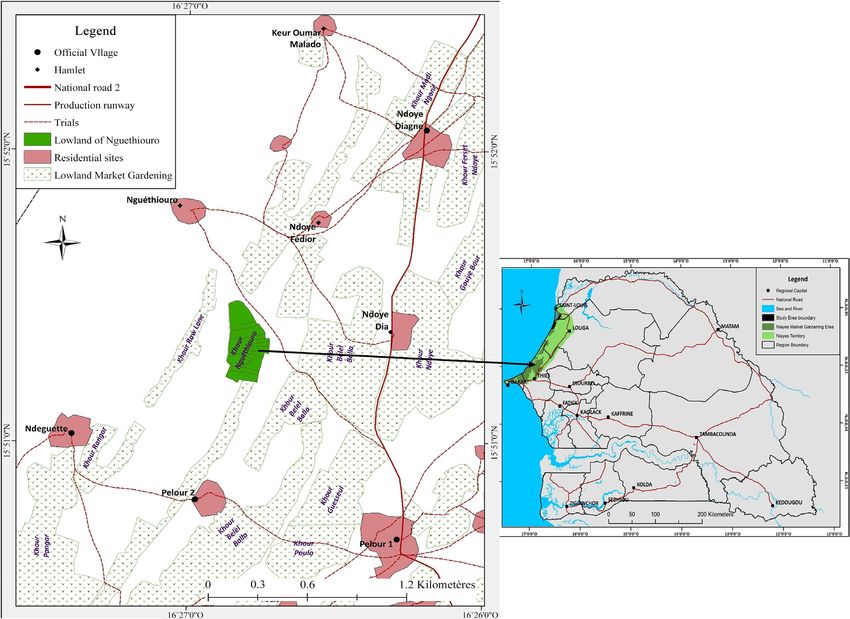
2.1. Presentation of the Study Area
Nguethiouro is a lowland located in the Gandiolais region, at the southern end
of the Senegal Delta. It is an integral part of the Niayes area and occupies its
northern extremity. The Niayes area is a natural region located in the northwest
of Senegal. Nguethiouro is geographically localized between 16˚28'30'' and
16˚24'05'' in western longitude and 15˚50'20'' and 15˚56'10'' in northern latitude
(Figure 1) with altitudes ranging from 6 m to 13 m a.s.l.
This lowland is composed of 15 plots. The plots vary in size from 0.05 ha to
1.91 ha (Figure 2).
Figure 1. Localization of the study area.
DOI: 10.4236/eng.2021.137029 401 Engineering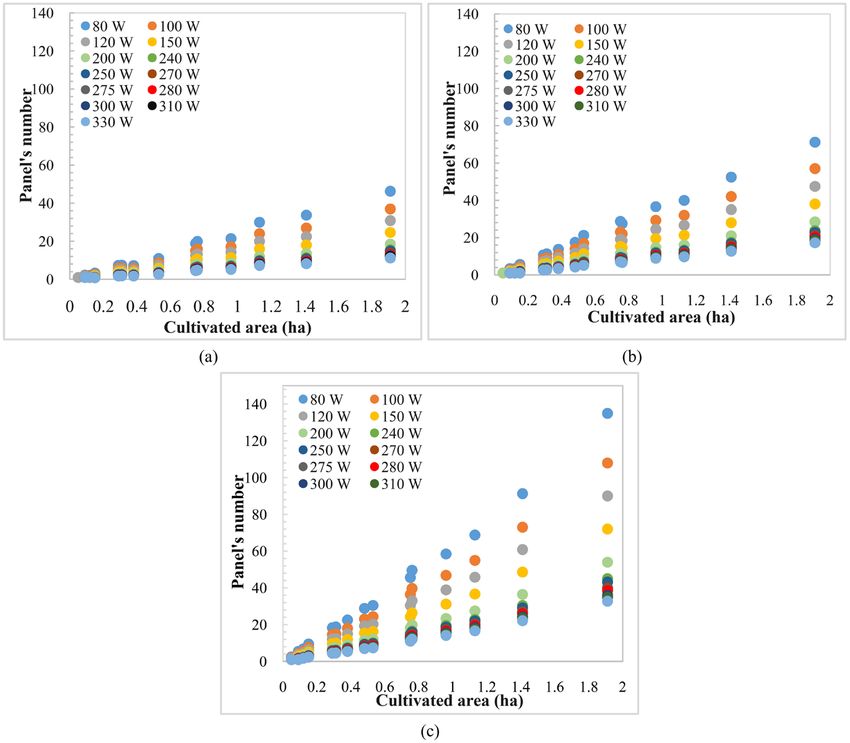
A. Sarr et al.

                               Figure 2. Characterization of the Nguethiouro lowland.

                                       The climate in the Niayes area is of the Sahelian type and is characterize by
                                     the average annual rainfall ranging from 500 mm in the south to 300 mm in
                                     Gandiolais (in the north) where the dry season lasts nine months. Mean annual
                                     temperatures are between 23.7˚C and 25˚C. The presence of the harmattan wind
                                     causes the rise of the temperature at maximum of 31˚C in May and June [7].
                                       Nguethiouro is mainly characterized by sandy soils. The moisture content at
                                     field capacity and at wilting point as well as soil bulk density are considered as
                                     follows (Table 1).

DOI: 10.4236/eng.2021.137029                               402                                             Engineering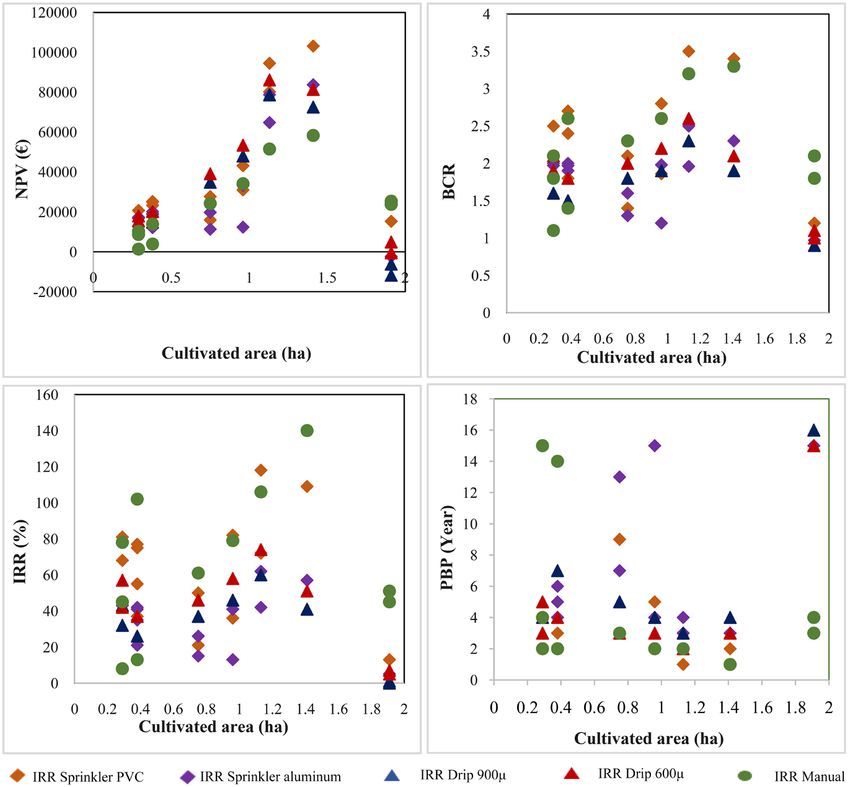
A. Sarr et al.

                               Table 1. Soil characteristics.

                                                 Bulk density                 Soil water content (θ)
                                    Soil type                                                                TAW (mm/m)
                                                 ( ℓb) (mg/m3)      SAT (%)          FC (%)        PWP (%)

                                      Sand           1.71             36               13              6         70

                               Source: [8].

                               2.2. Technical Feasibility of Solar Irrigation Pumps in
                                    Nguethiouro Lowland
                               The technical feasibility of solar irrigation pumps is studied in Nguethiouro
                               lowland based on three main variants: 1) irrigation management, 2) water dis-
                               tribution, and 3) irrigation techniques (Figure 3).

                               Photovoltaic Pumping System Sizing
                               Sizing of solar irrigation systems is performed through three steps: 1) water re-
                               quirements assessment, 2) determination of solar pump characteristics (Flow
                               rate, Pressure head, and Power), 3) determination of photovoltaic generator size
                               and number of panels.
                                  1) Water requirement assessment
                                  Crop water requirements are determined during the period when water de-
                               mand is most intense, based on crop types and cropping calendars of each of
                               them. Crop water requirements assessment is realized based on crop evapo-
                               transpiration (ETc) and effective rainfall (Peff). Parameters related to ETc and
                               Peff are determined based on [9].
                                  ETc is the product of the reference evapotranspiration and the crop coeffi-
                               cient. It is computed using the formula 1:
                                                                    ETc
                                                                     = ETo ∗ Kc                                         (1)
                               where ETo is reference evapotranspiration (mm) and Kc is crop coefficient.
                                 ETo is calculated using FAO-Penman-Monteith Method with the formula 2:
                                                                                   900
                                                             0.408∆ ( Rn − G ) +         u 2 ( es − ea )
                                                   ETo =                        T + 273                                 (2)
                                                                       ∆ + γ (1 + 0.34u 2 )

                               where: ETo is the reference evapotranspiration (mm·day−1), Rn is the net radia-
                               tion (MJ·m−2·day−1), G is the soil heat flux density (MJ·m−2·day−1), T is the mean
                               daily air temperature at 2 m height (˚C), Δ is the slope of the saturated vapor
                               pressure curve (kPa·˚C−1), γ is the psychometric constant (66 Pa·˚C−1), es is the
                               saturated vapor pressure at air temperature (kPa), ea is the actual vapor pressure
                               (kPa), and u2 is the wind speed measured at 2 m height (m·s−1).
                                  2) Water requirement assessment
                                  Net irrigation requirement refers to the amount of water required to compen-
                               sate evapotranspiration losses from a crop during a specified period. It is calcu-
                               lated based on formula 3 given by [9]:
                                                                   NIR
                                                                    = ETc − Peff                                        (3)

                               where: ETc is Crop evapotranspiration (mm) and Peff is Effective rainfall (mm).

DOI: 10.4236/eng.2021.137029                           403                                                    Engineering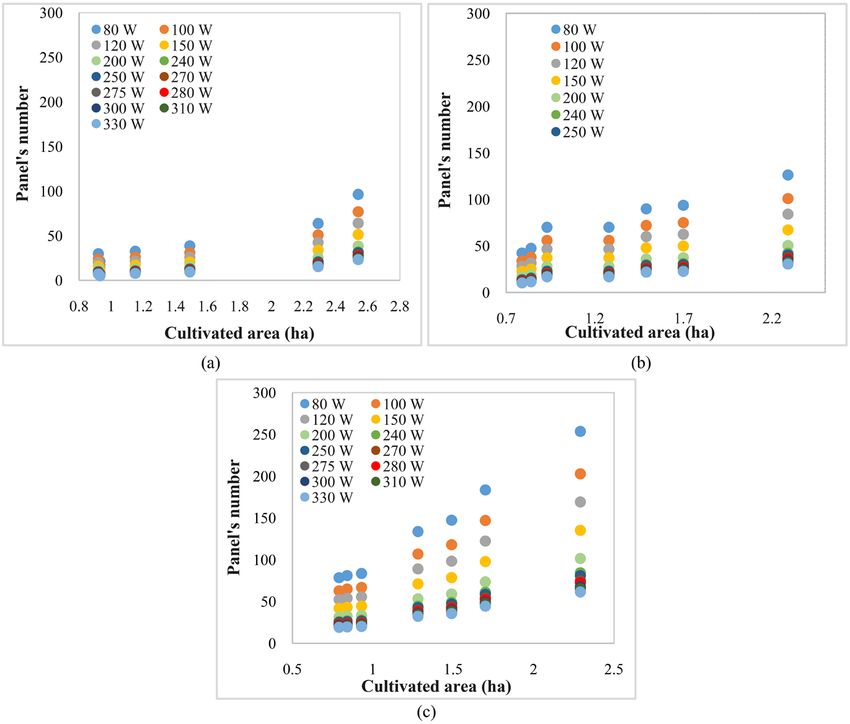
A. Sarr et al.
Technical feasibility of solar irrigation pumps (variants to take into account for solar irrigation
pumping system sizing)
1 2 3
• Irrigation • Irrigation • Water
management techniques distribution
Manual irrigation technique
One solar pump for groups of for each irrigation
farmers management type
Maximum three plots in
Use of pump without
groups reservoir for each irrigation
technique
Maximum 3ha in groups
Drip irrigation technique for
each irrigation management
type
Use of pump with reservoir
Reservoir to refill basins for
manual
One solar irrigation pump for
Sprinkler irrigation technique
aech farmer Reservoir to refill basin for
for each irrigation manuals mixed with drip and
management type sprinkler
Figure 3. Variants used for solar irrigation pumping system design.
After the determination of net irrigation requirement, gross irrigation re-
quirement is determined based on the three different techniques (formula 4).
NIR
GIR = (4)
Ea
where: GIR is gross irrigation requirement (mm), NIR is net irrigation require-
ment (mm), and Ea is the irrigation efficiency (0.90 for drip, 0.75 for sprinkler,
and 0.85 for manual [10].
3) Solar irrigation pumping system characteristics determination
Solar irrigation pump characteristics are: pump flow rate, pump pressure
head, and pump power.
Flow rate
o Flow rate for manual irrigation system
For the manual irrigation system, the pump flow rate is calculated using the
formula 5, given by [11]:
GIR
Q= (5)
Ho
where Q is the flow rate (m3/h). GIR is the daily irrigation water requirement
(m3), and Ho is number of hours of operating time (h).
o Flow rate for drip and sprinkler irrigation pump
Flow rate is calculated using the formula 6 [12]:
Lli Lri
Qsys =Qe ∗ ∗ (6)
Esi Lsi
where Qe is the emitters flow rate (L/h), Lli is the lateral length (m), Esi is the
space between emitter or sprinkler (m), Lri is mainline length (m), and Lsi is the
space between laterals (m).
Pressure head
Pressure head is calculated using the formula 7 [13]:
DOI: 10.4236/eng.2021.137029 404 EngineeringA. Sarr et al.
Hp
= H d + ∆Z + hf1 + hf 2 + H em (7)
where Hp is the pressure head, Hd is the dynamic high (static height + draw-
down) ΔZ is the difference in elevation between the water source and the most
unfavorable supply inlet, hf1 is the head loss from the pump to the most unfa-
vorable supply inlet, hf2 is head loss from the inlet to the most unfavorable emit-
ter, Hem is pressure needed at the emitter, hf2 and Hem are used for drip and
sprinkler irrigation techniques.
Drawdown of 10 m is assumed to ensure the availability of well water. Indeed,
according to [14] [15], the drawdown in the Niayes area rarely exceeds 10 m.
In addition, specific formulas are used to calculate some parameters related to
the pressure head for the different irrigation techniques. Thus, head loss for
manual irrigation technique is calculated using the formula 8:
J ∗L
hf = (8)
100
where L is pipe length (m) and J represents the head losses (%). It is determined
on the basis of water flow, diameter and nature of the pipe. J is determined using
the flow rate and diameter curve (%).
Concerning drip and sprinkler irrigation techniques, head losses are calcu-
lated using Darcy-Weisbach’s formula (formula 9) [16].
8 f LQ 2
hf
= ∗ (9)
π2 g D 2
0.316
f = (10)
Re1/ 4
where hf is the head loss (m), f is the Darcy-Weisbach resistance coefficient, L:
the pipe length (m), D is the inside diameter of the pipe (m), Re is Reynolds
number (m), Q is the flow in the pipe (m3/s), and g: the gravitational accelera-
tion, 9.81 m/s2.
Reynolds number is calculated using the formula 11, given by [16]:
Q
Re= 1.273 ∗106 ∗ (11)
D
where Re is Reynolds number, Q is the Flow rate (L/s), and D is pipe inside di-
ameter.
In addition, the pressure in plot will be calculated by section using the formula
12 [16]:
J ∗L∗F
∆H
= + ∆Z (12)
100
where L is the pipe length (m). J is the head losses (%), is the F: adjustment fac-
tor.
Also, head loss less than or equal to 20% compared to the head loss at the pre-
vious level is accepted at plot scale (formula 13).
∆H =
20% (13)
DOI: 10.4236/eng.2021.137029 405 EngineeringA. Sarr et al.
This equation is used to select the appropriate pipe diameter in the network
when using drip and sprinkler irrigation techniques.
Pump power
The hydraulic power is calculated using the formula 14, given by [17] [18]
[19]:
ρ gQHp
Eh = (14)
3600
where Eh is the hydraulic power (Wh·day−1), Hp is the pressure head (m). Q is
the flow rate (m3/day), ρ is water density (1000 kg/m3), and g is the acceleration
of gravity (9.81 m/s2).
Pump power is calculated using the formula 15 [20]:
Eh
Ppum = (15)
η pum
where Eh is the hydraulic energy (Wh/day−1) and ηpum is overall pumping plant
efficiency which will be equal to 70% based on [21].
4) Generator power determination
The photovoltaic generator power, i.e. the power of the solar field is calculated
using formula 16 [18].
2.73 ∗ Q ∗ Hp
Pgen = (16)
Psh ∗ npum ∗ є
where Pgen is the generator power (Wh/day), Hp is the Pressure head (m), Q is
the Flow rate (m3/day), ηpum is overall pumping plant efficiency which will be
equal to 70%, Psh is the number of peak sunshine hours per day (kW/m2/day),
and є: electrical efficiency of the system, 2.73 is calculated using ρa is water den-
sity (1000 kg/m3), and g is the acceleration of gravity (9.81 m/s2):
2.73 = g 3600 (17)
The electrical efficiency of the system (є) is determined based on losses in
electric cables (3%), in controller (10%), and losses due to temperature (10%)
and dust (2%) on the basis of [18] [19].
The number of panels required is calculated using the formula 18:
Pgen
Np = (18)
Ppanel
where N is the panels’ number, Pgen is the power of the generator (kW), and
Ppanel is the power of available panel on the market (kW).
2.3. Economic Feasibility of Solar Pump Irrigation in Nguethiouro
Lowland
Thus, variations in the investment cost have been determined based on the dif-
ferent criteria used when choosing pumps. The Net Present Value (NPV), the
Benefit-Cost Ratio (BCR), the Internal Rate of Return (IRR) and the Payback
Period (PBP) are calculated based on [22] [23] [24].
DOI: 10.4236/eng.2021.137029 406 EngineeringA. Sarr et al.
2.3.1. The Net Present Value (NPV)
NPV estimates the total amount of wealth created by the project. It is expressed
as:
NPV
= Bo − Co (19)
where:
• Bo (€): The discounted present value of benefits, calculated as:
1
Bo =ΣBi ∗ (20)
(1 + r )
n
• Co (€): The discounted present value of costs, calculated as:
1
Co =ΣCi ∗ (21)
(1 + r )
n
where: I is the index of year, NPV is the net present value (€), Bi is the benefit
flow of the i year, Ci is the cost flow of the i year, r is the interest rate, and n is
the time frame of the project.
2.3.2. The Benefit-Cost Ratio (BCR)
BCR is the ratio between the discounted benefit and cost, and expressed as:
Bo
BCR = (22)
Co
The investment is cost-effective when BCR ≥ 1.
2.3.3. The Internal Rate of Return (IRR)
IRR is the average annual rate generated by the project and is the discount rate
which makes NPV = 0. It is calculated as: r = IRR when NPV = 0. IRR is ex-
pressed in percentage (%).
2.3.4. The Payback Period (PBP)
PBP evaluates the time, it’ll take to recover the initial investment made in the
project. PBP is expressed in year.
3. Results and Discussion
3.1. Solar Irrigation Pump and Generator Characteristics for Drip,
Sprinkler and Manual Irrigation for Farmers Individually
The pumps’ flow rates, pressure heads and power and the generator power are
presented in Figure 4.
The flow rate is not much variable considering the three irrigation techniques. It
is ranging from 2.5 m3/h to 25 m3/h; 2.7 m3/h to 30.8 m3/h and 2.5 m3/h to 24
m3/h, when using manual, drip and sprinkler irrigation techniques, respectively.
Flows rates obtained are relatively low, 86.6% of pumps have a flow rate that is
lower than or equal to 15 m3/h when using manual irrigation. This is explained by
the fact that cultivated plots in this area are relatively small, ranging from 0.05 ha
to 1.91 ha. Thus, these pumps are sufficient to meet the daily irrigation water re-
quirements after 1.5 to 5.9 hours, 1.4 to 4.8 hours and 1.7 to 6.9 hours of operation
DOI: 10.4236/eng.2021.137029 407 EngineeringA. Sarr et al.
Figure 4. Pumps and generator characteristics for the three irrigation techniques (in blue:
manual technique; green = drip irrigation and orange = sprinkler technique).
for manual, drip and sprinkler irrigation respectively. However, the pumps’
pressure head and power and the generator power were higher when using drip
and sprinkler irrigation techniques. The pressure head is evaluated between 14.8
m to 25.4 m for manual irrigation, 27.8 m and 39.9 m for drip irrigation and 14.8
and 58.5 m for sprinkler irrigation technique. Thus, many factors are affecting
pump pressure head in this area. These factors are the differences in elevation
observed and the variation in groundwater table. Niayes area is an environment
characterized by its dunes and its depressions or slopes [25]. In addition,
groundwater level varies between 3.2 and 8.9 m. The pump power ranges from
0.045 kW to 1.6 kW for manual irrigation, from 0.05 kW to 2.5 kW for drip ir-
rigation and from 0.1 kW to 4.75 kW sprinkler irrigation technique. This in-
crease in pump power is mainly due to the increase in pressure required for drip
and sprinkler irrigation system operation. The photovoltaic generators for these
pumps are also relatively small and vary between 0.06 and 3.7 kW when using
manual irrigation. It ranges from 0.11 to 5.7 kW for drip irrigation. Also, the
highest value is evaluated à more than 10 kW when using sprinkler irrigation.
The flow rates, pressure head, and power are smaller when using manual irri-
gation technique with reservoir. It has varied between 2.5 and 21 m3/h when re-
servoirs are used. Thus, smaller pumps can be used by increasing pump operat-
ing time, which is a good way to increase pump’s efficiency which can be benefi-
cial to farmers. Use of reservoirs is more beneficial for farmers because, they
make it possible to obtain water during periods of low irradiance. However, flow
DOI: 10.4236/eng.2021.137029 408 EngineeringA. Sarr et al.
rate, pressure head, and power are higher when using reservoir when using drip
and sprinkler irrigation technique. The increase in pressure is due to the fact that
reservoirs are installed at the highest point in plots in order to provide water to
basins by gravity.
3.2. Number of Panels Making up the Generator for Different
Panel Powers for Farmers Individually
Figure 5 shows the number of panels connected together in the photovoltaic
generator for the various solar pumping systems depending on cultivated areas
and for panels of different power.
In the case of manual irrigation, the number of panels varied between 1 (0.05
ha) and 46 (1.91 ha) when using panel with power of 80 W and from 1 (0.09 ha)
to 11 (1.91 ha) when using panel with power of 330 W depending on panel pow-
er. One panel of 80 W, 100 W, or 120 W is sufficient to operate the pump when
the cultivated area is equal to 0.05 ha. Concerning drip irrigation, the number of
panels varied between 1 (0.05 ha) and 71 (1.91 ha) for 80 W panel’s power and
from 1 (0.09 ha) to 17 (1.91 ha) for 330 W panel’s power. In the same way, 1
panel of 120 W or 150 W is enough to operate the pump when the surface area is
0.05 ha. For sprinkler irrigation, the number of panels varied between 3 (0.05 ha)
and 135 (1.91 ha) for 80 W panel’s power and from 1 (0.05 ha) to 33 (1.91 ha)
for panel with 330 W.
Figure 5. Panels’ number function of area, irrigation techniques and power. (a): Panels’
number for manual irrigation. (b): Panels’ number for drip irrigation. (c): Panels’ number
for sprinkler irrigation.
DOI: 10.4236/eng.2021.137029 409 EngineeringA. Sarr et al.
3.3. Solar Irrigation Pump and Generator Characteristics for Drip,
Sprinkler and Manual Irrigation for Farmers in Groups
The irrigated area when farmers are using pumps in group has varied between
0.92 ha and 2.54 ha. The flow rate of the pumps varies between 16 m3/h and 32
m3/h. the pressure varies between 22 m and 35.7 m. the pump power varies be-
tween 0.8 kW and 2.3 kW, and the power of the photovoltaic generator varies
between 1.7 kW and 7.7 kW. Irrigation water requirements are met after an op-
erating time of 4 to 6 hours when using manual irrigation. For drip irrigation,
results show that pump flow rate varies between 18 m3/h and 41.3 m3/h, pressure
head ranges from 53.1 to 75.5 m3/h, pump power varies between 1.5 kW and 4.5
kW, and photovoltaic generator power varies between 3.4 and 1 kW. Concerning
sprinkler irrigation, results show that pump flow rate varies between 15.3 and
30.5 m3/h. The pressure head varies between 74.5 and 92.1 m. pumps power is
between 2.6 and 8.9 kW and photovoltaic generator power varies between 6.5
kW and 20.3 kW for cultivated areas that vary between 0.79 and 2.29 ha.
The same variation observed when farmers are using pump with reservoir in-
dividually is observed when farmer are using pumps with reservoir in groups.
3.4. Number of Panels Making up the Generator for Different
Panel Powers for Farmers in Groups
Figure 6 shows the number of panels connected together in the photovoltaic
generator for the various solar pumping systems depend on cultivated areas and
panel powers.
Figure 6 shows that the number of panels is very high when the plots are
grouped together. Results show that the number of panels varied between 21
(0.93 ha) and 64 (2.29 ha) when using panel with power of 80 W and from 5
(0.93 ha) to 15 (2.29 ha) when using panel with power of 330W, depending on
panel power, when using manual irrigation. In the case of drip irrigation, the
number of panels varied between 43 (0.79 ha) and 126 (2.29 ha) for 80 W panel’s
power and between 10 (0.79 ha) to 31 (2.29 ha) for 330 W panel’s power. Con-
cerning sprinkler irrigation, the number of panels varied between 79 (0.79 ha)
and 254 (2.29 ha) for panels with power equal to 80 W and between 19 (0.05 ha)
and 62 (2.29 ha) for 330 panel’s power. Moreover, these multiple panels can
cover a large area in the plots. This can lead to a reduction in cultivated areas.
Thus, the use of larger panels’ power may be beneficial in these cases.
3.5. Investment Cost Evaluation
The investment cost varies depending on the brand of pump selected. Result of the
investment when using manual irrigation show that Lorentz pumps are more ex-
pensive (cost varies from 2315 euros (1,518,500 CFA) for 0.05 ha to 4090 euros
(2,683,000 CFA) for 0.53 ha), followed by Difful pumps (varying from 1808 euros
(1,186,000 CFA) for 0.38 ha to 4798 euros (3,147,500 CFA) for 1.41 ha). In con-
trast, solar pump, JUQIANG, and SHIMGE pump brands are cheaper (investment
cost varies between 669 euros (438,500 CFA) and 1265 euros (825,000 CFA)).
DOI: 10.4236/eng.2021.137029 410 EngineeringA. Sarr et al.
Figure 6. Panel’s number for plots’ group function of irrigation technique and power. (a):
Panels number for manual irrigation. (b): Panels number for drip irrigation. (c): Panels
number for sprinkler irrigation.
However, the investment cost for solar pumping system implementation is
higher when using drip irrigation technique compared to manual irrigation
technique. This increase in cost is more pronounced when using 900 µ drip lines.
The investment cost varies between 1281 euros and 18,999 euros when using 600
µ drip lines and between 1303 euros and 20,600 euros when using 900 µ drip
lines. Indeed, the high investment cost is explained by the high cost of drip irri-
gation system. In fact, the irrigation system accounts for two-thirds (2/3) and
half (1/2) of the pumping system when using the 900 µ and 600 µ dripper lines,
respectively.
Concerning sprinkler irrigation, the result show that the investment cost
ranges from 819€ to 14,723€ when using PVC pipes, while it ranges from 990€ to
21,403€ when using aluminum pipes. For this purpose, the implementation of a
solar pumping system when using the sprinkler irrigation technique with PVC
pipes is cheaper compared to the use of the drip irrigation technique. This is be-
cause the investment cost of setting up the sprinkler irrigation system with PVC
pipes is cheaper. It represents one third (1/3) of the total investment cost. In
contrast, the implementation cost of sprinkler irrigation with aluminum pipes
represents half (1/2) of the total investment cost.
These investment costs are higher when using a reservoir because of the addi-
tional cost of these reservoirs and because of the increase of the pump size when
using drip and sprinkler irrigation techniques.
DOI: 10.4236/eng.2021.137029 411 EngineeringA. Sarr et al.
In addition, the investment cost is lower when farmers are using pumps in
groups in the case of using manual and drip irrigation technique (Table 2).
3.6. Part (%) of Solar Irrigation Pumping System Components in
the Investment Cost
Results in Figure 7 show that the pump and the PV generator are the most ex-
pensive components when considering the pumping system without the irriga-
tion system cost. Thus, the generator can account for up to 54%, 61%, and 65%
Table 2. Investment cos at the whole lowland for farmers individually and in groups.
Investment cost Investment cost
without using reservoir when using reservoir
The cases studied
Maximum Minimum Maximum Minimum
investment (€) investment (€) investment (€) investment (€)
Manual irrigation
For farmer individually 44,103 28,681 48,717 28,715
For a group of farmer 27,845 26,236 31,450 28,538
Drip irrigation
For farmer individually 49,828 39,644 68,581 61,522
For a group of farmer 44,652 33,927 67,032
Sprinkler irrigation
For farmer individually 62,153 39,911 86,371 75,165
For a group of farmer 68,068 62,222 83,702 83,702
DOI: 10.4236/eng.2021.137029 412 EngineeringA. Sarr et al.
Figure 7. The proportion of irrigation system components in the investment cost of solar
pumping system without using reservoir. (a): Proportion for manual for pumping system.
(b): Proportion for manual with irrigation system. (c): Proportion for drip for pumping
system. (d): Proportion for drip (900 µ).(e): Proportion for drip (600 µ). (f): Proportion
for sprinkler for pumping system. (g): Proportion for sprinkler (PVC). (h): Proportion for
sprinkler (Aluminum).
of the investment cost when using manual, drip and sprinkler irrigation tech-
niques respectively and the pump can account for up to 43% in manual and drip
irrigation and up to 60% in sprinkler irrigation. In fact, pump and photovoltaic
generator costs remain higher when using manual irrigation systems, and the ir-
rigation system, in this case, represents at most 29% of the investment cost.
However, the irrigation system cost represents the largest proportion when using
drip (77% and 74% of the investment cost when using 900 µ and 600 µ drip lines
respectively) and sprinkler (50% and 68% of the investment cost when using
PVC and aluminum pipes respectively). These percentages decrease slightly
when using reservoir. In fact, the cost of the reservoirs represents the smallest
proportion and constitutes 3% to 6% of the investment cost.
3.7. Benefit-Cost Analyze
The benefit-cost analysis is conducted based on the NPV, BCR, IRR and PBP
(Figure 8).
NPV is higher when using sprinkler irrigation system with PVC pipes and
when using drip irrigation technique with the exception of plot 1 (1.91 ha). NPV
DOI: 10.4236/eng.2021.137029 413 EngineeringA. Sarr et al.
Figure 8. NPV, BCR, IRR and PBP for manual, drip and sprinkler irrigation techniques.
varies between 15,993€ (0.75 ha) and 103,139€ (1.41 ha) when using the sprink-
ler irrigation technique with PVC pipes and between 13,064€ and 86,139€ when
using the drip irrigation technique. Additionally, the results obtained on plots 2
(0.38 ha) and 6 (0.29 ha) when using Lorentz pump brand for manual irrigation
techniques showed very low NPV due to the high cost of Lorentz brand.
The use of the manual irrigation system gives the highest BCR value followed
by the use of sprinkler irrigation with PVC pipes and drip irrigation. This is due
to the lower investment cost when implementing manual and sprinkler irriga-
tion system with PVC pipes. On the other hand, the very low BCR values espe-
cially when using modern irrigation techniques on plot 1 (1.91 ha) is related to
the low income because of these low yields.
The use of solar irrigation pumps is very cost-effective and risk-free for the
different irrigation techniques used with the exception of plots 1 (1.91 ha) for
sprinkler irrigation technique, plots 9 and 14 when using sprinkler with alumi-
num pipe and Lorentz brand, and in plot 6 (0.29 ha) when using manual irriga-
tion technique and Lorentz brand (15).
The results show that PBP is shorter when using manual and sprinkler irriga-
tion techniques with PVC pipes. This is explained by the lower investment cost
compared to the others. According to the results, the project starts to be profita-
ble in the first or second year when using brands such as LIKOU and Asaman,
which are very affordable. On the other hand, the return on investment is slow-
DOI: 10.4236/eng.2021.137029 414 EngineeringA. Sarr et al.
er, up to 10 years when using Lorentz brand pumps and more frequently when
using sprinkler irrigation technique with aluminum pipes.
4. Conclusion
The study aims to evaluate the technical and economic feasibility of solar irriga-
tion pump in the Nguethiouro lowland. Pumps were designed on the basis of ir-
rigation management, irrigation techniques and water distribution. Concerning
the economic feasibility, it is studied based on an investment cost estimation and
a benefit-cost analysis approach. Results show that pumps’ flow rate does not
much varied considering the different irrigation techniques. However, the
pumps’ pressure and power and the generator are higher when using drip and
sprinkler irrigation techniques. In addition, the flow rate, the pressure, and the
pump power are lower when using manual irrigation technique combined with a
reservoir whereas they are higher when using modern irrigation techniques
combined with a reservoir. In addition, results show that pumps’ characteristics
are higher when farmers are organized in groups. With regard to the economic
feasibility, results show that the investment cost ranges from 669€ to 4090€ when
using the manual irrigation, from 1281€ to 20,600€ when using the drip irriga-
tion technique and from 819€ to 21,403€ when using sprinkler irrigation tech-
nique for individual pumps. Also, the investment cost is higher when farmers
are organized in groups considering the whole lowland. Results show that the
use of solar irrigation pumps with the sprinkler irrigation technique with PVC
pipes and with the drip irrigation technique is more profitable for the farmers
based on the NPV, BCR, IRR, and PBP. However, optimization in the amounts
of water extracted and used during the implementation of solar irrigation pumps
would be interesting in order to avoid groundwater overexploitation by farmers.
Acknowledgements
Sincere thanks to the WAGRINNOVA project (the co-innovation across scales
to enhance sustainable intensification, resilience & food, and nutritional security
in water-managed agricultural systems in West Africa project) with all its part-
ners including the UGB, CIHEAM BARI, CSIC, IRD, and CIRAD.
Conflicts of Interest
The authors declare no conflicts of interest regarding the publication of this pa-
per.
References
[1] Wazed, S.M., Hughes, B.R., O’Connor, D. and Calautit, J.K. (2018) A Review of
Sustainable Solar Irrigation Systems for Sub-Saharan Africa. Renewable and Sus-
tainable Energy Reviews, 81, 1206-1225. https://doi.org/10.1016/j.rser.2017.08.039
[2] Adenugba, F., Misra, S., Maskeliūnas, R., Damaševičiu, R. and Kazanavičius, E.
(2019) Smart Irrigation System for Environmental Sustainability in Africa: An In-
DOI: 10.4236/eng.2021.137029 415 EngineeringA. Sarr et al.
ternet of Everything (IoE) Approach. Mathematical Biosciences and Engineering,
16, 5490-5503. https://doi.org/10.3934/mbe.2019273
[3] Shinde, V.B. and Wandre, S.S. (2015) Solar Photovoltaic Water Pumping System for
Irrigation: A Review. African Journal of Agricultural Research, 10, 2267-2273.
[4] Siebert, S., Burke, J., Faures, J.M., Frenken, K., Hoogeveen, J., Döll, P. and Port-
mann, F.T. (2010) Groundwater Use for Irrigation—A Global Inventory. Hydrology
and Earth System Sciences, 14, 1863-1880.
https://doi.org/10.5194/hess-14-1863-2010
[5] Chandel, S.S., Naik, M.N. and Chandel, R. (2015) Review of Solar Photovoltaic Wa-
ter Pumping System Technology for Irrigation and Community Drinking Water
Supplies. Renewable and Sustainable Energy Reviews, 49, 1084-1099.
https://doi.org/10.1016/j.rser.2015.04.083
[6] Agrawa, S. and Jain, A. (2015) Sustainable Deployment of Solar Irrigation Pumps:
Key Determinants and Strategies. WIREs Energy and Environment, 8, e325.
https://doi.org/10.1002/wene.325
[7] Touré, O. and Seck, M.S. (2005) Exploitations familiales et entreprises agricoles
dans la zone des Niayes au Sénégal.
[8] Raes, D. (2017) AquaCrop Training Handbooks Book I. Understanding AquaCrop.
[9] Allen, R.G., Pereira, L.S., Raes, D. and Smith, M. (1998) Crop Evapotranspiration,
Guidelines for Computing Crop Water Requirements-Guidelines for Computing
Crop Water Requirements. FAO Irrigation and Drainage Paper 56, FAO, Rome.
[10] Waller, P. and Yitayew, M. (2016) Irrigation and Drainage Engineering. Springer,
Berlin. https://doi.org/10.1007/978-3-319-05699-9
[11] Nwobi, E.U., Ajide, O.O. and Abu, R. (2014) Design and Cost Analysis of a 0.75 kw
Solar Powered Water Pumping System. International Journal of Scientific & Engi-
neering Research, 5, 1544-1557.
[12] NETAFIM (2015) Drip Irrigation Handbook: Understanding the Basics.
[13] GIZ and FAO (2018) Powering Agriculture: An Energy Grand Challenge for De-
velopment. Toolbox on Solar Powered Irrigation System (SPIS).
[14] Niang, S. (2017) Dégradation chimique et mécanique des terres agricoles du Gan-
diolais (littoral Nord du Sénégal), analyse des dynamiques actuelles d’adaptation.
[15] Seck, M.S., Mateos, L., Gomez, M.H., Bodian, A., Mbaye, M., Sy, K. and Ly, B.
(2017) Étude de la durabilité des systèmes de production et de la gestion de l’eau
dans le Gandiolais (zone nord des Niayes) dans un contexte de changement clima-
tique et d’insécurité alimentaire [Rapport final provisoire].
[16] Martin, D.L., Heermann, D.F. and Madison, M. (2007) Hydraulics of Sprinkler and
Microirrigation Systems. In: Hoffman, G.J., Evans, R.G., Jensen, M.E., Martin, D.L.
and Elliott, R.L., Eds., Design and Operation of Farm Irrigation Systems, 2nd Edi-
tion, American Society of Agricultural and Biological Engineers, St. Joseph, 532-556.
https://doi.org/10.13031/2013.23698
[17] Arab, H.A., Gharbi, A. and Benghanem, M. (2005) Dimensionnement de systèmes
de pompage photovoltaïque. Revue des énergies renouvelables, 8, 19-26.
[18] Van de Giessen, E., Roek, E., Bom, G., Abric, S. and Vuit, R. (2016) Solar Pumping:
For Village Water Supply Systems. PRACTICA Foundation, Papendrecht.
[19] Van de Giessen, E., Roek, E., Bom, G., Abic, S. and Vuik, R. (2018) Appliqué aux
adductions d’Eau potable en milieu rural. Manuel de formation pour les cadres
techniques du secteur public et privé. PRACTICA Foundation, Papendrecht.
[20] Elrefai, M., Hamdy, R.A., ElZawawi, A. and Hamad, M.S. (2016) Design and Per-
DOI: 10.4236/eng.2021.137029 416 EngineeringA. Sarr et al.
formance Evaluation of a Solar Water Pumping System: A Case Study. 2016 Eigh-
teenth International Middle East Power Systems Conference (MEPCON), Cairo,
27-29 December 2016, 914-920. https://doi.org/10.1109/MEPCON.2016.7837005
[21] Duke, H.R. (2007) Chapter 12. Pumping Systems. In: Hoffman, G.J., Evans, R.G.,
Jensen, M.E., Martin, D.L. and Elliott, R.L., Eds., Design and Operation of Farm Ir-
rigation Systems, 2nd Edition, American Society of Agricultural and Biological En-
gineers, St. Joseph, 392-435. https://doi.org/10.13031/2013.23695
[22] Shively, G. (2012) An Overview of Benefit-Cost Analysis.
[23] Bakhsh, A., Chauhdary, J.N., Ali, A., Rizwan, M. and Hussain, M. (2016) Tube Well
Run on Solar Energy and Its Use in Agriculture. Second World Irrigation Forum,
Chiang Mai, 6-8 November 2016, 1-6.
[24] SAGE Publications (2018) Benefit-Cost Analysis.
[25] HORTICA (2004) Renforcement des capacités de micro-irrigation pour l’intensification
de l’horticulture: Zone des Niayes.
DOI: 10.4236/eng.2021.137029 417 EngineeringA. Sarr et al.
Nomenclature
BCR Benefit Cost Ratio
Bi Benefit flow of the i year
Ci Cost flow of the i year
D Inside diameter of the pipe
Є Electrical efficiency
Eh Hydraulic energy
ea Actual vapor pressure
es Saturated vapor pressure at air temperature
Esi Space between emitter or sprinkler
Etc Crop evapotranspiration
Eto Reference evapotranspiration
f Darcy-Weisbach resistance coefficient
FC Field Capa city
G Soil heat flux density
g Gavitational acceleration
GIR Gross Irrigation Requirement
Hd Dynamic high
Hp Pressure head
Hem Pressure needed at the emitter
hf Head loss
hf1 Head loss from the pump to the most unfavorable supply inlet
hf2 Head loss from the inlet to the most unfavorable emitter
Ho Number of hours of operating time
IRR Internal Rate of Return
J head losses in percentage
Kc Crop coefficient
L Pipe length
ρ Water density
Lli Lateral length
Lri Mainline length
Lsi Space between lateral
n Time frame of the project
NIR Net irrigation requirement
ηpum Overall pumping plant efficiency
NPV Net Present Value
PBP Payback Period
Peff Effective rainfall
DOI: 10.4236/eng.2021.137029 418 EngineeringA. Sarr et al.
Continued
Pgen Generator power
Ppanel Power of available panel on the market
Psh Number of peak sunshine hours per day
PWP Permanent Weitling Point
Q Flow rate
Qe Emitters flow rate
r Interest rate
Re Reynolds number
Rn Net radiation
SAT Saturation
T Mean daily air temperature
TAW Total Available Water
u2 Wind speed measured at 2 m height
γ Psychometric constant
Δ Slope of the saturated vapor pressure curve
ΔZ Difference in elevation between the water source and the most unfavorable supply inlet
DOI: 10.4236/eng.2021.137029 419 EngineeringYou can also read