Te Waihanga: Infrastructure Quarterly

 
CONTINUE READING
Te Waihanga: Infrastructure Quarterly
Te Waihanga:
                            Infrastructure Quarterly
                            A quarterly snapshot of issues and trends for New Zealand’s
                            infrastructure sector by the New Zealand Infrastructure
                            Commission, Te Waihanga.

                                                                                 Geoff Gooper
                                                                                 GM Strategy, Te Waihanga
Quarter One: January 2022

                                                                                 Foreword –
                                                                                 Geoff Cooper

                            Welcome to our first Infrastructure Quarterly        The National Pipeline has risen to some $65.8
                            for 2022.                                            billion, with the Christchurch City Council
                                                                                 infrastructure program recently added, with 247
                            The new year was met with a significant
                                                                                 projects and $2.2 billion of capital expenditure.
                            announcement of the Government’s preferred
                                                                                 On the back of this we speak to Ruth Cable,
                            option for a new mass transit service from the
                                                                                 Head of the Programme Management Office
                            Auckland city centre to Māngere. This project will
                                                                                 about the impact of Covid and how they are
                            be New Zealand’s largest ever and a significant
                                                                                 managing rising costs. We also speak with John
                            opportunity to shape the future of Auckland.
                                                                                 O’Hagan, General Manager of Development at
                            The announcement comes in a challenging              Ōtākaro Limited, about the new Christchurch
                            economic environment however, where Omicron          Convention centre which officially opened just
                            has led to significant and widespread challenges,    before Christmas.
                            from sourcing an international workforce, through
                                                                                 As always, if you have any feedback on our work
                            to global supply chain issues for materials.
                                                                                 or publications, don't hesitate to reach out.
                            The result is significant price inflation in the
                            construction sector tracking well above national
                            averages, as Peter Nunns describes in the
                            economic insights section.
Te Waihanga: Infrastructure Quarterly
2   Te Waihanga: Infrastructure Quarterly | Quarter One: January 2022

    What’s in the Pipeline                                                    Pipeline snapshot
    The New Zealand Infrastructure                                            Recent changes
    Commission Pipeline pulls together
    key information on the infrastructure                                     Our Pipeline is updated quarterly. Key changes
    projects planned for New Zealand                                          since the last update include:
    and sources project data direct from                                      • An additional 22 organisations have updated
    government, councils, utilities and                                         project information
    others. The Pipeline has grown from                                       • 65 completed projects were removed from the
    approximately 176 projects and total                                        Pipeline, totalling $1.5 billion
    value of $6.1 billion in 2019 to more                                     • Additional projects from Auckland airport have
    than 2700 projects and $65.6 billion                                        been added
    at the end of 2021.
                                                                              • The Christchurch City Council infrastructure
    The Pipeline includes projects that have a level of                         program has been added, including 247 new
    certainty around timing. For projects with a longer                         projects valued at $2.2 billion. This includes:
    horizon such as Let’s Get Wellington Moving
                                                                                   › $800 million water
    and Auckland Light Rail, the ANZIP Pipeline and
    others can be a useful source of information.                                  › $400 million transport
    We are continuing to build on and improve the                                  › $1 billion community facilities
    data in the Pipeline and it remains a one-stop                                   (including the new stadium)
    summary of what’s coming up for industry.  
    You can search the Pipeline on our website.

            2,700                                           40                      $65.6b                             196
               Projects                                                             Total Projects                Shovel ready
                                                      Contributing
                                                     Organisations*                                            projects underway*

     $9.7b                           $30.7b                             $4.4b                        $10.6b               $27.9b
    Procurement                        Planning                          Health                       Water                  Transport

           $ 25.4b                                      $ 2.1b                     $ 5.8b                         $4.2b
              Under                                      Justice                     Housing                      Education
            Construction
Te Waihanga: Infrastructure Quarterly
3                    Te Waihanga: Infrastructure Quarterly | Quarter One: January 2022

                                                                                            This year, spend on these projects is forecast to
                     Shovel ready projects                                                  reach $11.3 billion, up from $10.7 billion in the last
                     The number and value of shovel ready projects                          quarter. The increase is driven by the addition of
                     is now beginning to decrease as projects reach                         projects to the Pipeline, such as those added by
                     completion and are removed from the Pipeline.                          Christchurch City Council, which helps to improve
                     Since the last quarter, 30 projects have                               our national view of infrastructure investment.
                     reached completion.                                                    The modelling shows that transport projects
                                                                                            continue to dominate the total spending on
                     Forecast project spend                                                 pipeline projects, accounting for just over 30%
                     by sector                                                              of forecast spend in 2022 (see Figure 1). Annual
                                                                                            spend on water projects is forecast to continue
                     The forecast annual spend by sector for the                            increasing, up 50% from nearly $1.1 billion in
                     projects in our Pipeline has been modelled.                            2022 to over $1.6 billion by 2024.

                     Figure 1: Transport dominates projected infrastructure spending
                     Forecast project spend by sector

                12

                10

                8
    $ billion

                6

                4

                2

                0

                 2021                           2022                          2023                    2024                     2025            2026

                         Business                             Education                  Housing                   Transport
                         Communications                       Energy                     Justice                   Waste Management
                         Community Facilities                 Environmental              Other - Not Specified     Water
                         Defence                              Health                     Science and Research

                     Source: Te Waihanga Infrastructure Pipeline
4   Te Waihanga: Infrastructure Quarterly | Quarter One: January 2022

                                                                                    • Selection of materials that avoid fluctuations,
    Regional Spotlight –                                                              including local material selection
    Canterbury                                                                      • Early purchase of materials, procuring steel
                                                                                      early and passing it to the main contractor
    Christchurch City Council has added
                                                                                    • Early visibility of the Council forward works
    their capital programme to the
                                                                                      provided to the contractor market
    Pipeline consisting of 247 projects
                                                                                    • Encouraging contractors to fully consider their
    We asked Ruth Cable the Head of Programme                                         supply chain when preparing a tender response
    Management Office at Christchurch City Council                                    - identifying how they will manage the supply
    about their projects.                                                             chain as well as lead in times for supplies.

    How is Christchurch City Council managing and                                   In December 2021 Christchurch City Council
    responding to the issues of cost escalation and                                 staff proposed to cut the capital budget from
    supply chain issues?                                                            $475.5m to $433.9m. This proposal was in
                                                                                    response to the impacts of COVID-19, supply
    Over the last year global steel prices have
                                                                                    chain issues, cost escalation, and labour
    continued to rise due to a significant escalation
                                                                                    shortages. What are the impacts of the current
    in raw material costs. In addition, transport and
                                                                                    proposal to cut back the capital budget for
    logistics costs have also been under pressure
                                                                                    2022-23?
    leading to higher container, shipping and other
    freight charges.                                                                The overall proposed budget for FY23 is similar
                                                                                    to the Long Term Plan proposed budget for
    The ongoing impact of COVID-19 outbreaks
                                                                                    FY23. There are proposed adjustments to spend
    and the resulting emergency measures on
                                                                                    by activity, in light of the current environment.
    international trade are unknown.
                                                                                    Where there are proposed changes to an activity
    Mitigations for this risk have been identified                                  budget, these have been recommended based
    and include:                                                                    on multiple inputs – affordability, deliverability,
                                                                                    the market, as well as current environmental
    • Early procurement and subcontract package
                                                                                    risks. Programmes of work have been prioritised
      tendering in order that price and quantities can
                                                                                    to ensure no material impact to current
      be locked in
                                                                                    performance targets across the 10 years.
    • Leverage of existing supply chains

    Table 1: Canterbury projects in the Pipeline

     PROJECT                                            DELIVERY AGENCY                       VALUE ($)                 PROJECT    PROJECT
                                                                                                                        START DATE END DATE

     Canterbury Multi Use Arena (CMUA)                  Christchurch City Council             500 million - 1 billion   Q2 2020    Q2 2025

     Te Pae Christchurch Convention Centre              Otakaro Ltd                           250 – 500 million         Q3 2015    Q1 2023

     Parakiore Recreation and Sport Centre (formally    Otakaro Ltd                           250 – 500 million         Q4 2013    Q1 2024
     known as Metro Sports Facility) - Christchurch

     Canterbury Provincial Chambers Works (Stage 1)     Christchurch City Council             100 – 250 million         Q4 2015    Q2 2028

     Christchurch Hospital Redevelopment, Tower 3       Ministry of Health                    100 – 250 million         Q3 2020    Q4 2023

     University of Otago - Christchurch Health          University of Otago                   100 – 250 million         Q2 2016    Q1 2023
     Science Campus Redevelopment - Stage 1

    Source: Te Waihanga Infrastructure Pipeline
    Project dates are not always equivalent to construction timeframes
5                       Te Waihanga: Infrastructure Quarterly | Quarter One: January 2022

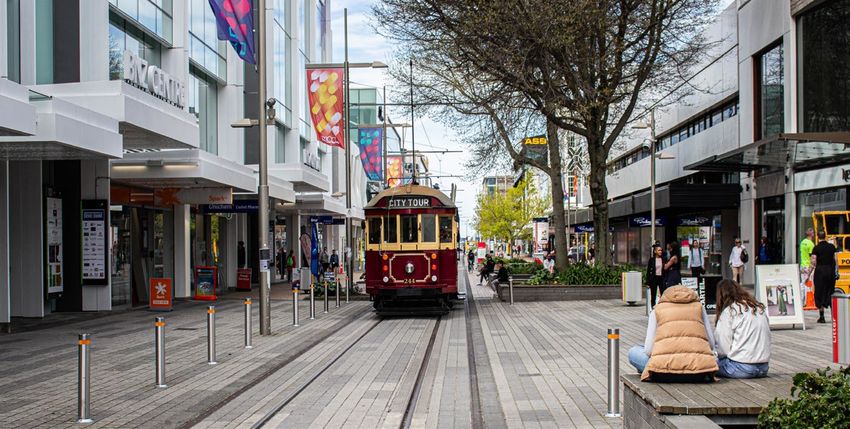
                          Christchurch, New Zealand

                        Figure 2 shows a breakdown of expected project spending by year for Canterbury (estimated on the
                        listed projects only).
                        These projections will always show a drop towards the end of the time frame. However, Christchurch
                        has a particularly steep decline in project activity. This decrease is driven by several large projects
                        finishing up and suggests some capacity in the Canterbury vertical construction market from around
                        2024/2025.

                        Figure 2: Expectations for a steep decline in project activity
                        in Canterbury
                        Forecast project spend

                1,200

                1,000

                 800
    $ million

                 600

                 400

                 200

                   0

                        2021                          2022                         2023     2024         2025                 2026

                        Source: Te Waihanga Infrastructure Pipeline
6   Te Waihanga: Infrastructure Quarterly | Quarter One: January 2022

                                                                        Have the impacts of COVID-19 with
    Project Spotlight: Te Pae                                           labour shortages affected the build of the
    Christchurch Convention                                             convention centre?

    and Exhibition Centre                                               COVID-19 has had a major impact on the
                                                                        construction of Te Pae, delaying the opening by
    John O’Hagan, General Manager of Development                        more than a year. Our workforce was very much
    at Ōtākaro Limited, the Government agency that                      international, and many workers returned home
    has developed and will own the facility, tells us                   because of COVID-19.
    about the project.                                                  In many larger cities, a major construction
                                                                        project like Te Pae would consume only a small
    Tell us about the convention centre, how
                                                                        percentage of the construction labour market but
    long has it taken to build and when will it
                                                                        in a smaller city like Christchurch, the impact is
    be completed?
                                                                        much greater.
    Te Pae took four years to build at a cost
                                                                        COVID-19 also created challenges with the
    of about $450m (including land, land
                                                                        supply of critical components, particularly from
    improvements and event equipment).
                                                                        abroad and domestic travel constraints also had
    The building has been designed to a very high                       an impact. When Auckland went into lockdown,
    level of structural integrity. There are 4,500                      30 key construction and commissioning
    tonnes of steel in the building and 25,000m3                        specialists were unable to travel south.
    of concrete went into the foundations, walls,
    and suspended slabs, which equates to well                          Will it change the way you work with your
    over 4,000 concrete truck loads. Construction                       contractors/tenders in the future?
    took 3 million person hours.                                        Going forward, we would set realistic
    There are 43,000 panels on the building                             timeframes that accounted for possible
    façade, 28,000sqm of event space and it has                         pandemic-related delays.
    the largest commercial kitchen in the South                         Also, we would be very cautious about
    Island. Te Pae will be able to serve 2,000                          international procurement. For example, the
    meals in 20 minutes.                                                stunning 43,000 façade tiles on Te Pae have
    The ultra-efficient heating and aircon system                       come from three different countries. They were
    has the equivalent output of 500 home aircon                        installed before COVID-19 hit, but if we were to
    unit and is located on the roof so delegates                        design another facility like that now, knowing
    will not hear any noise.                                            the impact of the pandemic, we would reduce
                                                                        that risk.
    The facility was officially opened just before
    Christmas. The first major conferences in                           As the rebuild wraps up and major projects
    February are in doubt because of the red                            are completed or nearing completion, do you
    traffic light setting but we have more than 100                     see signs of excess capacity in the contractor
    events booked for the first year. Te Pae is likely                  market there?
    to likely to inject about $60m a year into the                      No. The market resources are quite transient. As
    local economy.                                                      the Auckland construction market has heated up,
                                                                        many resources have moved north, creating a
                                                                        shortage in the south.
7                                  Te Waihanga: Infrastructure Quarterly | Quarter One: January 2022

                                                                                                                        Economic Insights
                                                                                                                        Peter Nunns
                                                                                                                        Director of Economics,
                                                                                                                        Te Waihanga

                                   Construction cost inflation                                                          Benchmarking construction cost inflation

                                   – how does New Zealand                                                               We sourced residential construction price indices
                                                                                                                        for New Zealand and 30 other OECD countries,
                                   measure up?                                                                          plus the European Union as a whole.1 This data
                                                                                                                        shows that New Zealand has experienced above-
                                   Construction costs are rising rapidly in New
                                                                                                                        average construction price inflation over the last
                                   Zealand. Residential and non-residential costs
                                                                                                                        year: We had the 10-highest construction price
                                   rose by more than 10% last year, and similar
                                                                                                                        inflation in the OECD during this time.
                                   increases are forecast for the upcoming year.
                                   Construction costs are rising at their fastest rate                                  However, high construction price inflation isn’t
                                   since the Global Financial Crisis.                                                   just a Covid-era phenomenon. Over the last five
                                                                                                                        years, New Zealand had the seventh-highest
                                   Construction cost inflation reflects rising demand
                                                                                                                        construction price inflation in the OECD. Our
                                   colliding with constrained supply. Infrastructure
                                                                                                                        residential construction price inflation averaged
                                   providers, property developers, and households
                                                                                                                        5.2% per annum from 2016 to 2021.
                                   are trying to build more than ever, but shortages
                                   of construction labour, material supply chain                                        The following chart shows how New Zealand’s
                                   bottlenecks, and Covid-induced slowdowns have                                        construction price inflation compares to selected
                                   gotten in the way. Other countries are also facing                                   OECD countries. Switzerland has experienced
                                   similar issues, which raises the question: How do                                    the lowest inflation – 1.3% over the last year
                                   we stack up when it comes to cost inflation?                                         – while Canada has experienced the highest
                                                                                                                        inflation – 20.3% over the last year.

                                   Figure 3: New Zealand construction price inflation is high
                                   by OECD standards
                                   Residential construction price inflation, 2016-2021, selected OECD countries

                             25%

                                                                                                                                                                          20.3%
                             20%
    Annual price inflation

                             15%
                                                                                                                                                               13.1%

                                                                                                                                               10.9%
                             10%                                                                                                   8.9%
                                                                                                                       8.5%
                                                                                                    7.8%                                                               8.0%
                                                                                7.0%
                                                                                                                                                        5.7%
                                                               4.6%                                                                        5.2%
                             5%
                                                                         3.7%                                   3.3%
                                                                                             3.1%                             3.0%
                                                        2.3%
                                             1.3%
                                      0.7%
                             0%

                                    Switzerland          Japan            United             European            OECD         Australia   New Zealand    United        Canada
                                                                         Kingdom              Union              median                                  States

                                       Average annual inflation, 2016 to 2021          Annual inflation, 2021

                                   Source: ABS, Eurostat, StatCan, SNZ, Census Bureau
8                                                    Te Waihanga: Infrastructure Quarterly | Quarter One: January 2022

                                                     Scaling up to build?                                                          Figure 3 shows the pre-Covid relationship
                                                                                                                                   between growth in residential construction
                                                     Prior to the Covid pandemic, OECD countries had
                                                                                                                                   investment and growth in residential construction
                                                     diverging housing construction trends. In some
                                                                                                                                   prices in New Zealand and twelve other OECD
                                                     countries, including New Zealand and Australia,
                                                                                                                                   countries that had fully recovered from the
                                                     rapid population growth has increased demand
                                                                                                                                   GFC.2 Between 2014 and 2019, the median
                                                     for housing, while others, like Japan, are growing
                                                                                                                                   country experienced 21% growth in residential
                                                     more slowly. In some European countries, like
                                                                                                                                   construction output and 12% growth in residential
                                                     Ireland and Greece, housing construction still
                                                                                                                                   construction prices.
                                                     hasn’t recovered from the Global Financial Crisis.
                                                                                                                                   The relationship between construction output
                                                     All else equal, we would expect faster growth
                                                                                                                                   growth and price growth varies between
                                                     in residential construction to lead to higher
                                                                                                                                   countries. For instance, Sweden and Finland both
                                                     construction price inflation. However, some
                                                                                                                                   experienced similar growth in construction output
                                                     countries may be better at scaling up to build while
                                                                                                                                   (19% vs 17%), but construction price inflation was
                                                     keeping price inflation at more moderate levels.
                                                                                                                                   three times as rapid in Sweden (15% vs 5%). This
                                                                                                                                   suggests that Finland is better at scaling up to
                                                                                                                                   meet increased construction demand.

                                                     Figure 4: New Zealand’s construction market struggled
                                                     to scale up prior to Covid
                                                     Changes in residential construction output and prices among selected
                                                     OECD countries, 2014-2019

                                               30%

                                               25%
                                                                                             New Zealand
    Change in construction prices, 2014-2019

                                               20%
                                                                                                                               Lithuania

                                               15%                                      Sweden United Kingdom
                                                                       Norway
                                                                                                                                  Czech Republic

                                                                        Germany
                                                                           Australia                                                                                          Netherlands
                                               10%                                         Luxembourg
                                                                                   Austria

                                                                                                                                                 Estonia
                                               5%
                                                                                     Finland

                                               0%
                                                     0%             10%              20%               30%               40%               50%             60%   70%    80%             90%

                                                                                             Change in residential construction output, 2014-2019
                                                     Source: ABS, Eurostat, SNZ, OECD.Stat
9   Te Waihanga: Infrastructure Quarterly | Quarter One: January 2022

    Prior to Covid, New Zealand had higher                                               While New Zealand is not an outlier, it has
    construction price inflation than other OECD                                         experienced more rapid construction price inflation
    countries with comparable housing market                                             than most OECD countries over the last year.
    trends. Residential construction output rose
                                                                                         Even before the Covid pandemic, New Zealand
    by 21%, but construction prices rose by 24%.
                                                                                         struggled to scale up to build. Relative to
    When we try to build more, we must ‘buy’ each
                                                                                         other OECD countries, we purchase increased
    1% increase in residential construction output at
                                                                                         construction output at the cost of high construction
    the cost of 1.2% inflation. On average, our peer
                                                                                         price inflation. This reflects long-term issues
    countries can ‘buy’ each 1% increase in output
                                                                                         around workforce capacity and capability, material
    at the cost of 0.6% inflation – half as much
                                                                                         supply chains, and volatility of investment.
    construction price inflation as we incur.
                                                                                         These ‘preexisting conditions’ have made our
    Covid revealed our problems – it did not                                             construction market unusually vulnerable to Covid
    cause them                                                                           – highlighting the importance of solving those
                                                                                         issues to build resilience and meet our long-term
    Construction price inflation has reached
                                                                                         infrastructure challenges.
    unprecedented levels during the Covid pandemic.

    Appendix: Residential construction cost inflation data
     Country                                              Source                     Most recent                  Annual inflation           Annual inflation
                                                                                     available data               over last 5 years          over last year
     Australia                                            ABS                        Q3-2021                      3.0%                       8.9%
     Austria                                              Eurostat                   Q3-2021                      4.3%                       14.0%
     Belgium                                              Eurostat                   Q2-2021                      2.5%                       4.9%
     Canada                                               StatCan                    Q3-2021                      8.0%                       20.3%
     Czech Republic                                       Eurostat                   Q3-2021                      5.0%                       10.7%
     Denmark                                              Eurostat                   Q2-2021                      1.5%                       3.0%
     Estonia                                              Eurostat                   Q3-2021                      3.4%                       12.2%
     European Union                                       Eurostat                   Q3-2021                      3.1%                       7.8%
     Finland                                              Eurostat                   Q3-2021                      2.1%                       7.9%
     France                                               Eurostat                   Q2-2021                      2.3%                       3.9%
     Germany                                              Eurostat                   Q3-2021                      3.8%                       9.4%
     Greece                                               Eurostat                   Q3-2021                      1.0%                       3.9%
     Hungary                                              Eurostat                   Q2-2021                      9.4%                       16.0%
     Ireland                                              Eurostat                   Q3-2021                      3.2%                       7.4%
     Italy                                                Eurostat                   Q3-2021                      1.6%                       4.8%
     Japan                                                MLIT                       Q3-2021                      2.3%                       4.6%
     Latvia                                               Eurostat                   Q3-2021                      5.6%                       9.4%
     Lithuania                                            Eurostat                   Q3-2021                      4.5%                       8.5%
     Luxembourg                                           Eurostat                   Q2-2021                      3.0%                       5.2%
     Netherlands                                          Eurostat                   Q3-2021                      3.1%                       5.8%
     New Zealand                                          SNZ                        Q3-2021                      5.2%                       10.9%
     Norway                                               Eurostat                   Q3-2021                      4.3%                       11.1%
     Poland                                               Eurostat                   Q2-2021                      2.9%                       3.5%
     Portugal                                             Eurostat                   Q3-2021                      3.1%                       6.4%
     Slovakia                                             Eurostat                   Q3-2021                      4.6%                       9.4%
     Slovenia                                             Eurostat                   Q3-2021                      5.6%                       14.1%
     Spain                                                Eurostat                   Q3-2021                      2.9%                       11.5%
     Sweden                                               Eurostat                   Q3-2021                      3.3%                       7.4%
     Switzerland                                          Eurostat                   Q2-2021                      0.7%                       1.3%
     Turkey                                               Eurostat                   Q3-2021                      22.1%                      41.9%
     United Kingdom                                       Eurostat/ONS               Q3-2021                      3.7%                       7.0%
     United States                                        Census Bureau              Q3-2021                      5.7%                       13.1%

    Source notes:                                            ca/data/en/dataset/6c365b33-43fb-45aa-9e7b-            ONS = Office of National Statistics: https://
    ABS = Australian Bureau of Statistics: https://www.      5f5765d771ba [Canadian data only covers 2017-          www.ons.gov.uk/businessindustryandtrade/
    abs.gov.au/statistics/economy/price-indexes-and-         2021 period]                                           constructionindustry/datasets/
    inflation/producer-price-indexes-australia/sep-          MLIT = Ministry of Land, Infrastructure, Transport     interimconstructionoutputpriceindices
    2021#data-download                                       and Tourism: https://www.mlit.go.jp/sogoseisaku/       Census Bureau: https://www.census.gov/
    Eurostat: https://ec.europa.eu/eurostat/                 jouhouka/sosei_jouhouka_tk4_000112.html                construction/cpi/
    databrowser/view/STS_COPI_Q__                            SNZ = Statistics New Zealand: https://www.             Data not gathered for the following OECD
    custom_1809990/default/table?lang=en                     stats.govt.nz/methods/price-indexes-for-the-           countries: Chile, Colombia, Costa Rica, South
    StatCan = Statistics Canada: https://open.canada.        construction-industry                                  Korea, Iceland, Israel, and Mexico.
www.tewaihanga.govt.nz
You can also read