TACOMA COMMUNITY CLIMATE ACTION PLAN
←
→
Page content transcription
If your browser does not render page correctly, please read the page content below
DRAFT               CITY OF TACOMA

TACOMA COMMUNITY
CLIMATE ACTION PLAN

        Section 7
88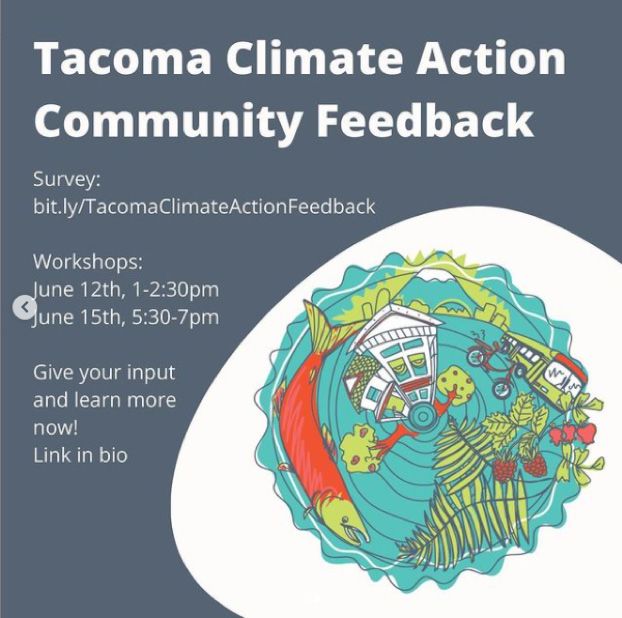
TACOMA COMMUNITY CLIMATE ACTION PLAN - NOV 2021                      DRAFT

SECTION 7, COMMUNITY
ENGAGEMENT SUMMARY
Phase I, Phase II, & III Community Engagement Reports follow here.

                                                                        89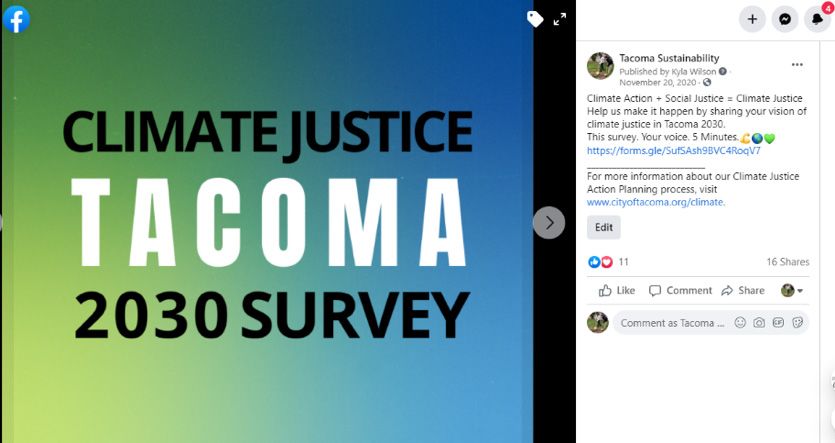
DRAFT                     CITY OF TACOMA

TACOMA COMMUNITY
CLIMATE ACTION PLAN

        Section 7 — PHASE I
90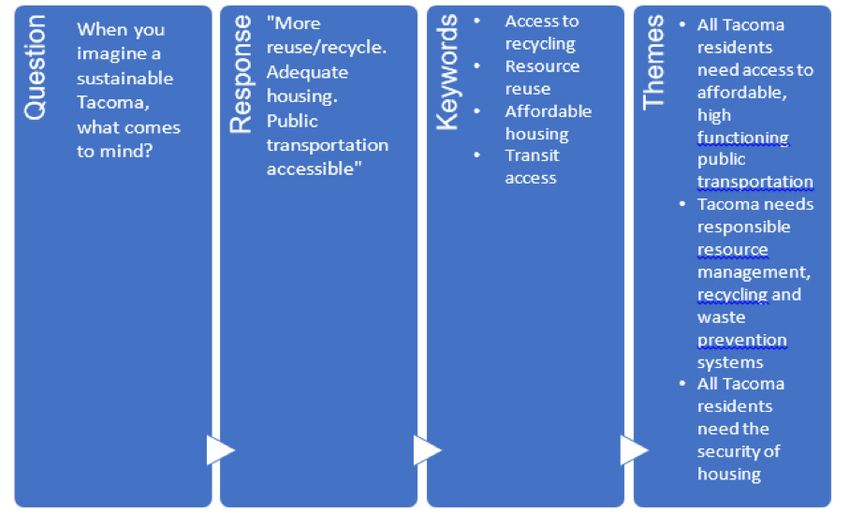
TACOMA COMMUNITY CLIMATE ACTION PLAN - NOV 2021                                                       DRAFT

PHASE I COMMUNITY ENGAGEMENT REPORT
EXECUTIVE SUMMARY
In response to City Council Resolution No. 40509 declaring a climate emergency in
Tacoma and Resolution No. 40622 calling for anti-racist systems transformation, the
climate action planning process aims to center historically underrepresented and underserved
community voices towards a comprehensive climate action plan update to the 2016
Environmental Action Plan.
In partnership with Citizens for a Healthy Bay (CHB), we have developed a phased approach to
community engagement for the climate action planning process. As a local environmental justice
non-profit organization, CHB brings expertise in the natural sciences, environmental policy, and
community collaboration and advocacy.

PHASE I ENGAGEMENT PURPOSE
The first phase of community engagement focused on:
  • Building and deepening local relationships and partnerships
  • Empowering community excitement, expertise, and creativity
  • Activating community members and partner networks
  • Training and educating community members to increase community resilience and
    leadership
  • Understanding and prioritizing the voices of communities that are underrepresented,
    underserved, and made vulnerable to climate change

PHASE I ENGAGEMENT ACTIVITIES
Phase I engagement activities included:
  • Establishing a community Environmental Justice Leaders Workgroup (EJ Leaders) to help
    steer climate action planning, engagement, and Plan content development
  • Collecting community input using interviews, surveys, and visioning activities
  • Facilitating community Climate Ambassadors (Ambassadors) to help collect input, build
    relationships, and provide climate change education

PHASE I ENGAGEMENT METHODS & AUDIENCES
With help from community Climate Ambassadors, we collected community input using
interviews, surveys, and visioning activities. All activities were modified to comply with Covid-19
safety concerns and were flexible to meet the needs of Ambassadors. Some of this input was
gathered as part of staff presentations on Tacoma’s climate impacts and Ambassador-facilitated
discussions on climate change. Some was collected without broader education on climate
change via emails and social media posts. Demographic data was collected through voluntary
reporting to track how successfully we reached different Tacoma communities.
All community responses were read thoroughly. Key ideas were identified in the responses
and then grouped into themes to find the number of times each broad theme was mentioned.

                                                                                                         91
DRAFT                                                                                                     CITY OF TACOMA

We chose to look at the responses by demographic groups of interest to ensure historically
underrepresented community voices were heard. This resulted in top themes for the overall
group of respondents, Black, Indigenous, and People of Color (BIPOC) respondents, low income
(less than $50,000/year) respondents, and youth (under 25 years of age) respondents.

PHASE I COMMUNITY INPUT THEMES
Looking at the community input collected, several top themes emerged. Most top themes
received a similar percent of total responses across all demographic groups. However, specific
demographic groups mentioned certain themes noticeably more or less. For example, the
Barrier, Lack of access to essential services that fulfill basic needs and provide the resources to
thrive, was mentioned 4% and 3% more by BIPOC and Low Income respondents respectively
relative to the All respondents group.

 SUSTAINABILITY PRIORITIES            BARRIERS TO SUSTAINABILITY            COMMUNITY CONCERNS

     • Tacomans need access              • Lack of support for                 • I am concerned about
       to urban green spaces               government leadership                 inequity and injustice in the
       and forests to recreate,            and influence from special            community
       recharge and mitigate               interest groups
                                                                               • I am concerned about
       climate impacts
                                         • Current social norms and              homelessness and access
     • We need a healthy                   values that do not prioritize         to housing
       ecosystem free of pollution         sustainability and care
                                                                               • I am concerned about
       to protect human and
                                         • Lack of access to essential           pollution in the community
       nature welfare
                                           services that fulfill basic           and the health of our
     • We need low carbon                  needs and provide the                 ecosystem
       and active transportation           resources to thrive
                                                                               • I am concerned about
       systems to meet our climate
                                         • Lack of incentives for                climate change impacts
       action goals and connect
                                           businesses to adopt                   and the impact of fossil
       our city
                                           sustainable practices and             fuel industries on our
     • All Tacoma residents need           take responsibility for their         community
       the security of housing             environmental impact

DATA ANALYSIS CONSIDERATIONS
Phase I community input collection emphasized relationship-building and the depth and quality
of input over quantity. This initial engagement serves as a building block for stronger partnerships
and participation from our EJ Leaders, Ambassadors, and other community members during
Phase II.
We leveraged the social networks of Ambassadors, EJ Leaders, and partners to reach community
members we usually do not hear from. We also heard more broadly from the Tacoma community
through social media posts, newsletters, and emails to community members. Though we heard
from a diverse group of respondents and attempted to prioritize hearing from our historically
underserved and underrepresented groups in Tacoma, the input we collected was not accurately
representative of Tacoma citywide demographics nor was it analyzed for statistical significance.

LESSONS AS WE APPROACH PHASE II
Phase II (February – June 2021) will focus on developing strategies and actions to meet our

92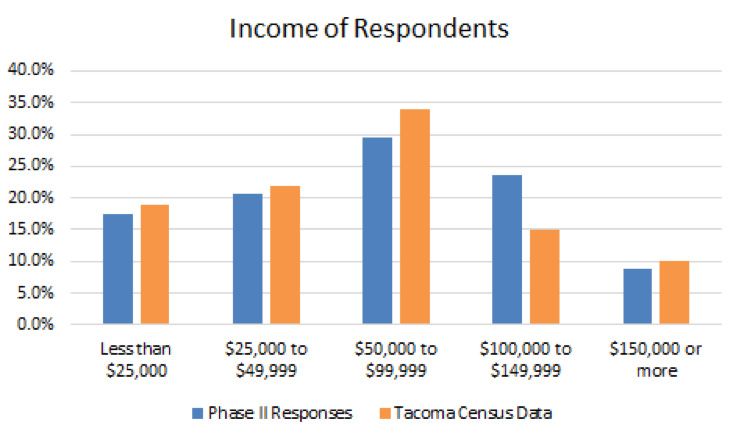
TACOMA COMMUNITY CLIMATE ACTION PLAN - NOV 2021                                                        DRAFT

climate goals and serve anti-racism. We will need to continue building new relationships and
deepening existing relationships with community leaders, community groups, and partner
organizations. With demographic data from Phase I in mind, we plan to focus our efforts to hear
from more diverse communities. Among other strategies, we plan to lead more workshops
hosted by partners and Ambassadors, leveraging our engagement and subject matter expertise
and their social networks. We are also considering casual staff hours-style mini-events and more
one-on-one interviews. The depth and quality of input from our EJ Leaders will continue to be
valuable.

CONCLUSIONS
We successfully engaged a diverse group of Tacoma community members and partners during
Phase I, built new connections, and fostered community climate literacy. What we heard
reinforces past community calls for an intersectional climate action plan that serves social justice
and improves access to basic needs, community health, and ecosystem function for the benefit
of both current and future generations. Developing strategies and actions in a robust and
equitable Plan to meet this vision will require flexibility and adaptation to meet community needs
and engage authentically, particularly with underrepresented and underserved communities.

BACKGROUND
The City of Tacoma (City) defines sustainability as “the City and its citizens meet current needs
without compromising the needs of future generations, such that environmental, social, cultural,
and economic considerations are balanced and integrated in a day-to-day, decision-making
manner” (Resolution 38247). In line with this definition and envisioning an equitable, healthy, and
vibrant community for all, the City has taken action to reduce greenhouse gas emissions for a
sustainable future.
In 2008, the City developed its first Climate Action Plan. This Plan committed Tacoma to
reducing its community-wide greenhouse gas (GHG) emissions by 80% from 1990 levels by
2050, in line with the reduction goals stated in the international Kyoto Protocol. In 2016, the
Environmental Action Plan (EAP) replaced the Climate Action Plan. The EAP outlined nearly 70
actions to implement across six sectors of sustainability through 2020. Sustainability sectors
included buildings and energy, transportation, materials management, natural systems, air and
local food, and climate resiliency. Beside their climate and environmental impacts, actions were
vetted for a mix of co-benefits- their additional benefits to community needs like social equity,
health, affordability, and the local economy. The City of Tacoma and Tacoma Public Utilities
were responsible for leading implementation in collaboration with partner organizations and
community members. Annual reports tracked progress across actions. On December 31, 2020,
the EAP expired. Expert analysis concludes that, accounting for action taken through 2020 and
projecting out to 2050, taking no new actions would lead to only a 14% reduction in Tacoma’s
GHG emissions based on 1990 levels.
To replace the EAP and determine a path for climate action that achieves a climate-safe and
socially just future for Tacoma, the City has collaborated with local partners and community
members. Across a three-phase, year-long planning process from September 2020 – September
2021, the City will coordinate development of a new climate action plan and community
engagement:

                                                                                                          93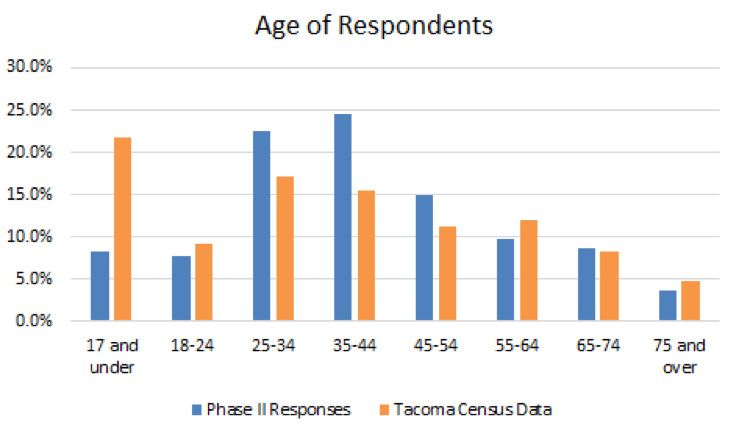
DRAFT                                                                                                    CITY OF TACOMA

Table 1. Outline of climate action planning timeline and main objectives.
 PHASE       ACTIONS                                                          TIMELINE

 1           Understanding Community Priorities                               September 2020 - January
               • Collect baseline data                                        2021
                • Model carbon pollution emissions
  2          Strategy and Action Planning                                     February - June 2021
               • Identify technical opportunities, community benefits

  3          Plan Release and Adoption                                        July - September 2021
                • Center equity in Plan
                • Deliver ambitious and achievable draft plan

PHASE I COMMUNITY ENGAGEMENT OVERVIEW
The purpose of Phase I engagement was to build and deepen community relationships and
partnerships, activate and train community climate leaders, and understand community
sustainability priorities, barriers, and concerns. We also wanted to prioritize and uplift the voices
of communities that are historically underrepresented, underserved, and made vulnerable to
climate impacts.
For Phase I of community engagement, the City pursued an approach that:
     • Adapted engagement safely to the COVID-19 pandemic, moving engagement online
     • Leveraged the energy, creativity, and connections of community participants
     • Emphasized quality by focusing participation from frontline communities, building
       relationships, and seeking greater depth in community input
     • Promoted equity by compensating frontline community members who participated and
       connected their social networks to this process
     • Deployed a mix of engagement methods, including new partnerships, presentations,
       visioning activities, interviews, surveys, social media, and one-to-one outreach
In support of this engagement approach, the City contracted with Citizens for a Healthy Bay
(CHB) to recruit and support community member participation. Citizens for a Healthy Bay is
a local environmental justice non-profit organization with expertise in the natural sciences,
environmental policy, and community collaboration and advocacy. Community participants
served in two compensated roles: Climate Ambassadors (Ambassadors) and the Environmental
Justice Leaders Workgroup (EJ Leaders).
During Phase I, we endeavored to use linguistically- and culturally-accessible communications
and engagement methods, including translation and interpretation services to recruit and
support participants. Community participants, called Climate Ambassadors, helped gather input
on community priorities and concerns from members of their social network, also educating
community members about local climate impacts and planning efforts. We also recruited a
group of community members to serve as an Environmental Justice Leaders Workgroup to learn
about and make recommendations for Tacoma’s climate action planning process. They began
meeting monthly in October 2020 and are working towards writing a chapter of the final Plan.

94
TACOMA COMMUNITY CLIMATE ACTION PLAN - NOV 2021                                                       DRAFT

Both community participant roles serve to center frontline communities’ needs and interests.
We describe frontline communities as those that tend to experience inequity in multiple ways,
whether being historically underrepresented, underserved, or made vulnerable; experiencing
lower quality of life outcomes before COVID-19; or now experiencing worse impacts from the
COVID-19 economic and health crisis. Frontline communities also include those expected to
experience the first and worst consequences of climate damage. Frontline community members
include individuals from one or more of the following backgrounds:
  • Black, Indigenous, and People of Color (BIPOC)
  • Speak English as a second language
  • Living with a low household income
  • Ages 16-26
  • Lesbian, Gay, Bisexual, Transgender, Queer, Intersexed, Asexual, including those
    questioning their gender identity or sexual orientation (LGBTQIA+)
  • Living with three or more generations in one home
  • Living with more than one family in one home
  • Living with a disability
  • Immigrant or refugee
  • Experiencing homelessness
  • Completed formal education less than or up to a high school/GED level

COVID-19 CONSIDERATIONS
It is important to recognize that the climate action planning process was delayed several months
due to the Covid-19 pandemic and Phase I engagement took place during a time of great
stress for our community. We adapted all community engagement to adhere with Covid-19
safety regulations, moving all training and Workgroup meetings online and developing flexible
engagement tools that could be used online or, much less frequently, safely in-person. It was
challenging to build relationships virtually and to engage frontline communities most affected
by the pandemic, the resulting recession, and with varying levels of internet access. To support
our community participants, we offered additional training times, opportunities to catch-up on
training and meeting content one-on-one, and were flexible with participants’ contributions to
make sure they were able to engage at the level that worked best for them. We also sought to
address cost-barriers to people’s participation. Though it is not equivalent to a stable income, we
are grateful to have been able to provide frontline community participants with a stipend for their
contributions to the planning process. Non-frontline community members and those connected
to Tacoma but living and working outside Pierce County were also welcome to participate but
were not eligible for stipends.

                                                                                                         95
DRAFT                                                                                               CITY OF TACOMA

PHASE 1 COMMUNITY ENGAGEMENT METHODS &
PARTICIPANTS
RECRUITMENT METHODS
Staff used a variety of methods to recruit EJ Leaders and Ambassadors from established and new
social networks with the help of other City staff and partner organizations. Social networks were
activated or established with the goal to engage frontline communities. Messaging emphasized
a focus on environmental justice and highlighted compensation for frontline community
members. Methods were virtual in compliance with Covid-19 safety requirements. Online
engagement methods included emails, phone calls, e-newsletters, social media posts and direct
messaging, City webpages, and application tools like Survey Monkey. Physical applications
were offered and used in some cases. Language access relied on the City website’s translation
application and more generally a user’s computer or mobile device translation application.
Translation and interpretation services were also offered by request for application or other
materials.

ENGAGEMENT TOOLS
Staff and community participants gathered community input through visioning activities, surveys,
and interviews. These engagement tools asked community members to imagine Tacoma in the
future, identify individual and community priorities, and barriers to progress. In their simplest
formats, these tools included the following content:

     VISIONING ACTIVITY FORMAT
     The year is 2030. The place I live has __________.
     To get home from my job, I ______________.
     In 2020, __________________ was an issue in Tacoma.
     Now that has changed because ______________.
     In 2030, I finally get to ______________, because _______________.

     SURVEY QUESTIONS
     When you imagine a sustainable Tacoma, what comes to mind?
     What could keep us from getting there?
     What are some concerns you have living in this community?
     Thinking about Tacoma and our region, what climate change impacts are you most
     concerned about?
     What would make it easier for you and others in the community to participate in the climate
     justice action planning update process?
     Any other thoughts/questions/comments?

96
TACOMA COMMUNITY CLIMATE ACTION PLAN - NOV 2021 DRAFT
SELECTED INTERVIEW QUESTIONS
What do you think is going well in Tacoma right now?
What do you hope will be better in the future?
What are you most concerned about when you think about the future of the City or your
neighborhood?
How does ___ issue impact you?
How do you think ___ issue can be overcome?
In the next 5 – 10 years, what do you think we can accomplish in Tacoma?
Each engagement tool included demographic questions for staff to broadly track whether we are
reaching a diverse group of participants and adjust methods if necessary.
Staff and community participants involved in engagement were trained in the use of these tools.
Generally, staff sought to develop new processes, visit new venues, and empower new
relationships to reach a more diverse audience than typically engaged through City planning
efforts. These community participants and venues are detailed below:
CLIMATE AMBASSADORS
Climate Ambassadors serve to connect their social networks to our planning process. We
received 39 Ambassador applications during recruitment and accepted all eligible applicants
as well as EJ Leader applicants who were not selected for the EJ Leader role. This resulted in
an initial group of 46 community members accepting an Ambassador role. Of this group,
33 Ambassadors completed all training and 19 Ambassadors were able complete Phase I
engagement by gathering community input and educating community members about local
climate impacts, planning efforts, and implemented actions.
Ambassadors used a mix of engagement approaches that reflected their strengths and
relationships. While each could use City-developed engagement tools, they were encouraged
to engage with family, friends, or neighbors safely and creatively. Some participants called
old college friends, others talked to family across town, and still others organized COVID-safe
community events or aid deliveries to share information and gather input.
97DRAFT CITY OF TACOMA Figure 1. Demographic summary of Ambassadors who participated in collecting community input from their social networks and outreach. Lessons from Phase I training and implementation activities will be leveraged in Phase II of Ambassador engagement as community priorities are turned into strategies and actions. Phase I Ambassadors will be invited to participate in Phase II, building from their success and relationships. Beyond the input that Ambassadors facilitate through Phases I and II of the planning process, staff hope that their participation fosters appreciation, awareness, and involvement in future local environmental justice work. ENVIRONMENTAL JUSTICE LEADERS WORKGROUP Ten local Environmental Justice Leaders from frontline communities serve on our advisory Workgroup throughout the planning process to make recommendations for both engagement activities as well as strategies and actions that will go into the Plan. They will contribute content to the final Plan, including writing a unique chapter, equitable GHG reduction actions, and any other recommendations as they see fit. Their overall purpose is to advise the City on bold climate actions that meet the needs and interests of frontline communities. Our 10 EJ Leaders were selected from an applicant pool of 41 and all identity as frontline community members. While Phase I work with the EJ Leaders focused on group development, training, and context-building, Phase II will involve regular recommendations from the Workgroup to staff about content to put into the draft Plan. For example, content includes guiding principles, strategies, and actions. Beyond the adoption of a new Plan, staff hope that this process promotes two-way learning, new relationships, and empowers a cohort of local environmental justice leaders. To ensure all EJ Leaders are able to participate equally in meetings and engage with meeting materials, we have been translating documents and have contracted with a local interpreter to assist one member who primarily speaks Spanish. 98
TACOMA COMMUNITY CLIMATE ACTION PLAN - NOV 2021 DRAFT
PRESENTATIONS TO CITY COMMITTEES, BOARDS, AND COMMISSIONS
We visited 13 City of Tacoma committees, boards, and commissions during Phase I to gather
member input on community needs and interests. These community advisory bodies seek to
reflect a breadth of stakeholders and make recommendations to staff and City Council about
various topics. Often, members are well-connected through various organizational or community
relationships, and beyond providing their individual input also served as a means to reach other
social networks.
SOCIAL MEDIA OUTREACH
We leveraged various City and partner organization social media accounts to reach more
community members. These included accounts on Facebook and Instagram administered by
Tacoma Environmental Services, Tacoma Sustainability, and Citizens for a Healthy Bay, among
others. Seven Facebook posts and five Instagram posts were created and shared from Tacoma
Sustainability accounts and then subsequently re-shared by partner accounts. Engaging through
paid social media posts was hindered substantially by budget constraints and social media
policies active at the time of our engagement campaign.
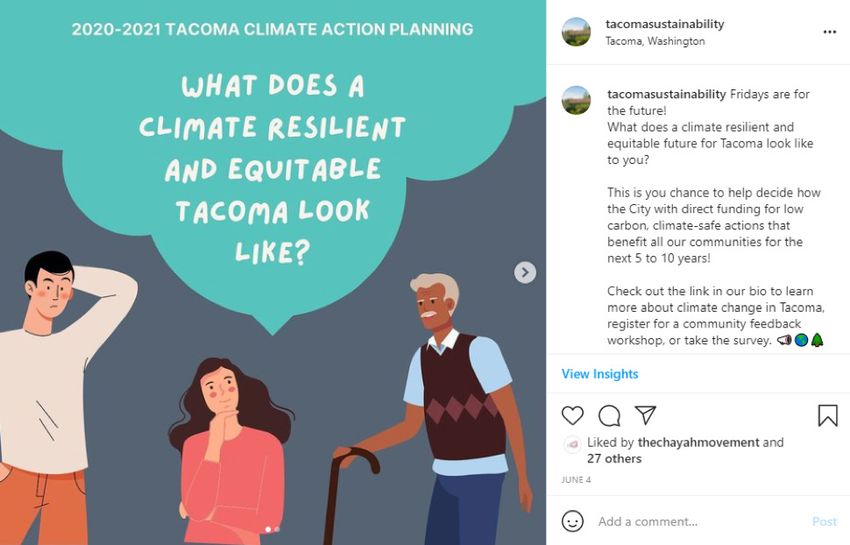
Our highest performing post is featured below and was the only one shared to the Tacoma
Government Facebook page. It featured language about social justice, climate justice, and
community voice. The post reached 3,145 Facebook users, generated 69 link clicks (to the Story
visioning activity), and was shared by 17 accounts. The other six Facebook posts averaged a
reach of 350 users, 4 link clicks, and 3 shares per post. Our five Instagram posts reached an
average of 252 users, 11 interactions, and 5 shares per post.
Figure 2. The social media post most shared and most successful at generating
link clicks to the Story Activity
COMMUNITY INPUT & ANALYSIS PROCESS
Community engagement methods resulted in over 450 responses about community
sustainability priorities, barriers to progress on sustainability issues, and general community
concerns.
99DRAFT CITY OF TACOMA
Community input will be used to:
• Prioritize actions and strategies for emission reductions based on community support and
concern
• Identify actions and strategies that are important to all aspects of an equitable plan and
our planning process but are not captured in the sector-based technical scope of climate
actions
• Inform the EJ Leaders Workgroup’s Guiding Principles for when they write a section of the
Climate Action Plan
• Inform other City plans and policies that fall outside the scope of the Climate Action Plan
PHASE I ENGAGEMENT RESULTS OVERVIEW
Leveraging the connections and knowledge of our community Ambassadors, EJ Leaders, and
community members serving the City on committees, boards, and commissions, we collected
input from 458 participants. While the format of each engagement tool varied, the majority of
responses collected fell within three categories of response: Sustainability Priorities, Barriers to
Sustainability, and Community Concerns.
Table 2. Summary of community participants involved in collecting input and the
total number of responses collected using each engagement tool.
COMMUNITY PARTICIPANTS
Climate Ambassadors 33
Environmental Justice Leaders Workgroup 10
TOTAL 43
RESPONSES BY ENGAGEMENT TOOL
“Story” Community Member Visions 321
Survey Responses 128
Interview Responses 9
TOTAL 458
COLLECTING AND PROCESSING INPUT
Staff collected input with the help of community participants through visioning activities, surveys,
and interviews. Each response was read thoroughly by a Staff person. While reading, staff
developed a list of keywords to tag each response with, adapting the list of keywords to capture
the meaning of each response in detail. This resulted in a total count of how many times each
keyword was brought up by respondents. Related keywords were then grouped into broader
themes. Total mentions of each theme were then compared across different demographic
breakdowns.
Individual responses looked like:
• Story Response 277: In 2030 I finally get "to ride the light rail to Seattle" because "we
funded transit."
100TACOMA COMMUNITY CLIMATE ACTION PLAN - NOV 2021 DRAFT
• Story Response 100: In 2030 I finally get to "Not worry about my health and safety as the
water and air is clean."
• Survey Response 29: "This community doesn't have a robust way to care for or anyone
who is on the verge of poverty or mental health care for anyone living on the margins/
vulnerable."
Here is an example of tagging individual responses with keywords and identifying themes:
Figure 3. Flowchart of grouping community input results from Survey questions,
Story answers, and Interviews into themes.
In this example, the question “When you imagine a sustainable Tacoma, what comes to mind?”
asks the respondent about their sustainability priorities. Their response mentions access to
recycling and resource reuse which fall into the broader theme: Tacoma needs responsible
resource management, recycling and waste prevention systems.
The themes emerging from responses to Survey question 1 (When you imagine a sustainable
Tacoma, what comes to mind?), Story answer 1 (The year is 2030. The place I live has ____. ), and
Story answer 4 (Now that has changed because _____.) as well as relevant Interview responses
were grouped together into the Sustainability Priorities category. Themes from Survey question
2 (What could keep us from getting there?) and Interview responses make up the Barriers to
Sustainability category. The final category, Community Concerns, includes the themes from
Survey question 3 (What are some concerns you have living in this community?), Story answer 3
(In 2020, ______ was an issue in Tacoma.), and Interview responses.
Results from Story answer 2 (To get home from my job, I ______.) and Survey question 4
(Thinking about Tacoma and our region, what climate change impacts are you most concerned
101DRAFT CITY OF TACOMA
about?) were analyzed separate to avoid over emphasizing transportation related themes in
Sustainability Priorities and climate change impacts in Community Concerns.
Results from Story answers 5 and 6 were often highly personalized responses about actions
respondents would like to take in 2030. Though these responses do help frame the community’s
vision for what life is like in 2030, they have been excluded from analysis of priorities, barriers,
and concerns.
WHO WE HEARD FROM
In order to track how well we reached historically underserved, underrepresented and
overburdened communities, we asked respondents several demographic questions including
race/ethnicity, age, gender, household income (2019), homeownership, zip-code, and primary
language spoken at home. Not all respondents chose to answer each of these demographic
questions or preferred to self-describe. The following information about respondents reflect the
83% who chose to answer demographic questions.
For our analysis, we focused on our success at reaching three main groups:
• Black, Indigenous, People of Color (BIPOC) communities
• Respondents who identified as Black/African, Native American/Alaska Native, Latinx/
Non-white Hispanics, Asian, Pacific Islander/Native Hawaiian, Middle Eastern/North
African, and/or more than one of these races/ethnicities.
• Low Income respondents
• Respondents whose household income was less than $50,000/year.
• Youth respondents
• Respondents less than 25 years old.
Figure 4. A summary of Climate Action Planning Respondent demographics in
comparison to Tacoma Census Projections.
102TACOMA COMMUNITY CLIMATE ACTION PLAN - NOV 2021 DRAFT
It is important to note that we fell short of reaching a representative sample of Tacoma
residents, particularly for the historically underserved groups BIPOC and Low Income. We know
that the Covid-19 pandemic and recession is particularly challenging for these communities, and
it tends to be exacerbated by unequal internet access. However, the percentage of Youth we
reached is skewed because the Tacoma census data Youth percent includes residents aged 0-14
who were not a focus in our input gathering. For more details on age demographics, see Figure
7.
We heard from a diverse group of Tacoma community members; however, there is room to
improve our outreach to key communities of color, low income community members, and
some age groups to ensure equitable climate actions and strategies for the Plan. Effective
engagement of diverse, frontline communities will depend on mitigating barriers and being
flexible with peoples’ capacity to participate. On the other hand, it will also be important to value
qualitatively rich input from fewer, well-connected individuals and service organizations rather
than high levels of participation from communities that may be experiencing extraordinary day-
to-day burdens.
BIPOC COMMUNITIES
Figure 5. A complete breakdown of the 379 responses to the race/ethnicity
demographic question. 17% of respondents chose not to answer or chose to self-
describe. 11.1 % of respondents selected more than one race/ethnicity option.
These responses are broken out in detail in Table 1.
103DRAFT CITY OF TACOMA Table 3. The total number of responses for each multi-racial/ethnic identity selected in response to the race/ethnicity demographic question. TWO OR MORE RACE/ETHNICITY # OF RESPONSES Asian and White 7 LatinX/Non-white Hispanic and White 6 Pacific Islander/Native Hawaiian and White 5 Native American/Alaska Native and White 4 Native American/Alaska Native, LatinX/Non-white Hispanic, and White 3 Black/African, Asian, and White 3 Native American/Alaska Native and LatinX/Non-white Hispanic 2 Black/African, Middle Eastern/North African, and White 2 Pacific Islander/Native Hawaiian and Black/African 1 Pacific Islander/Native Hawaiian and Asian 1 Native American/Alaska Native, LatinX/Non-white Hispanic, and Black/ 1 African Native American/Alaska Native and Asian 1 LatinX/Non-white Hispanic, Asian and White 1 LatinX/Non-white Hispanic and Black/African 1 Asian and Middle Eastern/North African 1 Black/African and White 1 Middle Eastern/North African and White 1 Asian, Pacific Islander/Native Hawaiian, Native American/Alaska Native, 1 LatinX/Non-white Hispanic, Black/African, and White Based on the race/ethnicity demographic results from Phase I, we know moving forward that we need to make more of an effort to reach BIPOC community members. Particularly, we need new strategies for reaching Tacoma’s Latinx/Non-white Hispanic community. This was the race/ ethnicity with the greatest gap between our results and Tacoma census data. 104
TACOMA COMMUNITY CLIMATE ACTION PLAN - NOV 2021                                              DRAFT

LOW INCOME RESPONDENTS

Figure 6. Responses to household income demographic question by income
bracket. 17% of total respondents chose not to answer this question. The above
percentages reflect only the 380 responses to this question.

Our community input results over-represent high income households. 41% of Tacoma
households earn less than $50,000 per year (US Census Bureau, 2019). Median household
income is around $62,000/year (US Census Bureau, 2019). Only 29% of Phase I climate action
planning respondents had a household income less than $50,000/year. During Phase II, we
hope to reach more low income residents.

YOUTH RESPONDENTS

Figure 7. Responses to age demographic question by age bracket. 14% of total
respondents chose not to answer this question. The above percentages reflect
only the 394 respondents who answered this question.

                                                                                               105
DRAFT CITY OF TACOMA The median age in Tacoma is 36 (US Census Bureau, 2019). The majority of our respondents were under 45 years old and most of our younger age brackets are over-represented in comparison to the Tacoma census data, except for those under 17. However, a more accurate comparison for our respondents who answered “under 17” may be to Tacoma’s 15-17 year old population, roughly 4% of the City’s total population. While a few of our Climate Ambassadors were high school age and maybe have collected input from their peers, we did not target younger children in our data collection which are included in the Tacoma 17 and under group. We did not hear from as many community members 65 years old and over. Elders do face more health risk as the number of extreme heat days in Tacoma rises due to climate change. Our over-representation of younger age groups may be a result of the online nature and social media focus for much of our outreach and input collection due to Covid-19 safety concerns. 92.5% of those who did respond as 65 and over are also white. Therefore, we need to reach more BIPOC elders during Phase II to better represent Tacoma. WHAT WE HEARD SUSTAINABILITY PRIORITIES In this category of responses, there were 94 unique response tags grouped into 22 themes and an additional ‘other’ category for response tags that were very general (ex. improved, sustainable) or either did not relate to other response tags to be grouped or have enough responses to be featured individually. For the complete list of themes and percent of responses for each by demographic group, see Supplemental Figures, Table 1. Generally, there was agreement between the demographic groups on priorities for achieving a sustainable Tacoma. However, there were some variations in how often priorities were mentioned by each demographic group. 106
TACOMA COMMUNITY CLIMATE ACTION PLAN - NOV 2021                                                       DRAFT

Figure 8. The top 4 sustainability priority themes with the percent of total
responses for each theme by demographic group.

Some differences in top sustainability priorities are demonstrated in Graph 6. The
theme Tacomans need access to urban green spaces and forests to recreate, recharge and
mitigate climate impacts was mentioned more frequently by BIPOC community members in
comparison to the other demographic groups. Youth respondents mentioned topics and ideas in
the We need a healthy ecosystem free of pollution to protect human and nature welfare theme to
a greater extent than other groups. Low income respondents mentioned housing access within
the All Tacoma residents need the security of housing theme more than other groups.
Ideal Future Transportation Options
One of the Story answers asked respondents specifically about how they envision commuting to
and from work in a sustain 2030 Tacoma scenario. The results of these responses complement
the high interest in low carbon and active transportation options as well as access to affordable
and reliable public transportation – another theme in the top 6 group of sustainability priorities.

                                                                                                        107
DRAFT CITY OF TACOMA
Figure 9. The top 5 themes on how we commute in 2030 with the percent of total
responses for each theme by demographic group.
While close to 10% of respondents imagined they would still be driving (single occupancy
vehicle) to get home from their job in 2030, close to 30% of respondents across all demographic
groups mentioned walking or biking and safe pedestrian routes. Accessible and high function
public transportation was of particular interest to low income community members.
Key takeaways
• Community members think of sustainability across social, economic, and environmental
spheres in line with the City’s definition of sustainability (see page x).
• Access to nature/urban greenery, the health of our ecosystems, low carbon transportation
options, and access to housing are all necessary components of a sustainable Tacoma.
• City walkability and bike-ability, both in terms of infrastructure and design for safe
connections and opportunities to live and work in the same neighborhood, are important
to the community.
BARRIERS TO SUSTAINABILITY
In this category there were 54 unique response tags grouped into 17 themes to capture
responses from Survey question 2 and the Interviews. For the complete list of themes and
percent of responses for each by demographic group, see Supplemental Figures, Table 2.
The top four Barriers to Sustainability were the same for all demographic groups, but there are
some differences in prioritization between groups. The most frequently mentioned barrier by all
demographic groups, and of particular concern to Youth respondents, was a lack of support and
leadership from the government and the influence of special interest groups. A lack of cultural
values and social norms that promote sustainability and a lack of incentives for businesses to take
108TACOMA COMMUNITY CLIMATE ACTION PLAN - NOV 2021 DRAFT
responsibility for their impact and adopt sustainable practices were also top mentioned barriers.
Low Income and BIPOC respondents were particularly concerned about the community’s lack of
essential services and basic needs as a barrier to action.
Figure 10. The top 4 barriers to sustainability themes with the percent of total
responses for each theme by demographic group.
Key Takeaways
• We need to improve government accountability and transparency and demonstrate our
leadership in climate actions.
• A lack of community resources and basic needs prohibits participation and achieving
equitable sustainability and climate goals.
• We need to promote ethics of care at a personal and business level.
COMMUNITY CONCERNS
The design of all engagement tools was intentionally open-ended to allow for a diversity of
responses. The climate action plan will influence many facets of life in Tacoma. In order to design
109DRAFT CITY OF TACOMA equitable actions and strategies, we felt it was important to be aware of broader issues in the community to avoid perpetuating inequitable systems and find co-benefits where possible. The question about community concerns was not specifically about climate action; however, sustainability concerns are reflected in the responses more so than in other City surveys of community concerns. This may be due to the climate action planning framing of all engagement. 96 unique response tags were grouped into 17 community concern themes. For the complete list of themes see Supplemental Figures, Table 3. Social issues like inequity, injustice, homelessness, and housing access were of high concern. Pollution and ecosystem health as well as impacts of climate change were also of high concern. Figure 11. The top 4 community concern themes with the percent of total responses for each theme by demographic group. 110
TACOMA COMMUNITY CLIMATE ACTION PLAN - NOV 2021                                                    DRAFT

CLIMATE IMPACTS OF CONCERN
Survey question 4 shared a list of climate change impacts we are experiencing and expect
to experience more of in Tacoma and asked respondents about which climate impacts they
were most concerned about. Concern about climate impacts and impacts from the fossil fuel
industries in Tacoma was a top general community concern and the results below expand
on respondents’ specific climate change concerns. The related impacts of air quality and
forest susceptibility to wildfires were both top climate impact concerns. Recent wildfire events
may have increased concern about air quality and human health. In 2018 and 2020, Tacoma
experienced unhealthy air quality due to wildfires in California, Oregon, and both Eastern
and Western Washington. Concern about impacts to wildlife and natural systems as well as
freshwater availability were also frequently mentioned by all demographic groups. Youth and
BIPOC respondents mentioned ecosystem impacts more than other demographic groups.
Youth respondents were also particularly concerned about impacts to forest and the threat of
wildfire.

Figure 12. Top 4 regional climate impacts of concern with the percent of total
responses for each demographic group.

                                                                                                      111
DRAFT CITY OF TACOMA
Key Takeaways
• We need to continue addressing environmental and social justice issues related to the
climate action plan.
• We need to focus on co-benefits to climate action and design strategies that address
pollutants and housing affordability and availability.
• It may be beneficial to focus climate impact and benefits of climate action communication
on protecting ecosystem function and forests, improving air quality, and ensuring
freshwater availability.
COMMUNITY INPUT ON FUTURE ENGAGEMENT
We had 148 responses to Survey question 5 about how we can improve our community
engagement. The most common response was feedback for general improvements to
communication and publicity. Several tools such as surveys, events, social media, and emails
were also mentioned. Additionally, a few values for community engagement were raised by
respondents. These included centering community voice and community actions, improving
government transparency and building trust.
Table 4. Top suggestions for facilitating future community input and participation
in climate action planning by demographic group. Most mentioned responses are
highlighted in green for each demographic group.
WHAT WOULD MAKE IT EASIER FOR YOU AND
OTHERS IN THE COMMUNITY TO PARTICIPATE LOW
ALL % BIPOC % YOUTH %
IN THE CLIMATE JUSTICE ACTION PLANNING INCOME %
UPDATE PROCESS?
General communication and publicity 16.89 16.28 16.67 24.00
Focus on community voice 6.76 2.33 5.00 4.00
Surveys 4.73 0.00 1.67 4.00
Social Media 4.73 6.98 3.33 0.00
Host online events 4.05 0.00 5.00 4.00
Emails 3.38 2.33 1.67 0.00
Host Events 3.38 4.65 3.33 0.00
Improve government transparency 3.38 2.33 3.33 4.00
Focus on community actions 2.03 4.65 0.00 12.00
Focus on building trust 1.35 4.65 3.33 0.00
Key Takeaways
• We need to be communicating more and more widely about climate action planning.
• Focusing on community actions and voice may help increase participation.
• Hosting online events and using social media can be useful tools for reaching the
community, especially during the Covid-19 pandemic when in-person events cannot be
organized.
112TACOMA COMMUNITY CLIMATE ACTION PLAN - NOV 2021 DRAFT
SELECTED FEEDBACK FROM EJ LEADERS WORKGROUP
The EJ Leaders Workgroup is providing feedback during all three phases of climate action
planning. An early draft of Phase I community input results were shared with the EJ Leaders.
Selected feedback from EJ Leaders on the community input results as well as broader feedback
on Phase I processes is included below.
• Socio-ecological work we do in Tacoma affects the traditional lands of the Puyallup
Tribe. City planning needs to be in collaboration and consultation with Tribal leadership.
• Plan actions and strategies should focus on the inequitable impact of co-pollutants,
on human health and future generations. Reducing GHG emissions by, for example,
electrifying transportation, also reduces pollutants like particulate matter and ozone which
disproportionately affect the health of low income residents and BIPOC communities who
often live closer to major roads.
• The majority of Phase I results are related to impacts on human systems. This may be
due to the anthropocentric framing of Interview, Survey, and Story questions. Our Plan
should highlight the interdependency of natural and human systems and illustrate climate
change’s ecological impacts on other animals and plants.
• Our Plan should have transparent monitoring and reporting methods with greater
opportunity for community leadership and participation.
DATA ANALYSIS CONSIDERATIONS
Though the respondents we reached during Phase I engagement and the input we
gathered is not a representative sample of Tacoma citywide demographics and was
not evaluated for statistical significance, it is important to keep in mind the purpose of
Phase I. Our engagement process and community input collection had the additional
goals of building community relationships and knowledge for future climate action. We
intentionally emphasized depth and quality of input over quantity. This initial engagement serves
as a building block for stronger partnerships and participation from our EJ Leaders, Ambassadors,
and other community members during Phase II.
We would have liked to gather more BIPOC and low income community member responses in
the Phase I community input. However, we hope the additional input and feedback we continue
to receive from the EJ Leaders Workgroup will supplement what we missed in community input.
We are continuously learning through this new engagement and planning process. We have
made progress through working with the social networks of Ambassadors, EJ Leaders, and
partners to reach community members we usually do not hear from.
The responses we gathered through social media posts and email lists may have primarily come
from respondents already aware of sustainability and climate change issues in Tacoma since they
most likely connected with us through the Office of Environmental Policy and Sustainability or
CHB resources. This may have influenced the results we found for top priorities, barriers, and
concerns.
113DRAFT CITY OF TACOMA
LESSONS LEARNED
Staff have identified various lessons from this new approach to engagement.
STRENGTHS
• Building from existing relationships
• Establishing new relationships
• Compensating frontline community member participation
• Empowering community excitement, expertise, creativity, and leadership
• Learning from path-breaking communities, including Fort Collins, CO, King County, WA,
and Providence, RI, among others
• Building on linguistically and culturally accessible communications and engagement
ROOM FOR IMPROVEMENT
• Activating community member networks
• Training community participants for creative and insightful engagement
• Balancing community input processes with relationship-building and
leadership development
• Hearing from and uplifting the voices of communities that are underrepresented,
underserved, and made vulnerable
CONCLUSION
Towards building a robust and equitable climate action plan, Phase I engaged a diverse group of
Tacoma community members and partners to better understand current sustainability priorities,
barriers to sustainability, and general community concerns. We successfully established an
EJ Leaders Workgroup of 10 frontline community members and trained over 30 community
Climate Ambassadors. In collaboration with Ambassadors and partners, we gathered input
from 458 community members. These responses reinforce the necessity for a socially just and
intersectional climate action plan that can improve community health, access to basic needs, and
ecosystem function for the benefit of future and current generations.
From what we have learned during Phase I of climate action planning, we will need to continue
building relationships with community leaders, community groups, and partners and adapting
our engagement techniques to reach historically underrepresented and underserved community
members. The Covid-19 pandemic and recession will continue to burden some communities
and community members worse than others, and internet access remains an issue. Staff will seek
to emphasize quality over quantity to limit engagement burdens as well as continue to center
equity.
114TACOMA COMMUNITY CLIMATE ACTION PLAN - NOV 2021 DRAFT
SUPPLEMENTAL FIGURES
Table 5. Complete list of Sustainability Priorities Themes and the percent of total
responses included in each theme for All respondents and our demographic
groups of interest. Percentages greater than or equal to 6% are highlighted in
green to show top themes for each demographic group.
LOW
SUSTAINABILITY PRIORITIES ALL % BIPOC % INCOME YOUTH %
%
Tacomans need access to urban green spaces and forests 8.69 9.51 5.60 5.10
to recreate, recharge and mitigate climate impacts
We need low carbon and active transportation systems to 6.95 7.66 6.02 6.46
meet our climate action goals and connect our city
All Tacoma residents need the security of housing 6.95 5.80 8.30 6.80
We need a healthy ecosystem free of pollution to protect 6.22 6.96 6.43 8.50
human and nature welfare
All Tacoma residents need access to affordable, high 5.95 6.96 6.85 6.46
functioning public transportation
Tacoma needs to end dependence on fossil fuels, 5.37 4.64 5.60 6.46
prevent new fossil fuel infrastructure and investments, and
to invest in renewable, clean energy sources
We need equitable and just transformation that centers 4.90 6.03 5.19 4.42
those most vulnerable in our community
For a thriving Tacoma, We need more community 4.48 6.03 5.60 6.12
resources, spaces, voices and partnerships
A thriving Tacoma is a place where people feel a sense of 4.00 3.48 2.90 4.76
belonging and support from their community, where the
community is diverse, and local arts and culture flourish
Tacoma's built environment needs to be thoughtfully 3.95 3.71 2.49 2.38
planned to support emission reduction, sustainable
resource use, and protect land
We need to support local urban farming and ensure 3.69 2.78 3.73 2.38
access to healthy food for all
We need support for local decent paying job 3.64 3.02 3.73 5.44
opportunities in Tacoma, including sustainable green jobs
Tacoma needs responsible resource management, 3.53 4.64 5.39 5.78
recycling and waste prevention systems
We need to restore and protect our vital ecosystems, with 3.27 3.94 4.98 2.04
special attention to Commencement Bay and the Tideflats
Tacomans need easy access to quality healthcare, 3.11 2.55 3.11 2.38
including mental health and substance abuse support for
healthy individuals and community
We need to act now to mitigate climate change impacts 2.32 2.09 2.07 4.42
and adapt to a changing environment
115DRAFT CITY OF TACOMA
LOW
SUSTAINABILITY PRIORITIES ALL % BIPOC % INCOME YOUTH %
%
Everyone needs access to high quality and affordable 2.00 2.55 2.07 2.04
education, which should include environmental and
climate science
We need a representative government that is transparent 1.79 0.70 2.49 2.04
and accountable to the community
Police reform 1.37 0.70 1.24 1.02
In order to meet Tacoma's sustainability and climate goals 1.16 0.70 0.83 1.02
we need real financial investment.
We need to invest in city infrastructure to prevent water 0.95 1.16 1.45 0
pollution and ensure access to clean water.
Tacoma needs to be a safe place to live, work, and 0.90 0.46 0.41 1.02
recreate
Other 14.81 13.92 13.49 12.93
TOTAL 100 100 100 100
Table 6. Complete list of Barriers to Sustainability Themes and the percent of
total responses included in each theme for All respondents and our demographic
groups of interest. Percentages greater than or equal to 6% are highlighted in
green to show top themes for each demographic group.
LOW
YOUTH
BARRIERS TO SUSTAINABILITY ALL % BIPOC % INCOME
%
%
Lack of support for government leadership and influence 11.29 11.89 9.62 14.77
from special interest groups
Current social norms and values that do not prioritize 9.03 9.09 7.53 9.09
sustainability and care
Lack of incentives for businesses to adopt sustainable 8.42 6.29 8.79 12.50
practices and take responsibility for their environmental
impact
Lack of sufficient funding 8.21 7.69 5.86 9.09
Lack of access to essential services that fulfill basic needs 7.80 11.89 10.04 6.82
and provide the resources to thrive
Historical representation and inequity that persist today, 7.19 5.59 8.79 6.82
particularly a lack of acknowledgement of Indigenous
rights and knowledge
Lack of community leadership and opportunities for 6.37 6.29 7.53 4.55
collaboration between community groups, businesses,
and government agencies
Our current economic system that perpetuates inequity 5.75 4.20 4.60 4.55
and natural resource extraction
116TACOMA COMMUNITY CLIMATE ACTION PLAN - NOV 2021 DRAFT
LOW
YOUTH
BARRIERS TO SUSTAINABILITY ALL % BIPOC % INCOME
%
%
Lack of strategic urban growth management and 5.13 3.50 3.77 3.41
planning to reach our long term goals
Lack of access to affordable, efficient, and low carbon 4.31 4.20 4.18 3.41
public transportation and active transportation options
that prevent us from reducing single-occupancy vehicle
use
Lack of action to reduce greenhouse gas emissions, 4.31 3.50 5.02 7.95
divest from fossil fuel industries, and act on climate
change
Lack of environmental awareness and curriculum in 3.70 6.29 3.77 2.27
schools
Inequitable prioritization and allocation of resources to 2.87 2.10 2.51 5.68
areas of need in Tacoma
Lack of regulations and systems to prevent pollution and 2.87 1.40 2.93 0.00
protect our vital ecosystems for future generations
Lack of local employment opportunities with fair wages 2.46 4.20 2.93 2.27
Police Reform 1.64 2.80 2.51 1.14
Lack of available recycling and waste prevention systems 1.44 2.10 1.67 1.14
Other 7.19 6.99 7.95 4.55
TOTAL 100.00 100.00 100.00 100.00
Table 7. Complete list of Community Concern Themes and the percent of total
responses included in each theme for All respondents and our demographic
groups of interest. Percentages greater than or equal to 6% are highlighted in
green to show top themes for each demographic group.
LOW
COMMUNITY CONCERNS ALL % BIPOC % INCOME YOUTH %
%
I am concerned about inequity and injustice in the 12.59 14.09 8.44 8.76
community
I am concerned about homelessness and access to 10.86 10.00 10.06 7.73
housing
I am concerned about pollution in the community and the 10.58 13.64 7.79 11.34
health of our ecosystem
I am concerned about climate change impacts on our 9.22 8.64 9.74 8.76
community and fossil fuel industries
I am concerned about access to essential services and 8.30 7.73 9.74 5.67
basic needs
I am concerned about government leadership, 6.84 9.55 9.09 8.25
willingness to take action, planning, and accountability
117DRAFT CITY OF TACOMA
LOW
COMMUNITY CONCERNS ALL % BIPOC % INCOME YOUTH %
%
I am concerned about the impact of the Covid-19 6.39 4.55 4.22 9.79
pandemic
I am concerned about economic stability, poverty, and 5.20 6.36 6.82 5.67
the distribution of wealth in the community
I am concerned about access to public transportation, 4.38 3.18 2.27 4.12
active transportation, and low carbon transportation
options in the community
I am concerned about safety in my community 3.56 0.45 3.25 3.09
I am concerned about policing in the community 3.56 4.09 4.55 5.67
I am concerned about inequitable new urban 3.01 2.27 4.87 5.67
development in Tacoma
I am concerned about the influence of the private sector 2.10 0.91 2.60 2.58
on our regulations and a lack of corporate responsibility
for environmental impacts
I am concerned about City infrastructure, such as freeway 2.10 1.36 2.27 1.03
construction and sidewalks
I am concerned about access waste prevention programs 1.92 2.27 1.95 5.15
in the community
I am concerned about our community values and culture 1.28 1.82 2.60 2.06
I am concerned about urban greenery and access to 1.00 1.36 0.32 0.52
green space
Other 7.12 7.73 9.42 4.12
TOTAL 100.00 100.00 100.00 100.00
118TACOMA COMMUNITY CLIMATE ACTION PLAN - NOV 2021 DRAFT
TACOMA COMMUNITY
CLIMATE ACTION
PLAN
Section 7 — PHASE II 119DRAFT CITY OF TACOMA
PHASE II COMMUNITY ENGAGEMENT REPORT
EXECUTIVE SUMMARY
In response to City Council Resolution No. 40509 declaring a climate emergency in Tacoma
and Resolution No. 40622 calling for anti-racist systems transformation, Tacoma’s climate action
planning process aims to center historically underrepresented and underserved community
members in developing a comprehensive climate action plan update to the 2016 Environmental
Action Plan.
In partnership with Citizens for a Healthy Bay (CHB), we implemented a phased approach to
community engagement. As a local environmental justice non-profit organization, CHB brings
expertise in the natural sciences, environmental policy, and community collaboration and
advocacy.
PHASE II ENGAGEMENT PURPOSE
The second phase of community engagement focused on:
• Building and deepening local relationships and partnerships
• Activating community members and partner networks
• Training and educating community members to increase community resilience and
leadership
• Providing information and context for informed community feedback
• Understanding and prioritizing communities that are underrepresented, underserved, and
made vulnerable to climate change
• Collecting feedback on draft actions and strategies for the climate action plan
PHASE II ENGAGEMENT ACTIVITIES
Phase II engagement activities included:
• Continued monthly Environmental Justice Leaders Workgroup (EJ Leaders) and Sustainable
Tacoma Commission (STC) meetings to help steer climate action planning, engagement,
and Plan content development
• Facilitating community Climate Ambassadors (Ambassadors) to help collect input, build
relationships, and provide climate change education
• Collecting community input using online and in-person surveys
• Delivering information and collecting input through virtual informational presentations and
interactive workshops
PHASE II ENGAGEMENT METHODS & PARTICIPANTS
To collect community input on draft strategies and actions for the climate action plan, we
conducted nine workshops hosted by frontline community serving organizations, four
workshops hosted by the City and CHB, two in-depth meetings with the Sustainable Tacoma
Commission, and two in-depth meetings with the Environmental Justice Leaders. We also
provided an online survey for community members unable to attend a Workshop to give detailed
120You can also read