Symptom locus and symptom origin incongruity in runner's dystonia - case study of an elite female runner - Research Square
←
→
Page content transcription
If your browser does not render page correctly, please read the page content below
Symptom locus and symptom origin incongruity in
runner’s dystonia. – case study of an elite female
runner
Issei Ogasawara, Ph.D.
Department of Health and Sport Sciences, Graduate School of Medicine, Osaka University
https://orcid.org/0000-0003-4176-689X
Noriaki Hattori, M.D., Ph.D.
Department of Rehabilitation, Faculty of Medicine, Academic Assembly, University of Toyama
Gajanan S. Revankar, M.D., Ph.D.
Department of Health and Sport Sciences, Graduate School of Medicine, Osaka University
Shoji Konda, Ph.D.
Department of Health and Sport Sciences, Graduate School of Medicine, Osaka University
Yuki Uno, M.S.
Department of Health and Sport Sciences, Graduate School of Medicine, Osaka University
Tomohito Nakano, M.D., Ph.D.
Department of Neurology, Graduate School of Medicine, Osaka University
Yuta Kajiyama, M.D., Ph.D.
Department of Neurology, Sakai City Medical Center
Hideki Mochizuki, M.D., Ph.D.
Department of Neurology, Graduate School of Medicine, Osaka University
Ken Nakata, M.D., Ph.D. ( ken.nakata@hss.osaka-u.ac.jp )
Department of Health and Sport Sciences, Graduate School of Medicine, Osaka University
Research Article
Keywords: Yips, Task specific focal dystonia, Running, segmental dystonia, involuntary movement
Posted Date: October 7th, 2021
DOI: https://doi.org/10.21203/rs.3.rs-958633/v1
License: This work is licensed under a Creative Commons Attribution 4.0 International License.
Read Full License
Page 1/19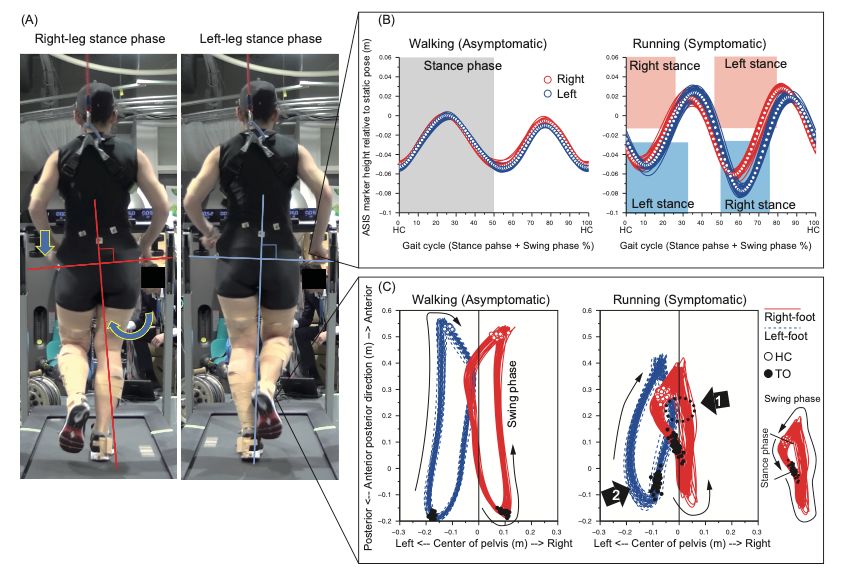
Abstract
Objectives: Runner's dystonia is a task specific dystonia that occurs in the lower limbs and trunk, with
diverse symptomatology. We aimed to identify the origin of a dystonic movement abnormality using
combined three-dimensional kinematic analysis and electromyographic (EMG) assessment during
treadmill running.

Participant: A twenty-year-old female runner who complained of right-foot collision with the left-leg during
right-leg swing-phase, that mimicked right-ankle focal dystonia.

Results: Kinematic and EMG assessment of her running motion was performed which showed a
significant drop of the left pelvis during right-leg stance-phase, and a simultaneous increase of right hip
adductor muscle activity. This resulted in a pronounced adduction of the entire right lower limb with
respect to the pelvis segment. Trajectories of right-foot were seen to encroach upon left-leg area.

Discussion: These findings suggested that the symptom of this runner was most likely a form of
segmental dystonia originating from an impaired control of hip and pelvis, rather than a distal focal ankle
dystonia.

Conclusion: We conclude that, for individualized symptom assessment, deconstructing the symptom
origin from its secondary compensatory movement is crucial for characterizing dystonia. Kinematic and
EMG evaluation will therefore be a prerequisite to distinguish symptom origin from secondary
compensatory movement.

Introduction
Focal task specific dystonia (FTSD) is a type of movement disorder that results in an abnormal
involuntary muscle contraction of a focal body part during a specific well-learned task (Stahl and Frucht,
2017). FTSD have been frequently observed as writer’s cramps or musician’s dystonia in literature (Frucht,
2004; Goldman, 2015). One little-known phenomenon is runner’s dystonia (RD), symptoms characterized
by an involuntary lower limb movement occurring only during running, and when severe, also during
walking (McClinton and Heiderscheit, 2012; Wu and Jankovic, 2006). Foot and the lower limb muscles are
commonly affected(Leveille and Clement, 2008) which may spread to the pelvis and trunk (Ahmad et al.,
2018; Suzuki et al., 2011). Runners older than 40 years of age, or those trained for a long time tend to
suffer from this symptom (Ahmad et al., 2018; Ramdhani and Frucht, 2013; Schneider et al., 2006; Wu
and Jankovic, 2006). Since RD is a rare pathology relative to the upper limb’s dystonia (Leveille and
Clement, 2008; Wu and Jankovic, 2006), the kinematic or muscle activity patterns are known to vary
widely (Ahmad et al., 2018).

Recently, a 20yr old female elite runner presented to us with an abnormal, involuntary, right-ankle
movement, consistently occurring during shoed running. Her first symptom appeared when she was
around 18 years old. She gave a history that during running, the medial-side of her right-forefoot collided

                                                  Page 2/19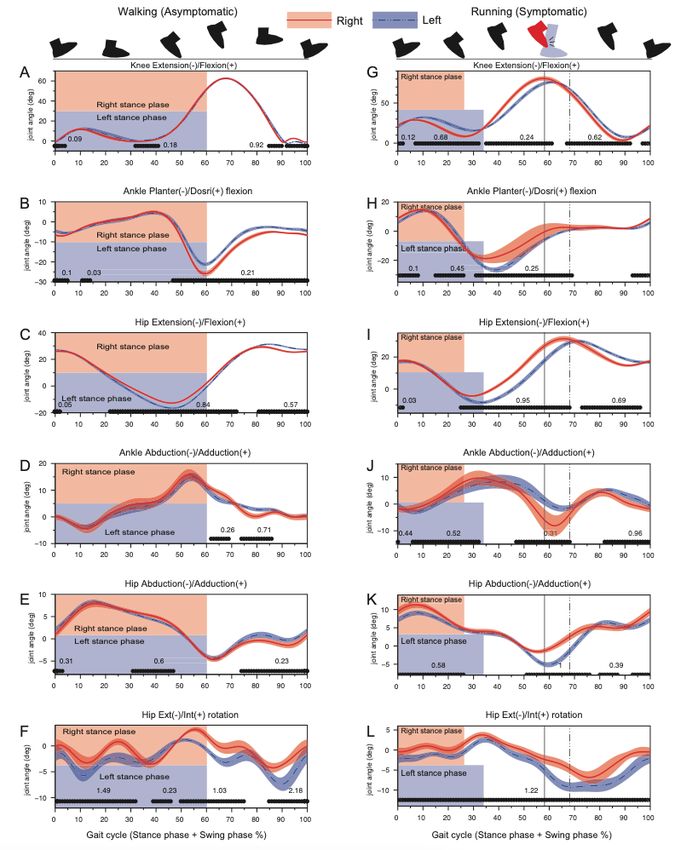
with the medial aspect of left calf during the right-leg swing-phase. She was able to walk forwards,
backwards, and sideways normally. Following examination by a general physician, she was diagnosed
with RD of right ankle and advised exercise-based physiotherapy for the right ankle. However, this
physiotherapy intervention was unsuccessful. Since her problems persisted without relief, she was
referred to our department in Osaka University for a detailed evaluation of the problem.

To address and manage the athlete’s condition, we performed a dynamic evaluation of her running
movement pattern using joint kinematics and surface electromyography (EMG). Previous descriptive case
studies have outlined movement pattern estimation mainly by visual inspection or by off-line video
observation (Lee et al., 2021; Schneider et al., 2006; Stan et al., 2020). However, subjective visual
judgement of lower limb kinematics result in an inaccurate estimation of joint angles (Krosshaug et al.,
2007), given that the resolution of visual observation is imprecise to identify the targeted motion of RD
athletes. Therefore, a high-resolution objective measure such as the motion capture system combined
with the dynamic surface EMG assessment was speculated to be ideal for an accurate quantification of
the athlete’s spatiotemporal running patterns (Ahmad et al., 2018; Karp and Alter, 2017).

With respect to motion analysis, it is crucial to justify what an ‘abnormal’ running pattern is. Given that
movement patterns of RD patients are highly individualistic and stereotyped, we performed detailed,
athlete-specific motion capture evaluation characterizing involved-uninvolved limb asymmetry that would
define abnormal limb control. To that end, the aim of our study was to clarify spatiotemporal joint
kinematics and dynamic surface EMG patterns of lower limb muscles to pin-point symptom origin and
explore whether the side-to-side limb asymmetry was localized only at the ankles. To define these
changes within this athlete, we employed a sensitive statistical technique known as one-dimensional
statistical parametric mapping (SPM) (Pataky et al., 2013) to explore the spatiotemporal asymmetries of
truncal and lower limb kinematics and their associated EMG patterns during cyclic walking and running
conditions. We hypothesized that the SPM comparison between affected and unaffected lower limbs as
well as pelvic movement in running would reveal abnormal kinematic and EMG patterns to characterize
the dystonic features in this runner.

Method
Ethical considerations
This study was approved by the ethics review board of Osaka University Hospital (14250). A written
informed consent was obtained from the athlete before data collection. A consent for publication was
also obtained from this athlete.
Preparation for motion analysis
The motion-capture analysis for the athlete was performed two years and four months after the first
diagnosis of RD at Osaka University. The athlete wore a black-colored spandex shirt and pants with her
own running shoes (Tarther Japan Black 1013A007, ASICS, Japan). Forty reflective markers were
                                                   Page 3/19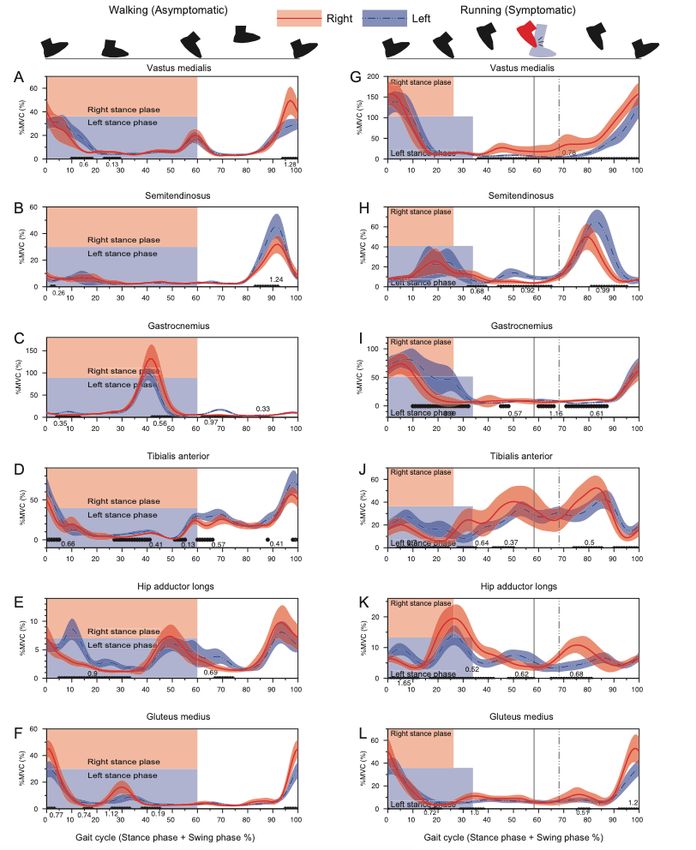
attached on the body landmarks (Table. 1) and four marker-cluster plates with three reflective makers on
each were placed on both side thigh and shank segments for the optical motion analysis. After skin
preparation, the wireless surface EMG sensors (Trigno Avanti system, Delsys, Inc., US) were fixed to
vastus medialis (VM), semitendinosus (ST), gluteus medius (GM), hip adductor longus (HAL), tibialis
anterior (TA), and lateral head of gastrocnemius (GC) of both legs. The sensors were firmly covered with
the elastic tape to minimize movement artefacts. To protect the damage of foot collision, the posterior
aspect of left calf was covered with the elastic tape. The athlete wore safety harness to prevent falling.
We ascertained that the harness did not impede her locomotion. The static posture trial was captured
with full maker set calibration and then some markers (see Table 1) were removed before treadmill trials.

                                                  Page 4/19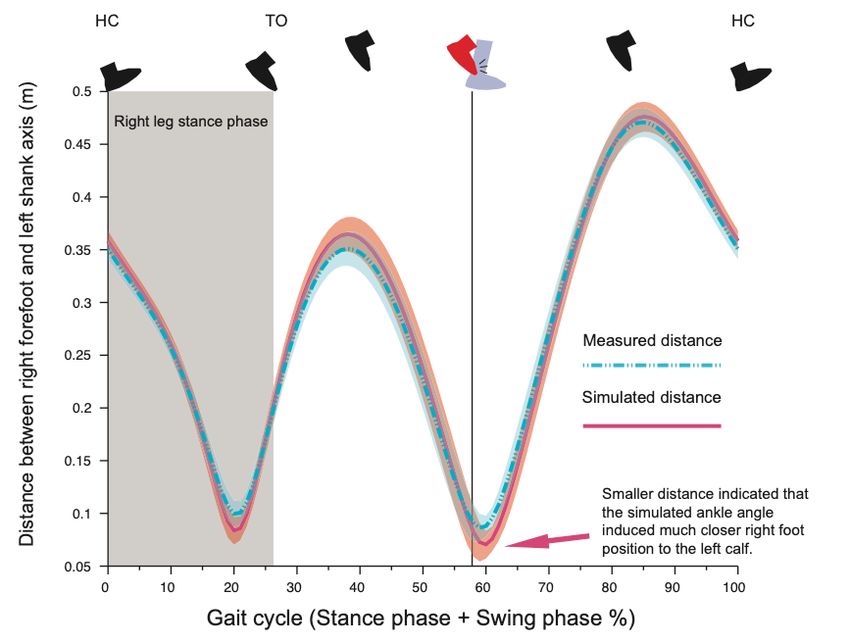
Table 1
                                         Maker name and position
 Marker         Side      Position                                                              Remove
 Name

 TOE            Both      Anterior tip of shoe sole, 1 cm above from shoe sole surface.

 MMP            Both      Aiming at the head of 1st metatarsal bone on the shoe.                *

 LMP            Both      Aiming at the head of 5th metatarsal bone on the shoe.

 FBC            Both      Aiming at base of 3rd metatarsal bone on the shoe.

 CAL            Both      Most posterior edge of shoe heel wedge, 1 cm above shoe sole
                          surface.

 MAKL           Both      Most prominent point of medial malleolus.                             *

 LAKL           Both      Most prominent point of lateral malleolus.

 MKNEE          Both      Most prominent point of medial femoral epicondyle.                    *

 LKNEE          Both      Most prominent point of lateral femoral epicondyle.

 TTB            Both      On the mid of tibial tuberosity.

 ATH            Both      Anterior aspect of thigh segment, approximately mid-way of hip
                          and knee joint.

 GT             Both      Most laterally prominent point of great trochanter.

 ASIS           Both      Most prominent point of anterior superior iliac spine.

 PSIS           Both      Most prominent point of posterior superior iliac spine.

 SCRM           Center    On the mid of sacrum.

 STRN           Center    On the top edge of sternum.

 C7             Center    Most prominent point of 7th cervical spinous process.

 SHD            Both      Most prominent point of acromion process.

 ELB            Both      Most prominent point of the lateral humeral epicondyle.

 WRIST          Both      Most prominent point of the ulnar styloid process.

 HND            Both      On the head of 3rd metacarpal bone.

 HEAD           Center    Tip of head.

Remove * - Markers were removed after static calibration trial since those markers were potentially
problematic due to foot collision symptom. The position of removed marker was reconstructed by
information of marker clusters or other markers on the same segment.
Treadmill walking and running trial
                                                  Page 5/19
The athlete was asked to perform a walking to running task on the electric treadmill (MYRUN model:
DCKN1B, Technogym S.p.A, Italy). A total of 6 trials were performed. Each trial lasted approx 2.5 min
long. The athlete initially took a static pose on the treadmill, then gradually increased the speed of the
treadmill to 6.0 km/h by herself and performed fast walking for about 50 steps. When cued by the
experimenter, the athlete started to run at the same speed and performed another 60 running steps. The
running speed of 6.0 km/h was the lowest speed to induce her symptom. To measure the athlete's natural
performance, no specific instructions were given on how to walk and run. The athlete was allowed to stop
running at any time she felt sustained running would be injurious.
Data collection
The 3D positions of the body markers were captured with the 12 optical cameras (OptiTrack Prime 17W,
Software: Motive version 1.9, NaturalPoint, Inc., US.) with a sampling frequency of 360 Hz. The EMG
signals from the selected muscles were sampled at 2,000 Hz with the Delsys Trigno Avanti sensors and
measured using LabChart version 8.0.9 (ADInstruments, US.). A clock device (eSync2, NaturalPoint, Inc.,
US) was used to synchronize the OptiTrack and LabChart. For off-line visual inspection, video recordings
from the rear and on the right-side of the athlete were taped (HDR-PJ800, 30 fps, SONY, Japan). The EMG
signal during the maximum voluntary contraction (MVC) test (2 repetitions of 2 s MVC for each muscle
with intensive verbal encouragement) was collected for off-line signal normalization.
Data analysis and assessment variables
Off-line data analysis was performed with custom scripts written in Scilab 6.01 (ESI Group, France). The
motion capture data were smoothed with the 2nd order Butterworth digital filter (low-pass, zero-lag,
cutoff-frequency of 10 Hz). Since the athlete was a typical heel-first contact runner, the timing of heel
contact (HC) was identified as the local minimums observed in the vertical component of the heel marker
“CAL”. The timing of toe-off (TO) was judged when the first increase of vertical component of the toe-
marker “TOE” appeared after HC. One gait cycle was defined as the period from the previous HC to the
next HC for each leg. Data for one gait cycle was normalized to 101 data points (0—100%). One gait cycle
was consisted of the stance-phase (HC to TO) followed by the swing-phase (TO to the next HC).
The 7-link kinematic model, consisting of both feet, shanks, thighs, and one pelvis segment, was
constructed using the time-normalized marker data. The local coordinate system was defined for each
segment. For the kinematic assessment of athlete movement, hip adduction(+)/abduction(-), hip
flexion(+)/extension(-), hip internal(+)/external(-) rotation, knee flexion(+)/extension(-), ankle
adduction(+)/abduction(-), and ankle dorsi(+)/planter(-) flexion were calculated as time-series kinematic
variables. To evaluate the contralateral pelvis-drop at the stance-phase, we calculated the local minimum
of the vertical component of both-side ASIS markers during one gait cycle (the lowest value occurred in
one gait cycle) was determined and was offset with the static trial. To visualize the three-dimensional
(3D) foot trajectory relative to the pelvis segment, the position vector going from the center of pelvis
segment (mid-point of 2 ASIS and 2 PSIS markers) to the center of foot segment (FBC marker) was
calculated and expressed with the pelvis coordinate system. To quantify the severity of right-foot collision
Page 6/19to the left calf, the distance from the right-foot’s FBC marker and the left shank segment (e.g., foot-calf distance) was calculated based on the measured marker data. The simulated foot-calf distance was also calculated assuming that the right-ankle position was maintained appropriately with respect to the left- ankle position (assuming that there was no side-to-side difference in the ankle position). EMG signals during trials were high-pass filtered (5 Hz), full-wave rectified, and low-pass filtered (10 Hz) with 2nd order zero-lag Butterworth digital filter to obtain enveloped signals. The same procedure was applied to the MVC trials and the peak MVC value were detected for each muscle. EMG signals during trials were normalized to the peak MVC values (%MVC). Single gait/running cycle EMG data were also time normalized to 101 data points synchronizing with motion capture data. Statistical analysis To assess the side-to-side difference of the stance-phase and one gait cycle durations, paired t-test was conducted (p
Gait cycle temporal asymmetry
In walking, the time required for one gait cycle was 0.88s (SD 0.01) for right and 0.88s (SD 0.01) for left-
leg of which the stance-phase was 0.51s (0.00) for right and 0.52s (0.01) for left-leg, showing no
statistical significance (Fig. 3). In running, although the time taken for one gait cycle did not differ
between limbs (0.71s [SD 0.01] vs 0.71s [SD 0.01], p>0.05), the stance-phase of right-leg was significantly
shorter than that of left-leg (0.18s [SD 0.02] vs 0.24s [SD 0.02], p
the stance-phase finished. Right GC activity was significantly smaller than that of left GC especially at the
later part (push-off timing) of stance-phase (Fig. 6I).

The right TA showed a significantly greater activity from 30 to 50 % of gait cycle as compared to the left
TA (Fig. 6J). This time duration corresponded to the duration where the less planer-flexed right ankle was
observed (Fig. 4H).

A prominent increase of hip adductor muscle was observed at the stance-to-swing transition phase
(around 20 to 40 % of gait cycle) for both limbs, but the activity for the right hip adductor muscle was
significantly greater than that of the left hip. The right hip adductor activation again increased around 65
to 85 % with a significant difference relative to left hip adductor (Fig. 6K). Gluteus Medius (GM) activity
exhibited a prominent increase toward the heel contact for both limbs. Although right GM activity was
significantly greater than that of left GM, right hip showed a significantly greater hip adduction than that
of left hip around the HC phase (Fig. 6L, Fig. 2A, B).

Discussion
This is the first detailed attempt to quantify the spatiotemporal characteristics of an elite athlete with RD
via advanced time-series analysis using motion capture and EMG data. This athlete presented with right-
foot collision with the left-calf during right-leg swing-phase. However, side-to-side differences were not
limited only to the ankle, but was observed throughout the leg. Her lower limb kinematics revealed that
there was an asymmetric left pelvic-drop synchronized with an increased right-hip adductor burst,
resulting in a medially-shifted right-leg trajectory enough to interfere the contralateral left-leg space (Fig. 1
—4). These findings allowed us to contemplate that the right foot collision was a secondary phenomenon
to abnormal pelvis and hip motor control.

One likely explanation of the foot collision being a secondary phenomenon to the abnormal pelvis and
hip control was that the right ankle position (abducted and dorsiflexed than left ankle) prior to the foot
collision was a voluntary avoidance strategy rather than an involuntary abnormal movement. Our
findings were supported by the results of kinematic simulation analysis which illustrated that the
abducted and dorsiflexed right-foot position contributed significantly to widen the distance between the
right-foot and left-leg (Fig. 5).

The isolated right TA activity increasing systematically prior to foot collision (30 – 50% of cycle) without
remarkable GC co-activity was suggestive of a non-dystonic type of movement (Fig. 6). Prior reports of
focal ankle dystonia have shown involuntary co-contraction of agonist-antagonist muscle pair (Ahmad et
al., 2018), but in this case, since no such involuntary co-contraction of ankle muscles were observed
(Fig. 6). The increased right TA activity appearing before foot collision may be an anticipatory muscle
activity to configure the dorsiflexed ankle position and widen the distance between the right-foot and left-
calf. Therefore, we believe that the right TA-GC contraction pattern found around foot collision phase also
clarifies that the ankle collision was possibly a secondary phenomenon.

                                                    Page 9/19
Acute, involuntary presentation of symptoms, occurring only during running, and its absence during
walking normally, or walking sideways or backwards, clinically fit to those with distal ankle dystonia.
However, with our current interpretation, we believe this attribute to be a type of segmental dystonia in the
truncal and proximal lower limb. In this case, though the symptoms shared several similarities with FTSD
at the ankle, the measured kinematic and EMG pattern were quite specific to this athlete. A similar case
was reported by Ahmad et al. in a 56-year-old elite male runner with a four-year history of involuntary
movement in his left limb during running (Ahmad et al., 2018). Some commonalities observed with our
case were: 1) an early shift of gait cycle associated with a shorter stance duration in affected limb, and 2)
left forefoot scraping the medial aspect of the right ankle. The authors suspected the ankle inversion was
due to left foot collision with the right ankle, although motion capture assessment revealed that an
excessive hip adduction induced the collision between the distal segments. However, the tonic co-
contraction observed between TA and GC by these authors were notably absent within our athlete. Ahmad
et al, (2018) also reported a truncal dystonia— a 58-year-old man with 10-year history of long-distance
running who exhibited the bilateral posterior pelvic tilt and upward obliquity on the right pelvis, resulting
in an abnormal forward and rightward flexion of the trunk (Ahmad et al., 2018). Whereas these cases
were comparable to some extent with respect to abnormal truncal or pelvis control, their posture
abnormalities were tonic which were considerably different wherein our athlete demonstrated phasic
asymmetrical pelvic drop during the right-leg stance-phase. We believe our findings is a worthwhile
addition of an uncommon variant of RD symptoms to the knowledge base of task specific dystonia.
Limitation
As per literature, the diagnosis of RD should be based on a synthesis of detailed history taking and
comprehensive neurological tests, often supported by laboratory data and medical imaging. This study
demonstrated the usefulness of additional kinematic and electromyographic assessment. Despite its
impact, motion capture system combined with EMG are not necessarily a convenient tool in daily clinical
practice because of its significant cost burden in terms of equipment and data analysis. In addition, the
measurement method itself is not for diagnosis but merely for biomechanical inference of cause-effect
relationships between different muscle elements within the whole-body kinematic chain. Therefore, every
effort should be made to increase the practical convenience of such systems.
Conclusion
This study assessed the kinematic and electromyographic characteristics of a unique RD case. Although
the main complaint was that of right foot’s collision with the left-leg during the right-leg swing-phase,
motion capture assessment suggested that this foot collision may not have originated from the ankle but
due to an impaired control mechanism of the right hip and pelvis segment. The multimodal evaluation
procedure enabled us to precisely characterize the symptomatology and is therefore a crucial modality
for a deeper understanding of the pathogenesis and characteristics of RD.
Page 10/19Declarations
Conflict of Interest
The authors declare there was no conflict of interest.
Ethical Approval
The study was conducted according to the guidelines of the Declaration of Helsinki and approved by the
Institutional Ethics Committee of the Osaka University Hospital (14250).
Funding
This work was supported by the Sports Research Innovation Project (SRIP) grant, sponsored by the Japan
Sports Agency.
Consent for publication
Informed consent for publication was obtained from the athlete involved in the study.
Data availability
None.
Acknowledgement
We would like to thank Ms. Chen Shuo for a great assistance in data collection.
Author contribution
I.O., N.H., and G.S.R. conceptualized and designed the study.
N.H., H.M., and K.N. provided medical consultations.
I.O., N.H., Y.U., and T.N. organized the experiments.
I.O., N.H., Y.U., Y.K., and T.N. performed the experiments and data collection.
I.O., N.H., S.K., and G.S.R. analyzed the data and performed the statistical analysis.
I.O., N.H., and G.S.R. wrote the manuscript.
I.O., N.H., G.S.R., S.K., Y.U., T.N., Y.K., H.M., and K.N. reviewed the manuscript, suggested corrections and
approved its final version.
References
Page 11/19Ahmad, O.F., Ghosh, P., Stanley, C., Karp, B., Hallett, M., Lungu, C., Alter, K., 2018. Electromyographic and
Joint Kinematic Patterns in Runner’s Dystonia. Toxins 10, 166. https://doi.org/10.3390/toxins10040166
Frucht, S.J., 2004. Focal task-specific dystonia in musicians. Adv Neurol 94, 225–30.
Goldman, J.G., 2015. Writer’s cramp. Toxicon 107, 98–104.
https://doi.org/10.1016/j.toxicon.2015.09.024
Karp, B.I., Alter, K., 2017. Muscle Selection for Focal Limb Dystonia. Toxins 10, 20.
https://doi.org/10.3390/toxins10010020
Krosshaug, T., Nakamae, A., Boden, B., Engebretsen, L., Smith, G., Slauterbeck, J., Hewett, T.E., Bahr, R.,
2007. Estimating 3D joint kinematics from video sequences of running and cutting maneuvers—
assessing the accuracy of simple visual inspection. Gait Posture 26, 378–385.
https://doi.org/10.1016/j.gaitpost.2006.10.010
Lee, J.H., Kim, H.J., Park, D.G., Yoon, J.H., 2021. A novel task-specific dystonia: running-induced cervical
dystonia in a triathlete. Neurol Sci 1–2. https://doi.org/10.1007/s10072-021-05224-z
Leveille, L.A., Clement, D.B., 2008. Case Report: Action-Induced Focal Dystonia in Long Distance Runners.
Clin J Sport Med 18, 467–468. https://doi.org/10.1097/jsm.0b013e3181845f35
McClinton, S., Heiderscheit, B., 2012. Diagnosis of Primary Task-Specific Lower Extremity Dystonia in a
Runner. J Orthop Sport Phys 42, 688–697. https://doi.org/10.2519/jospt.2012.3892
Pataky, T.C., Robinson, M.A., Vanrenterghem, J., 2013. Vector field statistical analysis of kinematic and
force trajectories. J Biomech 46, 2394 2401. https://doi.org/10.1016/j.jbiomech.2013.07.031
Ramdhani, R.A., Frucht, S.J., 2013. Adult-onset Idiopathic Focal Lower Extremity Dystonia: A Rare Task-
Specific Dystonia. Tremor Other Hyperkinetic Movements 3, 03. https://doi.org/10.5334/tohm.135
Robinson, M.A., Donnelly, C.J., Tsao, J., Vanrenterghem, J., 2014. Impact of Knee Modeling Approach on
Indicators and Classification of Anterior Cruciate Ligament Injury Risk. Medicine Sci Sports Exerc 46,
1269–1276. https://doi.org/10.1249/mss.0000000000000236
Schneider, S.A., Edwards, M.J., Grill, S.E., Goldstein, S., Kanchana, S., Quinn, N.P., Bhatia, K.P., Hallett, M.,
Reich, S.G., 2006. Adult-onset primary lower limb dystonia. Movement Disord 21, 767–771.
https://doi.org/10.1002/mds.20794
Stahl, C.M., Frucht, S.J., 2017. Focal task specific dystonia: a review and update. J Neurol 264, 1536–
1541. https://doi.org/10.1007/s00415-016-8373-z
Stan, A., Gherghel, N., Muresanu, D.F., 2020. Adult-onset idiopathic lower-extremity dystonia: A rare task-
specific dystonia. Clin Neurol Neurosur 198, 106106. https://doi.org/10.1016/j.clineuro.2020.106106
Page 12/19Suzuki, K., Izawa, N., Aiba, S., Hashimoto, K., Hirata, K., Nakamura, T., 2011. Interoceptive sensory trick for
runner’s dystonia. Movement Disord 26, 758–760. https://doi.org/10.1002/mds.23440
Wu, L.J.C., Jankovic, J., 2006. Runner s dystonia. Journal of the Neurological Sciences 251, 73–76.
https://doi.org/10.1016/j.jns.2006.09.003
Figures
Figure 1
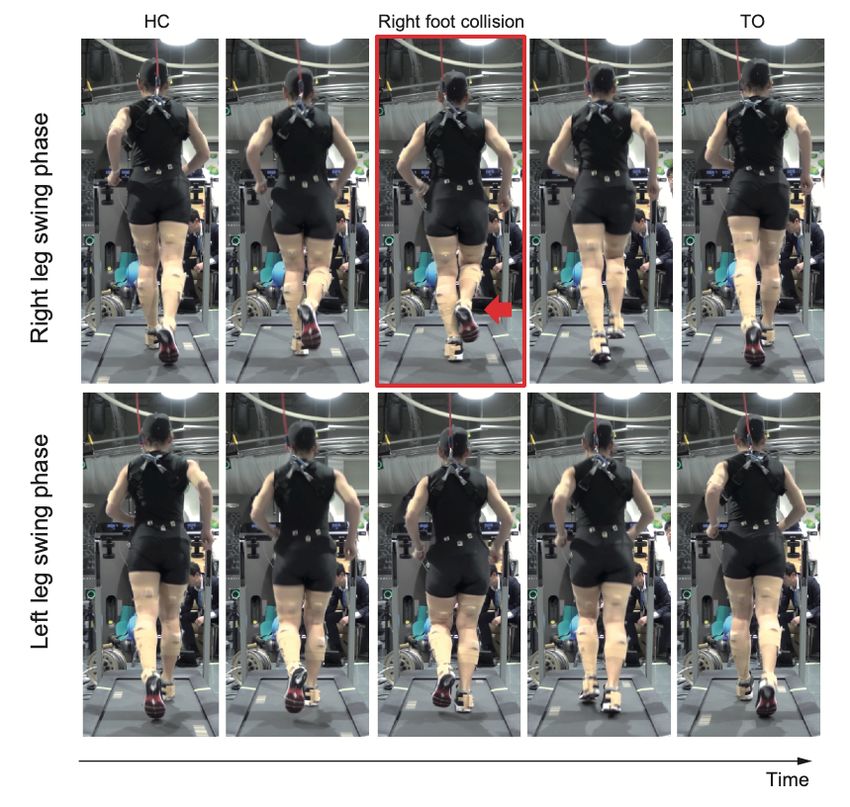
Page 13/19Rear view of the running movement. Upper row shows right leg swing-phase, and lower row shows left leg
swing-phase. Red-squared panel shows right foot collision with the left calf.
Figure 2
Prominent left pelvis-drop observed during right-leg stance-phase (A). The temporal change of the ASIS
markers height illustrated that left pelvis-drop only occurred during right-leg stance-phase of running (B).
The top view of 3D trajectory of foot segment with respect to the pelvis coordinate system showed that
right foot trajectory medially shifted and impinged with left-leg area. The left-leg in-turn circumducted to
escape from right foot interference (C).
Page 14/19Figure 3
Duration of one gait cycle (HC to HC interval) and stance-phase (HC to TO interval) from an illustrative
trial. The stance-phase duration for right-leg during running was significantly shorter than that of left-leg.
HC: heel contact, TO: toe off.
Page 15/19Figure 4
Results of kinematic analysis during walking (left column) and running (right column) assessed by 1D
SPM. Black lines with the Cohen’s d value at the horizontal axis of each panel showed significant
difference between the right and left-leg. Vertical lines denote the timing of foot collision for right-leg
(solid line) and for left-leg (dashed line). Note that the percentage of the stance-phase and the foot
Page 16/19collision time were different between the right and left-leg in 100% gait cycle representation since the
absolute stance-phase duration was significantly different between limbs (as shown in Fig.3)
Figure 5
Temporal pattern of the distance between right forefoot (marker FBC) to the left shank segment. If the
right ankle was adducted by 7 degrees and plantarflexed by 10 degrees from the observed ankle position
as that of left ankle, the distance between right foot and left shank was much closer, suggesting the right
ankle position observed in this trial was a collision-avoiding strategy.
Page 17/19Figure 6
Results of EMG analysis during walking (left column) and running (right column) assessed by 1D-SPM.
The black lines with the Cohen’s d value at the horizontal axis of each panel showed significant
differences between the right and left-leg. Vertical lines denote the timing of foot collision for right leg
(solid line) and for left leg (dashed line). Note that the percentage of the stance-phase and the foot
Page 18/19collision time were different between the right and left-leg in 100% gait cycle representation since the
absolute stance-phase duration was significantly different between limbs (Fig.3)
Page 19/19You can also read