Sydney Impact Report Residential Development Market - Preston Rowe Paterson

Page created by Roy James
 
CONTINUE READING
Sydney Impact Report Residential Development Market - Preston Rowe Paterson
Sydney Impact Report
                                 Residential Development Market

 First Half 2017
 HIGHLIGHTS                                                                                                     INSIDE THIS ISSUE:

        Total building approvals for the Greater Sydney area declined by 19% over the month to May 2017,
                                                                                                                Residential LGA Zones       2
         from 4,171 approvals in April to 3,375 approvals in May.
        Median house price in Sydney increased by 3.4% over three months, to $1,167,000. median unit           Residential Market          3
         prices increased by 2.8% overall over the quarter to $742,000.
                                                                                                                Residential Development
        When we look at Sydney’s residential vacancy rate, the increase in stock entering the Inner Sydney                                 5
                                                                                                                Supply
         market has meant that availability has increased whilst tenants take time to fill accommodation.
                                                                                                                Economic Fundamentals       7
        According to BCI Australia, approximately 48,000 new apartments will enter the Sydney metropolitan
         area by end of 2020. The total estimated value of these new dwellings with come close to $22 billion   About Preston Rowe Pater-
                                                                                                                                            10
                                                                                                                son
         upon completion.
                                                                                                                Contact Us                  12

Phone: +61 2 9292 7400
                                                                                                                                            1
Fax: +61 2 9292 7404
Address: Level 14, 347 Kent Street Sydney NSW 2000
Email: research@prpsydney.com.au
Follow us: Visit www.prpsydney.com.au
© Copyright Preston Rowe Paterson NSW Pty Limited
Sydney Impact Report Residential Development Market - Preston Rowe Paterson
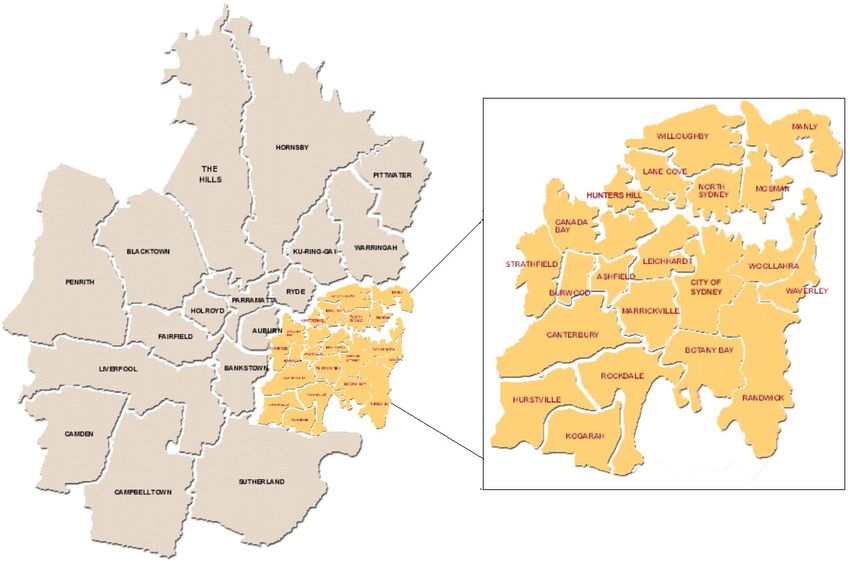
RESIDENTIAL LGA ZONES

 According to the Real Estate Institute of Australia, the local government areas (LGAs) in the Sydney’s Statistical Division will be divided up into three
 geographical rings being inner, middle and outer. The LGAs included in each geographical ring are listed below.

 Inner Sydney

        Ashfield, Botany Bay, Lane Cove, Leichhardt, Marrickville, Mosman, North Sydney, Randwick, Sydney City [South Sydney merged since 2004],
         Waverly, Willoughby and Woollahra.
        According to the Australian Bureau of Statistics (ABS), the Inner Sydney total population in 2015 is estimated to be 932,747, whereby the Sydney
         City LGA assumes the largest population at 205,339 persons.

 Middle Sydney

        Auburn, Bankstown, Burwood, Canada Bay, Canterbury, Hunters Hill, Hurstville, Kogarah, Ku-ring-gai, Manly, Parramatta, Rockdale, Ryde and
         Strathfield.
        According to the ABS, the Middle Sydney total population in 2015 is estimated to be 1,360,442. The Bankstown LGA assumes the total population at
         203,202 persons.

 Outer Sydney

        Blacktown, Camden, Campbelltown, Fairfield, Hawkesbury, The Hills, Holroyd, Hornsby, Liverpool, Penrith, Pittwater, Southerland and Warringah.
        According to the ABS, the Outer Sydney total population in 2015 is estimated to be 2,166,806. The Blacktown LGA has the highest recorded
         population over all other Sydney LGAs with 339,328 persons.

        Sydney metropolitan LGA boundaries – Source - Division of Local Government

Phone: +61 2 9292 7400
Fax: +61 2 9292 7404
Address: Level 14, 347 Kent Street Sydney NSW 2000
                                                                                                                                                          2
Email: research@prpsydney.com.au
Follow us: Visit www.prpsydney.com.au                                                                                                                         2
© Copyright Preston Rowe Paterson NSW Pty Limited
Sydney Impact Report Residential Development Market - Preston Rowe Paterson
RESIDENTIAL MARKET                                                                                                                 Market Affordability

Building Approvals                                                                                                                 The Real Estate Institute of Australia’s March quarter report indicate that

Statistics from the Australian Bureau of Statistics indicate that total building                                                   median house price in Sydney increased by 3.4% over three months, to a

approvals for the Greater Sydney area declines by 19% over the month to                                                            median house price of $1,167,000. This figure indicates an annual change

May 2017, from 4,171 approvals in April to 3,375 approvals in May. May’s                                                           of 16.5%. When we look at Inner Sydney, median price increased by 7.8%

figure indicate that total approval for construction had declined by 38%                                                           over the quarter, to $2,075,000. There were 1,017 sales over the period,

when we compare it to twelve months prior. The total number of approvals                                                           with sale prices ranging from $1,574,000 to $2,800,000. Middle Sydney’s

to date amounts to 19,993 approvals, which comprise of 6,832 approvals for                                                         house price increased by 3.1% over the quarter, to $1,371,000. There were

houses and 13,161 approvals for other dwellings.                                                                                   2,344 sales, of which sale prices ranged from $970,000 to $2,000,000.

                                                                                                                                   Outer Sydney experienced no change in their median house price, which

Greater Sydney’s house building approvals experienced an increase of 42%                                                           remained at $770,000. The region recorded strong sales numbers, with

over the month to May, which lifted total housing construction approvals to                                                        7,628 sales over the quarter and sales prices ranging from $620,000 and

1,632. However, when we compare this figure to twelve months prior, total                                                          $1,055,000.

approval for housing construction had declined by 13%. Total number of                                                                              $2,200,000                                                                               9.0%

                                                                                                                                                    $2,000,000                                                                               8.0%

dwellings other than houses approved for construction during May declined                                                                           $1,800,000
                                                                                                                                                                                                                                             7.0%
                                                                                                                                                    $1,600,000

                                                                                                                                                                                                                                                    Quarterly Percentage Change (%)
                                                                                                                                                                                                                                             6.0%
                                                                                                                                                    $1,400,000
by 42% over the month, down to 1,743 approvals. This figure indicates a
                                                                                                                                     Median Price

                                                                                                                                                    $1,200,000                                                                               5.0%

                                                                                                                                                    $1,000,000                                                                               4.0%
drop of 51% when compared to twelve months prior.
                                                                                                                                                      $800,000
                                                                                                                                                                                                                                             3.0%
                                                                                                                                                      $600,000
                                                                                                                                                                                                                                             2.0%
                                                                                                                                                      $400,000

                                                                                                                                                      $200,000                                                                               1.0%
The figures from May follow tighter lending restrictions that were imposed                                                                                  $0                                                                               0.0%
                                                                                                                                                                               Inner                          Middle                 Outer
                                                                                                                                                                                         Median House Price     Quarterly % Change
on banks by APRA back in March 2017. Interest-only lending were capped                                                                              Source: REIA/ Preston Rowe Paterson Research

                                                                                                                                   Chart 2 – Median House Price by Zone – Source REIA
by the regulators, which have limited lenders to now only be able to lend out

the higher risk interest-only loans to 30 percent of their new residential                                                         When we look at the sales of other dwellings in Sydney, prices increased by

mortgages.                                                                                                                         2.8% overall over the quarter, to $742,000. This figure indicates a change of

                        70,000
                                                                                                                                   10% over the year. Inner Sydney experienced an increase of 2.9%, to

                        60,000                                                                                                     $920,900 for the March quarter. There were 2,272 sales in this region, with
                        50,000
                                                                                                                                   sale prices ranging from $718,000 and $1,230,000. Middle Sydney’s median
   Dwelling Approvals

                        40,000

                                                                                                                                   sale price increased by 1.0%, to $692,000. There were 2,477 sales over the
                        30,000

                                                                                                                                   quarter, with sale prices ranging from $575,000 and $840,000. Outer
                        20,000

                        10,000                                                                                                     Sydney experienced an increase of 0.8% in their median sale prices over
                            -
                                 2004   2005   2006   2007   2008   2009   2010   2011   2012   2013   2014   2015   2016   YTD    the quarter, to $770,000. There were 7,628 sales recorded in this region,
                                                                                                                            2017
 Source: ABS / Preston Rowe Paterson Research                  Sydney SD Houses    Sydney Non House
                                                                                                                                   with sale prices ranging from $620,000 and $785,000.
Chart 1 – Sydney SD Dwelling Approvals—Source ABS

 Phone: +61 2 9292 7400
 Fax: +61 2 9292 7404
 Address: Level 14, 347 Kent Street Sydney NSW 2000
                                                                                                                                                                                                                                                                3
 Email: research@prpsydney.com.au
 Follow us: Visit www.prpsydney.com.au                                                                                                                                                                                                                                                3
 © Copyright Preston Rowe Paterson NSW Pty Limited
Sydney Impact Report Residential Development Market - Preston Rowe Paterson
$1,000,000
                  $950,000
                                                                                                                                              6%
                                                                                                                                                                                     experienced a decline of -3.8% for the quarter, down to $272.50. When we
                  $900,000
                  $850,000                                                                                                                    5%
                  $800,000                                                                                                                                                           look at 2 bedroom dwellings, median weekly rent increased by 2.3%, to

                                                                                                                                                   Quarterly Percentage Change (%)
                  $750,000
                  $700,000                                                                                                                    4%
                  $650,000
                                                                                                                                                                                     $440.
Median Price

                  $600,000
                  $550,000                                                                                                                    3%
                  $500,000                                                                                                                                                                                 $800
                  $450,000
                  $400,000                                                                                                                    2%
                                                                                                                                                                                                           $700
                  $350,000
                  $300,000
                  $250,000                                                                                                                    1%                                                           $600
                  $200,000
                  $150,000                                                                                                                                                                                 $500

                                                                                                                                                                                     Median Weekly Rent
                  $100,000                                                                                                                    0%
                                                         Inner                                Middle                          Outer
                                                                                                                                                                                                           $400
                                                                     Median Other Dwelling Price         Quarterly % Change
                 Source: REIA/ Preston Rowe Paterson Research
                                                                                                                                                                                                           $300

Chart 3 – Median Price for Other Dwellings by Zone – Source REIA                                                                                                                                           $200

                                                                                                                                                                                                           $100

Rental Market                                                                                                                                                                                                   $0
                                                                                                                                                                                                                                       Inner                               Middle                               Outer
                                                                                                                                                                                                                                                     1 Bed Unit              2 Bed Unit
                                                                                                                                                                                                          Source: REIA/ Preston Rowe Paterson Research

Over the March Quarter, Sydney experienced moderate changes in their
                                                                                                                                                                                     Chart 5 – Sydney Median Weekly Rents for Other Dwellings by Zone – Source REIA

house rents, with the highest increase stemming from Middle Sydney’s 2
                                                                                                                                                                                     Residential Vacancy Rates
bedroom houses. Median rent per week increased by 5.1% to $520. 2
                                                                                                                                                                                     When we look at Sydney’s residential vacancy rate over the month to June
bedroom houses in Inner Sydney and 3 bedroom houses in Middle Sydney
                                                                                                                                                                                     2017, we can see a turn in Sydney’s rental market, with availability at its
both experienced increases, of 1.4% and 0.8% over the quarter,
                                                                                                                                                                                     highest level in nearly two years. Real Estate Institute of New South Wales’s
respectively. Inner Sydney’s 3 bedroom house rents remain unchanged at
                                                                                                                                                                                     Vacancy Rate survey indicates that the vacancy in the Sydney metropolitan
$900, whilst Outer Sydney’s 2 and 3 bedroom houses remain unchanged at
                                                                                                                                                                                     area remains unchanged over the month at 1.8%. Inner Sydney experienced
$380 and $450, respectively.
                                                                                                                                                                                     a strong increase over the month, with vacancy increasing by 0.3% to 2.2%

                                                                                                                                                                                     for the month of June. The president of REINSW, John Cunningham, stated
                                     $1,000

                                      $900
                                                                                                                                                                                     that the increase in stock entering the Inner Sydney market has meant that
                                      $800

                                      $700
                                                                                                                                                                                     availability has increased whilst tenants take time to fill available
                                      $600
                Median Weekly Rent

                                      $500
                                                                                                                                                                                     accommodation. Vacancy rates for Middle and Outer Sydney declined by -
                                      $400

                                      $300

                                      $200
                                                                                                                                                                                     0.2% and -0.1%, respectively, over the month to June. Middle Sydney’s
                                      $100

                                        $0
                                                                                                                                                                                     vacancy rate stands at 1.4%, whilst Outer Sydney vacancy stands at 1.7%.
                                                             Inner                                     Middle                         Outer
                                                                                2 Bed House               3 Bed House
                                     Source: REIA/ Preston Rowe Paterson Research

Chart 4 – Sydney Median Weekly Rents for House by Zone – Source REIA                                                                                                                                      2.4

                                                                                                                                                                                                          2.2

Mixed changes in median rent were recorded for other dwellings in Sydney.                                                                                                                                   2
                                                                                                                                                                                      Vacancy Rate (%)

Inner Sydney’s 1 and 2 bedroom recorded a change of 1.9% and -0.7%,                                                                                                                                       1.8

                                                                                                                                                                                                          1.6

respectively. Their respective rents moved to $550 and $685 per week.                                                                                                                                     1.4

When we look at Middle Sydney, 1 and 2 bedroom dwellings recorded                                                                                                                                         1.2
                                                                                                                                                                                                                                                                               Inner      Middle      Outer      Sydney Total

                                                                                                                                                                                                            1
                                                                                                                                                                                                                     Jun-16   Jul-16   Aug-16   Sep-16   Oct-16   Nov-16   Dec-16   Jan-17   Feb-17   Mar-17   Apr-17   May-17   Jun-17
increases of 2.2% and 2.0%, respectively. Their respective rents increased
                                                                                                                                                                                           Source: REINSW/ Preston Rowe Paterson Research

to $470 and $510. When we look at Outer Sydney, 1 bedroom dwellings                                                                                                                          Chart 6 – Sydney Vacancy Rates – Source REINSW

 Phone: +61 2 9292 7400
 Fax: +61 2 9292 7404
 Address: Level 14, 347 Kent Street Sydney NSW 2000
                                                                                                                                                                                                                                                                                                                                  4
 Email: research@prpsydney.com.au
 Follow us: Visit www.prpsydney.com.au                                                                                                                                                                                                                                                                                                4
 © Copyright Preston Rowe Paterson NSW Pty Limited
Sydney Impact Report Residential Development Market - Preston Rowe Paterson
RESIDENTIAL DEVELOPMENT SUPPLY                                                                                  $1,200
                                                                                                                                                                                                 Source: REIA/ PRP Research
                                                                                                                                                                                                                                  2,500

                                                                                                                $1,000
                                                                                                                                                                                                                                  2,000
Analysis of figures from BCI Australia, approximately 48,000 new apartments

                                                                                  Estimated Value ($millions)
                                                                                                                 $800

                                                                                                                                                                                                                                                         Projected Supply
                                                                                                                                                                                                                                  1,500
and units will be entering the Sydney metropolitan area by end of 2020. The                                      $600
                                                                                                                                                                                                                                  1,000
total estimated value of these new dwellings combined with come close to                                         $400

                                                                                                                                                                                                                                  500
$22.32 billion upon completion. The majority of supply will be coming from                                       $200

Middle Sydney, with 41% of total projected supply to be completed in the                                           $-
                                                                                                                             Inner West   South Sydney   Lane Cove   North Sydney       Randwick              Waverley
                                                                                                                                                                                                                                  -

                                                                                                                                                Estimated Value      Projected Supply of Units
councils of Bayside, Burwood, Canada Bay, Canterbury-Bankstown, Ku-Ring
                                                                                  Chart 8 – Inner Sydney Residential Development Approvals -- Source—Preston
-Gai, Parramatta, Ryde and Strathfield. Outer Sydney is projected to supply       Rowe Paterson Research

38% of total supply, with the majority of construction occurring in Blacktown,        Middle Sydney
Campbelltown, Hornsby, The Hills, Liverpool and Sutherland. Inner Sydney
                                                                                      According to BCI Australia, Middle Sydney’s 73 development projects are
currently holds 21% of total projected supply of dwellings, with the majority
                                                                                      expected to be completed by the end of 2020. Around 19,700 new dwellings
being built in Sydney city, as well as in South Sydney, the Inner West, Lane
                                                                                      will be added into Middle Sydney’s residential market, with the majority
Cove, North Sydney, Randwick and Waverley.
                                                                                      being built in the Bayside area as well as in Parramatta. Completion of these

                                                                                      projects will add 1.072 million square metres of space upon completion,
Inner Sydney
                                                                                      coming to an estimated total value of $9.151 billion. Notably projects being
A total of 36 projects are currently under in the Inner Sydney region, of which
                                                                                      completed in Middle Sydney include Parramatta Square project, which will
are to all be completed by the end of 2019. According to BCI Australia, a total
                                                                                      add 700 new dwellings upon completion in 2018; Park One Sydney project,
of 10,196 units will be added onto the market, with close to 4,900 alone to be
                                                                                      which will add 400 apartments upon its completion in 2019; and Pagewood
constructed within Sydney city. The total estimated value of these
                                                                                      Green, which will add close to 3,000 new dwellings upon its completion.
developments is close to $7 billion upon completion, with an estimated

coverage of 1.078 million square metres in space. Notable projects to be
                                                                                                                $4,000.00                                                                                                     8,000
completed in Inner Sydney include Sydney’s Darling Square project, which is                                                                                                             Source: REIA/ PRP Research

                                                                                                                $3,500.00                                                                                                     7,000

projected to add 1,360 new apartments upon completion in 2020; Amara in                                         $3,000.00                                                                                                     6,000
                                                                                   Estimated Value ($million)

                                                                                                                                                                                                                                      Projected Supply

                                                                                                                $2,500.00                                                                                                     5,000

Alexandria, which is expected to add close to 200 apartments upon                                               $2,000.00                                                                                                     4,000

                                                                                                                $1,500.00                                                                                                     3,000
completion in 2019; and Central Park development site in Chippendale,
                                                                                                                $1,000.00                                                                                                     2,000

which will add 1,500 new dwellings upon completion.                                                              $500.00                                                                                                      1,000

                                                                                                                        $-                                                                                                    -

                                                                                                                                                 Estimated Value     Projected Supply of Units

                                                                                    Chart 9 – Middle Sydney Residential Development Approvals -- Source—Preston
                                                                                    Rowe Paterson Research

 Phone: +61 2 9292 7400
 Fax: +61 2 9292 7404
 Address: Level 14, 347 Kent Street Sydney NSW 2000
                                                                                                                                                                                                                                          5
 Email: research@prpsydney.com.au
 Follow us: Visit www.prpsydney.com.au                                                                                                                                                                                                                           5
 © Copyright Preston Rowe Paterson NSW Pty Limited
Outer Sydney

Figures from BCI Australia indicate that Outer Sydney is projected to welcome
                                                                                                                                                 $1,800                                                                              5,000
                                                                                                                                                                                                                                     4,500
close to 18,000 new apartments by the end of 2020. The 60 projects recorded                                                                      $1,600

                                                                                                                                                 $1,400                                                                              4,000

                                                                                                                  Estimated Value ($ millions)
have an estimated total value of close to $6.145 billion, and is expected to add                                                                 $1,200
                                                                                                                                                                                                                                     3,500

                                                                                                                                                                                                                                             Projected Supply
                                                                                                                                                                                                                                     3,000
                                                                                                                                                 $1,000
more than 930 thousand square metres of floor space into Outer Sydney’s                                                                           $800
                                                                                                                                                                                                                                     2,500
                                                                                                                                                                                                                                     2,000
                                                                                                                                                  $600
residential market. Liverpool holds the most developments to be completed,                                                                                                                                                           1,500
                                                                                                                                                  $400                                                                               1,000
with a total of 4,649 dwellings under development. Notable projects to be                                                                         $200                                                                               500
                                                                                                                                                    $-                                                                               -
completed in Outer Sydney include Sydney Olympic Park’s Pavilion, which will

supply more than 400 apartments upon completion in 2020; The Pinnacle
                                                                                                                                                                      Estimated Value            Projected Supply of Units

Liverpool, which will supply 2019; and the Woolooware Bay Precinct project,                                      Chart 10 – Outer Sydney Residential Development Approvals -- Source—Preston
                                                                                                                 Rowe Paterson Research
which will add a further 640 new apartments upon its completion.

RESIDENTIAL DEVELOPMENT SITE SALES

                                                                                                                                                                                   Site Area
                        Address                                 LGA              Vendor               Buyer                                              Date       Sale                     Proposed Dwellings                 Rate/Unit
                                                                                                                                                                                      (Ha)

3-5 Milray Street, Lindfield, NSW 2070                 Ku-Ring-Gai        Private developer   Poly Australia                                         Jan-17     $     28,000,000        0.5292                  68             $411,765.00

82 Waterloo Road, Macquarie Park, NSW 2113             Ryde               Goodman Group       Romeciti                                               Feb-17     $    120,000,000          1                     357            $336,134.00

49-51 & 55-57 Gerrale Street, Cronulla, NSW 2230       Sutherland Shire   Private owners      Privat developers                                      Feb-17     $     54,000,000        0.2921                                     N/A

Middleton Avenue, Sexton Avenue and Fishburn
                                                       The Hills Shire    Undisclosed         Private developer                                      Feb-17     $     40,000,000        0.7545                  200            $200,000.00
Crescent, Caste Hill, NSW 2154

258-264 Pennant Hills Road, Thornleigh, NSW 2120       Hornsby Shire      Undisclosed         Undisclosed                                            Mar-17     $      9,500,000        0.151                   73             $130,137.00

20-26 Cross Street, Double Bay, NSW 2028               Woollahra          Undisclosed         Roche family                                           Apr-17     $     55,000,000        0.1258                  34             $1,617,647.00

141 Allen Street, Leichhardt, NSW 2040                 Inner West         Undisclosed         Changfa                                                Apr-17     $     55,000,000        0.7149                  139            $395,683.00

                                                                                              Fortius Funds                                                                                             407 Hotel suites; 90
59 Goulbourn Street, Sydney, NSW 2000                  Sydney             Roxy Pacific                                                               May-17     $    158,000,000        2.9489                                     N/A
                                                                                              Management                                                                                                    Apartments

17-23 Mitchell Avenue & 78 Sutherland Road, Jannali,
                                                       Sutherland Shire   Undisclosed         WINIM                                                  Jun-17     $     11,250,000        0.4143                  64             $175,781.00
NSW 2226

401- 405 Illawarra Road, Marrickville, NSW 2022        Inner West         Private owners      Local developers                                       Jun-17     $      6,150,000        0.062                   21             $292,857.00

88 Christie Street, St Leonards, NSW 2065              Lane Cove          Dyldam              JQZ                                                    Jun-17     $    300,000,000         0.45                   777                N/A

 Table 1 – Development site sales in Sydney Metropolitan Area – Source: AFR/ PRP Research

Phone: +61 2 9292 7400
Fax: +61 2 9292 7404
Address: Level 14, 347 Kent Street Sydney NSW 2000
                                                                                                                                                                                                                                             6
Email: research@prpsydney.com.au
Follow us: Visit www.prpsydney.com.au                                                                                                                                                                                                                           6
© Copyright Preston Rowe Paterson NSW Pty Limited
Economic Fundamentals
Consumer Price Index                                                                                                                                                                                                                                                                                       Net Balance

                                                                                                                                                                                                                                                                                 March 2017                    April 2017                      May 2017
The June quarter Consumer Price Index (CPI) figures will not be available until 27th                                                                                                                                         Business confidence                                        7                          13                                  7
July, hence March quarter figures will be used for the following analysis. CPI increased                                                                                                                                     Business conditions                                       14                          13                                  12
by 0.5% over the March quarter, following an increase of 0.5% in the December quarter
                                                                                                                                                                                                           Table 1— Monthly Net Balance of Business confidence index and Business conditions index — Source— National
2016. The main contributor to this increase was the Housing group (+0.8% over the                                                                                                                          Australia Bank

quarter), the Transport group (+1.5% over the quarter), the Health group (+2.0%),
Education group (+3.1%) and the Alcohol and tobacco Group (+1.1%). In contrast, the                                                                                                                Consumer Sentiment
main inhibitors to further increases in CPI were the Furnishing, household equipment &
                                                                                                                                                                                                  According to the Westpac Melbourne Institute Index of Consumer Sentiment, consumers
services group (-1.0%), Recreation & culture group (-0.7%), Clothing and footwear
                                                                                                                                                                                                  over the month of June are feeling the most pessimistic since the Reserve Bank’s 2016
group (-1.4%), Communications group (-0.3%) and Food & alcoholic beverage group (-
                                                                                                                                                                                                  rate cuts. The index fell 1.8% from 98.0 in May to 96.2 in June, with a reading below 100
0.2%).
                                                                                                                                                                                                  indicating that the number of pessimists outweigh optimists in their outlook of the
Over the year to March 2017, All Groups CPI increased across all eight capital cities in
                                                                                                                                                                                                  economy. The main contributor to the results stems from the March quarter GDP figures,
Australia, with Melbourne and Sydney recording the biggest yearly increase, of +2.5%
                                                                                                                                                                                                  which produced relatively weak results. Annual growth had declined to 1.7%, the slowest
and +2.4% respectively. In contrast, Darwin recorded the lowest increase, with an
                                                                                                                                                                                                  increase since the GFC prompting consumers’ pessimistic responses during the June
annual change of 0.5%. Over the March quarter, CPI increased in all capital cities,
                                                                                                                                                                                                  survey.
except for Darwin.
                                                                                                                                                                                                  Job security remains a topic on most consumers’ mind, with the Westpac Melbourne
                                                                                                                                                                                                  Institute Unemployment Expectations Index increasing from 135.5 to 140.3, with a lower
                                      112.0                                                                                                              1.20
                                                                                                                                                                                                  number indicating that fewer consumers expect unemployment to rise over the next
                                      111.5
                                                                                                                                                         1.00                                     twelve months. In saying this, job figures have come out positive, with unemployment
                                      111.0

                                                                                                                                                         0.80                                     expectations showing a positive improvement, as average index figures for 2015 and
                                                                                                                                                                 % Change From Previous Quarter

                                      110.5

                                                                                                                                                                                                  2016 were both at 144 points.
  Consumer Price Index (All Groups)

                                      110.0
                                                                                                                                                         0.60
                                      109.5

                                                                                                                                                         0.40
                                      109.0

                                      108.5                                                                                                                                                                            104
                                                                                                                                                         0.20

                                      108.0
                                                                                                                                                                                                                       102
                                                                                                                                                         0.00
                                      107.5

                                                                                                                                                                                                                       100
                                      107.0                                                                                                              -0.20
                                              Australia   Sydney   Melbourne   Brisbane       Adelaide       Perth     Hobart     Darwin    Canberra
                                                                                                                                                                                                  Consumer Sentiment

                                                                                          CPI (All Groups)     Percentage Change From Previous Quarter                                                                  98
 Source: ABS/Preston Rowe Paterson Research
                                                                                                                                                                                                                                                                                                                   Consumer Sentiment Index

                                                                                                                                                                                                                        96
Chart 1—All Group CPI (Capital Cities) and Percentage Change from December 2016 to March 2017—Source—
ABS
                                                                                                                                                                                                                        94

Business Sentiment                                                                                                                                                                                                      92

                                                                                                                                                                                                                        90
                                                                                                                                                                                                                               Jun-16    Jul-16    Aug-16    Sep-16     Oct-16    Nov-16     Dec-16   Jan-17    Feb-17    Mar-17     Apr-17   May-17    Jun-17
Both business conditions and business confidence declined over the month of May.                                                                                                                                       Source: Westpac Melbourne Institute /Preston Rowe Paterson Research

Figures released by National Australia Bank indicate that business conditions dropped                                                                                                             Chart 2—Consumer Sentiment Index, February 2016 to February 2017—Source—Westpac Melbourne Institute Survey

by 1 point, to +12 index points, whilst business confidence index fell by 6 points to +7
index points. In stating this, both indices remain slightly above their long-run average
                                                                                                                                                                                                                                                                                         June 2016                May 2017                    June 2017
index (+5 for business conditions, +6 for business confidence), with leading indicators
                                                                                                                                                                                                                                Consumer Sentiment Index                                     102.2                       98                      111.3
for both business condition and business confidence remaining relatively strong. NAB’s
                                                                                                                                                                                                                               Family finance vs. a year ago                                 90.3                     82.6                       81.4
chief economist, Alan Oster, noted that a disconnect is present when we look at
                                                                                                                                                                                                                         Economic conditions next 12 months                                  97.9                     95.9                       91.3
evidence of solid business activity in conjunction with data that indicates a slowdown in
                                                                                                                                                                                                                                    Time to buy a dwelling                                   103.7                    90.0                       90.9
consumer spending. With weak household data and wage growth remaining at record
low, and a strong business sector, Mr Oster have noted how this ‘disparity resolves itself                                                                                                                    Table 2— Consumer Sentiment– June 2017 — Source— National Australia Bank

will be critical to the outlook for growth’.

 Phone: +61 2 9292 7400
 Fax: +61 2 9292 7404
 Address: Level 14, 347 Kent Street Sydney NSW 2000
                                                                                                                                                                                                                                                                                                                                                             7
 Email: research@prpsydney.com.au
 Follow us: Visit www.prpsydney.com.au                                                                                                                                                                                                                                                                                                                           7
 © Copyright Preston Rowe Paterson NSW Pty Limited
Gross Domestic Product                                                                                                                                                                                                                                                                                                                                                     Unemployment

Over the first quarter of 2017, Australia’s gross domestic product (GDP) increased by                                                                                                                                                                                                                                                                                      Over the month to May 2017, seasonally adjusted unemployment rate declined to 5.5%,
a seasonally adjusted 0.3%- a relatively weak figure when compared to December                                                                                                                                                                                                                                                                                             the lowest level since February 2013. There were 52,100 new persons in full time em-
2016 quarterly increase of 1.1%. Over the twelve months to March 2017, Australia’s                                                                                                                                                                                                                                                                                         ployment, though the number of persons starting part-time roles declined by 10,100-
economy grew by 1.7%, relatively weaker than the 2.4% yearly increase in the fourth                                                                                                                                                                                                                                                                                        bringing the net total number of employed persons to 42,000 over the month. Over the
quarter 2016. Many economists had anticipated weaker growth over March quarter,                                                                                                                                                                                                                                                                                            same period, the participation rate declined to 64.9% (-0.1%), underemployment rate
after current account figures had indicated a dramatic slowdown in exports over the                                                                                                                                                                                                                                                                                        declined to 8.8% (-0.1%) and the underutilisation rate declined to 14.4% (-0.4%).
three months. However, the quarter’s growth now means that Australia has                                                                                                                                                                                                                                                                                                   New South Wales experienced the largest month-on-month increase in employment with
experienced 103 quarters without a technical recession (defined as two consecutive                                                                                                                                                                                                                                                                                         32,600 persons. Victoria and Queensland experienced the next largest increases, with
quarters of negative growths).                                                                                                                                                                                                                                                                                                                                             6,900 persons and 5,500 persons respectively. When we look at the unemployment rate
We note that export of goods and services declined by a seasonally adjusted 1.6%                                                                                                                                                                                                                                                                                           around the country, South Australia and Western Australia experienced the largest
over the quarter. The main influence was a decline in the export of mineral ores and                                                                                                                                                                                                                                                                                       decline, both by -0.4%. Tasmania experienced an increase of 0.2%, whilst New South
coal, which contributed to a 2.6% decline in the export of goods. The export of                                                                                                                                                                                                                                                                                            Wales increased by 0.1%. Tasmania experienced an increase of 0.8% in their participa-
services partially offset this decline by increasing by 2.5% over the quarter, though                                                                                                                                                                                                                                                                                      tion rate, whilst Western Australia experienced a decline of 0.1% in theirs.
was not enough to stimulate an overall positive growth after the previous six quarters
of growth. Moreover, terms of trade increased by 6.6% over the quarter, a decline
from the 9.6% increase from last quarter.
                                                                                                                                                                                                                                                                                                                                                                                                                                                                                                                                                  7.00
Dwelling investments declined by 4.4% over the March quarter, though over the
                                                                                                                                                                                                                                                                                                                                                                                                800,000
                                                                                                                                                                                                                                                                                                                                                                                                                                                                                                                                                  6.50
twelve months, dwelling investment has declined by 2.5%. Victoria was the only state
                                                                                                                                                                                                                                                                                                                                                                                                                                                                                                                                                  6.00
                                                                                                                                                                                                                                                                                                                                                                                                750,000
to experience an increase in dwelling investment over the quarter, though at a                                                                                                                                                                                                                                                                                                                                                                                                                                                                    5.50

                                                                                                                                                                                                                                                                                                                                                                                                                                                                                                                                                         Unemployment rate (%)
                                                                                                                                                                                                                                                                                                                                                                           Unemployed persons

national level, dwelling investment remains high.                                                                                                                                                                                                                                                                                                                                               700,000                                                                                                                                           5.00

                                                                                                                                                                                                                                                                                                                                                                                                                                                                                                                                                  4.50
                                                                                                                                                                                                                                                                                                                                                                                                650,000
                                                                                                                                                                                                                                                                                                                                                                                                                                                                                                                                                  4.00
                                                                          25.00%                                                                                                                                                                                                                                                                                                                600,000                                                                                                                                           3.50
                                                                                                                                                                                                                                                                                                                             1.40%
             Quarterly Change in Dwelling and Non-Dwelling Investments

                                                                          20.00%                                                                                                                                                                                                                                             1.20%                                                                                                                                                                                                                3.00
                                                                                                                                                                                                                                                                                                                                                                                                550,000
                                                                                                                                                                                                                                                                                                                             1.00%                                                                                                                                                                                                                2.50
                                                                          15.00%
                                                                                                                                                                                                                                                                                                                             0.80%
                                                                                                                                                                                                                                                                                                                                                                                                500,000                                                                                                                                           2.00
                                                                                                                                                                                                                                                                                                                                       Quarterly Change in GDP

                                                                                                                                                                                                                                                                                                                                                                                                          May-12

                                                                                                                                                                                                                                                                                                                                                                                                                         Nov-12

                                                                                                                                                                                                                                                                                                                                                                                                                                  May-13

                                                                                                                                                                                                                                                                                                                                                                                                                                              Nov-13

                                                                                                                                                                                                                                                                                                                                                                                                                                                             May-14

                                                                                                                                                                                                                                                                                                                                                                                                                                                                            Nov-14

                                                                                                                                                                                                                                                                                                                                                                                                                                                                                       May-15

                                                                                                                                                                                                                                                                                                                                                                                                                                                                                                  Nov-15

                                                                                                                                                                                                                                                                                                                                                                                                                                                                                                               May-16

                                                                                                                                                                                                                                                                                                                                                                                                                                                                                                                         Nov-16

                                                                                                                                                                                                                                                                                                                                                                                                                                                                                                                                         May-17
                                                                          10.00%                                                                                                                                                                                                                                             0.60%

                                                                                                                                                                                                                                                                                                                             0.40%
                                                                           5.00%                                                                                                                                                                                                                                                                                                                                                                       Unemployed Persons            Unemployment Rate
                                                                                                                                                                                                                                                                                                                             0.20%
                                                                                                                                                                                                                                                                                                                                                                            Source: ABS/Preston Rowe Paterson Research
                                                                                                                                                                                                                                                                                                                             0.00%
                                                                           0.00%
                                                                                                                                                                                                                                                                                                                             -0.20%
                                                                          -5.00%                                                                                                                                                                                                                                             -0.40%                                      Chart 5— Unemployment Persons and Unemployment Rate, March 2011 to March 2017 — Source: ABS
                                                                                                                                                                                                                                                                                                                             -0.60%
                                                                         -10.00%
                                                                                                                                                                                                                                                                                                                             -0.80%
                                                                                                                    Dwelling Investment                                            Non-Dwelling Construction                                                Gross Domestic Product
                                                                         -15.00%                                                                                                                                                                                                                                             -1.00%                                                                                                          Unemployment Rate (%)                                         Participation Rate (%)
                                                                                    Dec-10
                                                                                             Mar-11

                                                                                                                                                                                                                                                   Mar-15

                                                                                                                                                                                                                                                                                        Mar-16
                                                                                                       Jun-11

                                                                                                                         Dec-11
                                                                                                                                  Mar-12
                                                                                                                Sep-11

                                                                                                                                           Jun-12
                                                                                                                                                     Sep-12
                                                                                                                                                              Dec-12
                                                                                                                                                                         Mar-13
                                                                                                                                                                                  Jun-13
                                                                                                                                                                                           Sep-13
                                                                                                                                                                                                     Dec-13
                                                                                                                                                                                                              Mar-14
                                                                                                                                                                                                                        Jun-14
                                                                                                                                                                                                                                 Sep-14
                                                                                                                                                                                                                                          Dec-14

                                                                                                                                                                                                                                                            Jun-15
                                                                                                                                                                                                                                                                      Sep-15
                                                                                                                                                                                                                                                                               Dec-15

                                                                                                                                                                                                                                                                                                 Jun-16
                                                                                                                                                                                                                                                                                                          Sep-16
                                                                                                                                                                                                                                                                                                                    Dec-16

                                                                                                                                                                                                                                                                                                                                                                                                                                           April                      May                             April                       May
                                                                         Source: RBA /Preston Rowe Paterson Research                                                                                                                                                                                                                                                                                        Australia                      5.7                        5.5            ▼                 64.9                       64.9               ▬
        Chart 3— Percentage Change in Dwelling, Non-Dwelling Investments and GDP— Source: ABS                                                                                                                                                                                                                                                                                                        New South Wales                       4.7                        4.8            ▲                 65.3                       65.2               ▼
                                                                                                                                                                                                                                                                                                                                                                                                              Victoria                     6.1                        6.0            ▼                 66.0                       65.5               ▼
                                     450,000.0                                                                                                                                                                                                                                                                                        2.0
                                                                                                                                                                                                                                                                                                                                                                                                          Queensland                       6.3                        6.1            ▼                 69.0                       68.1               ▼
                                                                                                                                                                                                                                                                                                                                      1.5
                                                                                                                                                                                                                                                                                                                                                                                                      South Australia                      7.3                        6.9            ▼                 65.0                       64.8               ▼
                                     400,000.0                                                                                                                                                                                                                                                                                        1.0
                                                                                                                                                                                                                                                                                                                                                                                                     Western Australia                     5.9                        5.5            ▼                 68.8                       67.5               ▼
                                                                                                                                                                                                                                                                                                                                      0.5
                                                                                                                                                                                                                                                                                                                                                                                                           Tasmania                        5.9                        6.1            ▲                 59.5                       59.9               ▲
                                                                                                                                                                                                                                                                                                                                                        Percentage (%)
 GDP ($ Millions)

                                     350,000.0                                                                                                                                                                                                                                                                                        0.0
                                                                                                                                                                                                                                                                                                                                                                                                     Northern Territory*                   3.3                        3.2            ▼                 74.3                       65.6               ▼
                                                                                                                                                                                                                                                                                                                                      -0.5
                                                                                                                                                                                                                                                                                                                                                                                                Australian Capital Territory*              3.6                        3.5            ▼                 67.8                       66.1               ▼
                                     300,000.0                                                                                                                                                                                                                                                                                        -1.0

                                                                                                                                                                                                                                                                                                                                      -1.5                               Table 3— Unemployment Rate and Participation Rate, February vs. March 2017 — Source: ABS                                                                   * Trend
                                                                                                                                                                                                                                                                                                                                                                         figures used for NT and ACT as seasonally adjusted data for both are not publicly available
                                     250,000.0                                                                                                                                                                                                                                                                                        -2.0
                                                                                   Mar-12
                                                                                              Jun-12
                                                                                                          Sep-12
                                                                                                                     Dec-12
                                                                                                                                  Mar-13
                                                                                                                                            Jun-13
                                                                                                                                                        Sep-13
                                                                                                                                                                       Dec-13
                                                                                                                                                                                  Mar-14
                                                                                                                                                                                            Jun-14

                                                                                                                                                                                                                       Dec-14
                                                                                                                                                                                                                                 Mar-15

                                                                                                                                                                                                                                                                     Dec-15
                                                                                                                                                                                                                                                                               Mar-16

                                                                                                                                                                                                                                                                                                      Sep-16
                                                                                                                                                                                                                                                                                                                   Dec-16
                                                                                                                                                                                                                                                                                                                             Mar-17
                                                                                                                                                                                                         Sep-14

                                                                                                                                                                                                                                            Jun-15
                                                                                                                                                                                                                                                       Sep-15

                                                                                                                                                                                                                                                                                          Jun-16

                                                                                                                Gross Domestic Product Seasonally Adjusted                                                                                         % Change Seasonally Adjusted

  Source: RBA /Preston Rowe Paterson Research

        Chart 4— Seasonally Adjusted GDP and Seasonally Adjusted Change in GDP— Source: ABS

 Phone: +61 2 9292 7400
 Fax: +61 2 9292 7404
 Address: Level 14, 347 Kent Street Sydney NSW 2000
                                                                                                                                                                                                                                                                                                                                                                                                                                                                                                                                                    8
 Email: research@prpsydney.com.au
 Follow us: Visit www.prpsydney.com.au                                                                                                                                                                                                                                                                                                                                                                                                                                                                                                                                           8
 © Copyright Preston Rowe Paterson NSW Pty Limited
10 Year Bond & 90 Day Bill Rate

    10-year government bond yield in Australia declined by 0.14% to 2.41% over the                                                                                                                                    The Board’s decision to keep interest rates unchanged stemmed from upbeat messag-
    month to June 2017. Over three months, the 10-year bond yields declined by 0.40%,                                                                                                                                 es from world economic growth, in conjunction with the prospect of world-wide increase
    though when compared to June 2016, yields had increased by 0.29%. Australia’s 90-                                                                                                                                 of wages and prices as the labour markets in many countries begin to improve. It was
    day bill rate declined by 0.01% over the month, to 1.72%. This figure signifies a                                                                                                                                 also noted that headline inflation in many countries have increased over the past twelve
    0.07% decline over the quarter and a 0.27% decline over the year. Historically,                                                                                                                                   months, though core inflation remain relatively low. In the domestic economy, improve-
    Australian government yields are usually higher than that of the US government                                                                                                                                    ments in business conditions and business investments, in the parts of the economy
    yields. However, the differential between Australian and US 10-year government                                                                                                                                    that was not directly affected by the slowdown in mining investments contributed to the
    bonds have narrowed to just 16 basis points at the end of June as global investors                                                                                                                                Board’s interest rate decisions. Slow wage growth continue to highlighted, with mem-
    price in more monetary tightening by the Federal Reserve. We note that Australian 10                                                                                                                              bers pointing out the low increase in income and high levels of household debts as
    -year bond yields, being influenced by the global increase in yields, had increased by                                                                                                                            being the main inhibitors to household consumption.
    53 basis points since August last year, during which yields dropped to a historical low
    of 1.88%. Preston Rowe Paterson notes that long term bond yields have been                                                                                                                                                                     5.0

    declining gradually since the 1980’s, and we consider the sharp increase in late
                                                                                                                                                                                                                                                   4.5
    December 2016 and the current elevated bond yields a normalisation of 10-year
                                                                                                                                                                                                                                                   4.0
    government bonds after it dropped to a record low in August 2016.
                                                                                                                                                                                                                       Percentage (%)

                                                                                                                                                                                                                                                   3.5

                 5.00
                                                                                                                                                                                                                                                   3.0

                 4.50
                                                                                                                                         10 Yr Bond             90 Day Bill               Cash Rate                                                2.5
                 4.00                                                                                                                                                                                                                                                                                                                                                                                                      RBA Cash Rate
                                                                                                                                                                                                                                                   2.0
                 3.50
Percentage (%)

                 3.00                                                                                                                                                                                                                              1.5

                 2.50                                                                                                                                                                                                                              1.0
                                                                                                                                                                                                                                                                           Sep-12

                                                                                                                                                                                                                                                                                                                Sep-13

                                                                                                                                                                                                                                                                                                                                                    Sep-14

                                                                                                                                                                                                                                                                                                                                                                                         Sep-15

                                                                                                                                                                                                                                                                                                                                                                                                                                Sep-16
                                                                                                                                                                                                                                                         Mar-12

                                                                                                                                                                                                                                                                  Jun-12

                                                                                                                                                                                                                                                                                             Mar-13

                                                                                                                                                                                                                                                                                                      Jun-13

                                                                                                                                                                                                                                                                                                                                  Mar-14

                                                                                                                                                                                                                                                                                                                                           Jun-14

                                                                                                                                                                                                                                                                                                                                                                       Mar-15

                                                                                                                                                                                                                                                                                                                                                                                Jun-15

                                                                                                                                                                                                                                                                                                                                                                                                            Mar-16

                                                                                                                                                                                                                                                                                                                                                                                                                       Jun-16

                                                                                                                                                                                                                                                                                                                                                                                                                                                   Mar-17

                                                                                                                                                                                                                                                                                                                                                                                                                                                            Jun-17
                                                                                                                                                                                                                                                                                    Dec-12

                                                                                                                                                                                                                                                                                                                         Dec-13

                                                                                                                                                                                                                                                                                                                                                              Dec-14

                                                                                                                                                                                                                                                                                                                                                                                                   Dec-15

                                                                                                                                                                                                                                                                                                                                                                                                                                         Dec-16
                 2.00

                                                                                                                                                                                                                                          Source: RBA /Preston Rowe Paterson Research
                 1.50
                                                                                                                                                                                                                            Chart 7— Reserve Bank of Australia Overnight Cash rate—Source: RBA
                 1.00
                        Jun-12

                                 Sep-12

                                          Dec-12

                                                   Mar-13

                                                            Jun-13

                                                                     Sep-13

                                                                              Dec-13

                                                                                       Mar-14

                                                                                                Jun-14

                                                                                                         Sep-14

                                                                                                                  Dec-14

                                                                                                                           Mar-15

                                                                                                                                    Jun-15

                                                                                                                                             Sep-15

                                                                                                                                                      Dec-15

                                                                                                                                                               Mar-16

                                                                                                                                                                        Jun-16

                                                                                                                                                                                 Sep-16

                                                                                                                                                                                           Dec-16

                                                                                                                                                                                                    Mar-17

                                                                                                                                                                                                             Jun-17

Source: RBA /Preston Rowe Paterson Research

   Chart 6— Monthly Movement of 90-day Bill, 10-year bond yields and Cash rate—Source: RBA                                                                                                                            Exchange Rate

                                                                                                                                                                                                                                                   1.0000                                                                                                                                                                                                            100
      Interest Rates
                                                                                                                                                                                                                                                   0.9000                                                                                                                                                                                                            90
      The Board of the Reserve Bank left rates unchanged at 1.5% for the tenth consecutive
      month at their June meeting. The main concerns brought up at the board meeting
                                                                                                                                                                                                                      1 $AUD buys (US, UK, Euro)

                                                                                                                                                                                                                                                   0.8000                                                                                                                                                                                                            80

      included concerns surrounding Australia’s low wage growth and the imbalance between
                                                                                                                                                                                                                                                                                                                                                                                                                                                                           1 $AUD buys (Yen)

                                                                                                                                                                                                                                                   0.7000                                                                                                                                                                                                            70
      the housing markets around various parts of Australia. Ultimately, the Reserve Bank
      strives to achieve financial stability by pursuing an inflation target of two to three percent
                                                                                                                                                                                                                                                   0.6000                                                                                                                                                                                                            60
      over the medium term. As the nation transitions through the mining boom investment
      phase, interest rates were cut to its lowest historical levels in order to support economic                                                                                                                                                  0.5000                                                                                                                                                                                                            50

      growth within the country. Reserve Bank board members noted the importance of a                                                                                                                                                                                                                                                                  US $             UK Pound                  Euro               Yen

                                                                                                                                                                                                                                                   0.4000                                                                                                                                                                                                            40
      prudent regulatory body in promoting financial stability, and noted the need for a strong                                                                                                                                                                   Jun-16                                       Sep-16                                   Dec-16                                     Mar-17                                         Jun-17
      relationship built between the Bank and banking regulators, especially Australia                                                                                                                                                        Source: RBA /Preston Rowe Paterson Research

      Prudential Regulatory Authority (APRA).                                                                                                                                                                                 Chart 8— Movement in Exchange Rate over the year to March 2016— Source: RBA

       Phone: +61 2 9292 7400
       Fax: +61 2 9292 7404
       Address: Level 14, 347 Kent Street Sydney NSW 2000
                                                                                                                                                                                                                                                                                                                                                                                                                                                                     9
       Email: research@prpsydney.com.au
       Follow us: Visit www.prpsydney.com.au                                                                                                                                                                                                                                                                                                                                                                                                                                    9
       © Copyright Preston Rowe Paterson NSW Pty Limited
Our Research                                                             We have all types of plant & machinery
                                                                               covered
      At Preston Rowe Paterson, we pride ourselves on the research
      which we prepare in the market sectors within which we operate.          We regularly undertake valuations of all forms of plant, machinery,
      These include Commercial, Retail, Industrial, Hotel & Leisure and        furniture, fittings and equipment including:
      Residential property markets as well as infrastructure, capital and
      plant and machinery markets                                                 Mining & earth moving equipment/road plant
                                                                                  Office fit outs, equipment & furniture
      We have property covered                                                    Agricultural machinery & equipment
                                                                                  Heavy, light commercial & passenger vehicles
         Investment                                                              Industrial manufacturing equipment
         Development                                                             Wineries and processing plants
         Asset                                                                   Special purpose plant, machinery & equipment
         Corporate Real Estate                                                   Extractive industries, land fills and resource based enterprises
         Mortgage                                                                Hotel furniture, fittings & equipment
         Government
          Insurance
                                                                               We have all client profiles covered
      

         Occupancy
         Sustainability
         Research                                                             Preston Rowe Paterson acts for an array of clients with all types of
         Real Estate Investment Valuation                                     real estate, plant, machinery and equipment interests such as:
         Real Estate Development Valuation
         Property Consultancy and Advisory                                       Accountants
         Transaction Advisory                                                    Banks, finance companies and lending institutions
         Property and Asset Management                                           Commercial and Residential non bank lenders
         Listed Fund, Property Trust, Super Fund and Syndicate Advisors          Co-operatives
         Plant & Machinery Valuation                                             Developers
         General and Insurance Valuation                                         Finance and mortgage brokers
         Economic and Property Market Research                                   Hotel owners and operators
                                                                                  Institutional investors
      We have all real estate types covered                                       Insurance brokers and companies
                                                                                  Investment advisors
      We regularly provide valuation, property and asset management,              Lessors and lessees
      consultancy and leasing services for all types of Real Estate               Listed and private companies corporations
      including:                                                                  Listed Property Trusts
                                                                                  Local, State and Federal Government Departments and Agencies
         CBD and Metropolitan commercial office buildings                        Mining companies
         Retail shopping centres and shops                                       Mortgage trusts
         Industrial, office/warehouses and factories                             Overseas clients
         Business parks                                                          Private investors
         Hotels (accommodation) and resorts                                      Property Syndication Managers
         Hotels (pubs), motels and caravan parks                                 Rural landholders
         Residential development projects                                        Self managed super funds
         Residential dwellings (individual houses and apartments/units)          Solicitors and barristers
         Rural properties                                                        Sovereign wealth funds
         Special purpose properties such as: nursing homes; private              Stock brokers
          hospitals, service stations, oil terminals and refineries, theatre      Trustee and Custodial companies
          complexes; etc.
         Infrastructure

Phone: +61 2 9292 7400
Fax: +61 2 9292 7404
Address: Level 14, 347 Kent Street Sydney NSW 2000
                                                                                                                                                      10
Email: research@prpsydney.com.au
Follow us: Visit www.prpsydney.com.au                                                                                                                  10
© Copyright Preston Rowe Paterson NSW Pty Limited
We have all locations covered                                               About This Report
    From our capital city and regional office locations we serve our client’s   Preston Rowe Paterson prepare standard research reports covering
    needs throughout Australia. Globally, we operate directly or via our        the main markets within which we operate in each of our capital cities
    relationship offices for special purpose real estate asset classes,         and major regional locations. This Residential Development Market
    infrastructure and plant & machinery.                                       research report provides analysis and detail of economic factors which
                                                                                impact the Residential Development Market within the Sydney region.
    We have your needs covered
    Our clients seek our property (real estate, infrastructure, plant and       Within this report we have analysed the three geographical regions of
    machinery) services for a multitude of reasons including:                   residential properties in the Sydney metropolitan areas; Inner Sydney,
    Acquisitions & Disposals                                                   Middle Sydney and Outer Sydney. We have also compiled a few major
    Alternative use & highest and best use analysis                            reported developments and development site sales, along with
    Asset Management                                                           economic statistics and commentary on the residential development
    Asset Valuations for financial reporting to meet ASIC, AASB, IFRS &        sector.
     IVSC guidelines
    Compulsory acquisition and resumption
    Corporate merger & acquisition real estate due diligence                   To compile the research report we have considered the most recently
    Due Diligence management for acquisitions and sales                        available statistics from known sources. Given the manner in which
    Facilities management                                                      statistics are complied and published they are usually 3-6 months out
    Feasibility studies                                                        of date at the time we analyse them. Where possible we consider short
    Funds management advice & portfolio analysis                               term movement in the statistics by looking at daily published data in the
    Income and outgoings projections and analysis                              financial press. Where this shows notable fluctuation, when compared
    Insurance valuations (replacement & reinstatement costs)                   to the formal published numbers we have commented accordingly.
    Leasing vacant space within managed properties
    Listed property trust & investment fund valuations & revaluations
    Litigation support
    Marketing & development strategies
    Mortgage valuations
    Property Management
    Property syndicate valuations and re-valuations
    Rating and taxing objections
    Receivership, Insolvency and liquidation valuations and support/
     advice
    Relocation advice, strategies and consultancy
    Rental assessments and determinations
    Sensitivity analysis
    Strategic property planning

Phone: +61 2 9292 7400
Fax: +61 2 9292 7404
Address: Level 14, 347 Kent Street Sydney NSW 2000
                                                                                                                                                      11
Email: research@prpsydney.com.au
Follow us: Visit www.prpsydney.com.au                                                                                                                  11
© Copyright Preston Rowe Paterson NSW Pty Limited
Head Office (Sydney)                                           Regional Offices                         Swan hill
Level 14, 347 K ent St reet                                                                             Ian Boyd-Law
                                                              Albury Wodonga
Sydney NSW 2000                                                                                         M: 0418 5980232
                                                              Michael Redfern
PO BOX 4120, Sydn ey NSW 2001                                 M: 0428 235 588                           E: ian.boyd-law @prp.com.au
P: 02 9292 7400                                               E: michael.redfern@prp.com.au
F: 02 9292 7404                                                                                         Tamworth
                                                              Ballarat                                  Bruce Sharrock
E: res earch@prps ydney.com.au
                                                              Darren Evans                              M: 0429 465 012
National Directors                                            M: 0417 380 324                           E: bruce.s harrock@prp.com.au
                                                              E: darren.evans @prp.com.au               Matt Spencer
Gregory Preston                                               Peter Murphy                              M: 0447 227 002
M: 0408 622 400                                               M: 0402 058 775                           E: matt.s pencer@prp.com.au
E: greg.pres t on@prps ydney.com.au                           E: pet er.murphy@prp.com.au
                                                                                                        Wagga Wagga
Gregory Rowe                                                  Bendigo                                   Dan Hogg
M: 0411 191 179                                               Damien Jerinic                            M: 0408 585 119
E: greg.row e@prps ydney.com.au                               M: 0409 820 623                           E: daniel.hogg@prp.com.au
Neal Ellis                                                    E: damien.jerinic@prp.com.au
                                                                                                        Warrnambool
M: 0417 053 116                                               Central Coast/Gosford                     Stuart McDonald
E: neal.ellis @prp.com.au                                     Colin Pugsley                             M: 0405 266 783
Damian Kininmonth                                             M: 0435 376 630                           E: stuart.mcdonald@prp.com.au
M: 0417 059 836                                               E: colin.pugs ley@prp.com.au
E: damian.kininmont h@prp.com.au                              Dubbo
Greg Sugars                                                   James Skuthorp                            New Zealand Offices
M: 0435 911 465                                               M: 0409 466 779
                                                              E: james.s kuthorp@prp.com.au             Head Office (Auckland)
E: greg.s ugars @prp.com.au
                                                              Tom Needham                               Greg Sugars
www.prp.com.au                                                M: 0412 740 093                           M: + 64 ( 0)27 777 9010
                                                              E: t om.needham@prps ydne y.com.au        E: greg.s ugars @prpnz.nz
                                                                                                        Mitchell Stubbs
                                                              Geelong
                                                                                                        M: + 64 ( 0)27 774 34100
                                                              Gareth Kent
                                                                                                        E: mit chell.st ubbs @prpnz.nz
                                                              M: 0413 407 820
                                                              E: garet h.kent @prp.com.au               Dunedin
                                                              Stuart Mcdonald                           James Stowell
                                                              M: 0405 266 783                           M: + 64 ( 0)17 807 3866
 Capital City Offices                                         E: stuart.mcdonald@prp.com.au             E: james.st ow ell@prpnz.nz
 Adelaide                                                     Gippsland                                 Greymouth
Rob Simmons                                                   Tim Barlow                                Mark Bollard
M: 0418 857 555                                               M: 0400 724 444                           M: + 64 ( 0)27 694 7041
E: adelaide@ prp.com.au                                       E: t im.barlow @prp.com.au                E: mark.bollard@prpnz.nz
                                                              Alexandra Ellis
 Brisbane                                                                                               Tauranga
                                                              M: 0407 724 444
Troy Chaplin                                                                                            Alex Haden
M: 0419 029 045                                               E: alex.ellis @prp.com.au
                                                                                                        M: + 64 ( 0)21 833 118
E: t roy.chaplin@prpque ens land.com.au                       Griffith                                  E: alex.haden@prpn z.nz
 Hobart                                                       Dan Hogg
                                                              M: 0408 585 119
Damien Taplin
                                                              E: daniel.hogg@prp.com.au
                                                                                                        www.prpnz.nz
M: 0418 513 003
E: damien.t aplin@prp.com.au                                  Horsham
Shelley Taplin                                                Ben Sawyer                                 Asian Offices
M: 0413 309 895                                               M: 0429 826 541
E: s helley.t aplin@prp.com.au                                E: ben.s aw yer@prp.com.au
                                                                                                        Associated office networks throughout:
                                                                                                              China
 Melbourne                                                    Launceston
                                                                                                              Hong K ong
Neal Ellis                                                    Damien Taplin
M: 0417 053 116                                               M: 0418 513 003
                                                                                                              Japan
E: neal.ellis @prp.com.au                                     E: damien.t aplin@prp.com.au                    Philippines
Damian Kininmonth                                                                                             Thailand
                                                              Mornington
M: 0417 059 836
                                                              Neal Ellis
E: damian.kininmont h@prp.com.au
                                                              M: 0417 053 116
                                                                                                         Preston Rowe Paterson Australasia Pty Ltd
 Perth                                                        E: neal.ellis @prp.com.au
                                                                                                         ACN: 060 005 807
Cameron Sharp                                                 Damian Kininmonth
                                                                                                        The informat ion provided w it hin t his publicat ion s hould be
M: 0438 069 103                                               M: 0417 059 836
                                                                                                        regarded s olely as a general guide. W e believe that t he
E: cameron.s harp@prp.com.au                                  E: damian.kininmont h@prp.com.au
                                                                                                        informat ion herein is accurat e how ever no w arrant y of
 Sydney                                                       Mount Gambier                             accuracy or reliabilit y is given in relat ion t o any
Gregory Preston                                               Stuart McDonald                           informat ion cont ained in this publicat ion. Nor is any
M: 0408 622 400                                               M: 0405 2660783                           res pons ibilit y for any los s or damage w hats oever aris ing in
E: greg.pres t on@prps ydney.com.au                           E: stuart.mcdonald@prp.com.au             any w ay for any repres ent at ion, act or omission, w het her
Gregory Rowe                                                  Newcastle                                 expres s ed or implied ( including res ponsibilit y t o any
M: 0411 191 179                                                                                         pers on or ent it y by re as on of negligence) acce pt ed by
                                                              Robert Dupont
E: greg.row e@prps ydney.com.au                                                                         Prest on Row e Pat ers on Aust ralasia Pt y Lt d or any of its
                                                              M: 0418 681 874
                                                              E: bob.dupont @prp.com.au                 as s ociat ed offices or any officer, agent or employee of
Affiliat e offices in Canberra, Darw in and ot her regional                                             Prest on Row e Pat ers on Aust ralas ia Pt y Limit ed.
areas.                                                        David Rich
                                                              M: 0413 052 166
                                                              E: david.rich@prpncle.com.au
                                                              Southport
                                                              Ian Hawley
                                                              M: 0458 700 272
                                                              E: ian.hawley@prpqueens land.com.au
                                                              Troy Chaplin
                                                              M: 0419 029 045
                                                              E: t roy.chaplin@prpque ens land.com.au

Phone: +61 2 9292 7400
Fax: +61 2 9292 7404
Address: Level 14, 347 Kent Street Sydney NSW 2000
                                                                                                                                                                      12
Email: research@prpsydney.com.au
Follow us: Visit www.prpsydney.com.au                                                                                                                                  12
© Copyright Preston Rowe Paterson NSW Pty Limited
You can also read