Sustainable Cities and Society - Edinburgh ...
←
→
Page content transcription
If your browser does not render page correctly, please read the page content below
Sustainable Cities and Society 71 (2021) 103012
Contents lists available at ScienceDirect
Sustainable Cities and Society
journal homepage: www.elsevier.com/locate/scs
Emissions assessment of bike sharing schemes: The case of Just Eat Cycles
in Edinburgh, UK
Léa D’Almeida a, Tom Rye b, c, *, Francesco Pomponi d
a
Paris School of Urban Engineering, Paris, France
b
Department of Logistics, Molde University College, Norway
c
Urban Planning Institute of Slovenia, Ljubljana, Slovenia
d
School of Engineering and the Built Environment, Edinburgh Napier University, Scotland, UK
A R T I C L E I N F O A B S T R A C T
Keywords: Transport accounts for 40 % of global emissions, 72 % of which comes from road transport, and private cars are
Mobility responsible for 60 % of road transport emissions. In cities, self-service bike sharing systems are quickly devel
Bike sharing schemes oping and are intended to offer an alternative and cleaner mode of transport than the car. However, the sus
Carbon emissions
tainability of such schemes is often taken as a given, rather than thoroughly evaluated. To address this gap, in
Life cycle analysis
Rebalancing operations
this paper we undertake a life cycle assessment (LCA) of a public self-service bike sharing system in the city of
Edinburgh, UK, modelling the production, operation and disposal elements of the system, but discounting
additional food intake by users. Our results show that the bike sharing scheme is saving carbon dioxide equiv
alent emissions compared to the modes of transport by which its users previously travelled, but it is essential to
optimize rebalancing operations and to manufacture bikes as near as possible to the point of use to further reduce
carbon emissions; and that the overall emissions impacts of the scheme are critically dependent on how public
transport providers respond to reductions in demand as users shift trips to bikeshare, since most trips transfer
from walk and public transport, not private car. The policy implications for authorities seeking to use BSS as a
GHG reduction intervention are not straightforward.
knowledge of their effects in this regard. The dual focus of the paper on
LCA in the context of urban mobility addresses two of the core areas of
1. Introduction
the scope of this journal and that is reflected in the focus of other papers
it has published recently on greenhouse gas emissions reduction in
Driving cars contributes to traffic congestion, GHG emissions and
transport. The topic of BSS is highly relevant to a journal readership that
global warming, whereas cycling is more ecofriendly and provides op
is concentrated in Western Europe and East Asia, two parts of the world
portunities for physical activity. Cycling is found almost everywhere,
in whose cities BSS are most commonly found.
although some places have higher levels of cycle use than others
The structure of the rest of the paper is as follows. It first reviews the
depending on infrastructure, topography, local culture and weather
relevant literature and identifies knowledge gaps in terms of the LCA of
amongst other factors (Rosen, Cox, & Horton, 2007). To promote sus
BSS. It then presents the method for the paper including the data sources
tainable development, cities often wish to facilitate access to bikes and
used. It then uses these data to calculate the LCA GHG emissions impacts
have thus invested in bike sharing schemes (BSS). Initially rather
of the BSS, and analyses the impacts on the calculation of changes in
experimental when the first cities tested them, BSS have now become
certain input data (sensitivity testing); and describes the limitations of
common in cities across the world, although their contribution to overall
the method used. It then calculates the GHG emissions savings resulting
mobility remains small in most cases due to limited fleet sizes. A core
from the BSS due to mode shift from other forms of transport, before
motivation for investing in these schemes is to bring about modal shift
drawing conclusions and setting out policy implications and proposals
from car to bike in order to reduce greenhouse gas emissions, but there is
for future research.
a knowledge gap regarding how effective they are in so doing, particu
larly in the European context. Applying Life Cycle Analysis (LCA) to a
study of such a scheme is an innovative approach to increasing our
* Corresponding author at: Department of Logistics, Molde University College, Norway.
E-mail address: tom.rye@himolde.no (T. Rye).
https://doi.org/10.1016/j.scs.2021.103012
Received 17 November 2020; Received in revised form 9 April 2021; Accepted 9 May 2021
Available online 11 May 2021
2210-6707/© 2021 The Authors. Published by Elsevier Ltd. This is an open access article under the CC BY license (http://creativecommons.org/licenses/by/4.0/).
L. D’Almeida et al. Sustainable Cities and Society 71 (2021) 103012
theft, secondly the blocking of public space by parked bikes, and thirdly
Nomenclature management of the rebalancing of bikes around the city (although this
latter also occurs with docked schemes). To discourage theft, GPS
BSS Bike sharing scheme tracking systems are built into to the bike, and rebalancing is carried out
LCA Life cycle analysis to provide the required level to meet demand (Pal & Zhang, 2017). In
GHG Greenhouse gases recent years, free-floating bike-sharing systems have been heavily
CO2 CO2 is used as CO2 equivalent criticised for their use (and abuse) of public space as they do not have
fixed-station parking locations and users sometimes park their bikes in a
way that reduces sidewalk space for others, especially pedestrians.
One country where free-floating BSS have developed extensively is
2. Literature review China and competition between Chinese bicycle-sharing companies is
intense. Many brands of this type of BSS are found in the Chinese mar
A critical literature review is beyond the scope of our work but in this ket, the most prominent being OFO, launched in June 2015 in Beijing
section we briefly review relevant literature that is either useful to offer and expanded internationally from 2016 to 2018; along with Mobike and
input data for our analysis or to contextualise our own findings. Bluegogo (Ibold & Nedopil, 2018). Currently, around 500 bike-share
services can be found in over 1,175 cities, municipalities or district ju
2.1. Definition of and different generations of bike sharing schemes risdictions in 63 countries worldwide (Meddin, 2019). With investment
costs of USD3,000 to USD4,000 per bike, and operating costs of around
Bicycle-sharing schemes are defined as short-term urban bicycle USD1500 per bike (Midgley, 2011), much of which is covered in docked
rental schemes. They enable bicycles to be rented from any self-service BSS by the public sector (Zhang, Zhang, Duan, & Bryde, 2015; Murphy &
bicycle station and returned to any other, making bicycle-sharing ideal Usher, 2015), it is important to get a better understanding of the impacts
for short to medium distance point-to-point trips within the area served of the schemes to assess whether this is money well spent. This paper,
by the scheme (Midgley, 2011). The definition now extends to so-called through its Life Cycle Analysis of the Edinburgh scheme, helps to pro
free-floating or dockless schemes where the station described above is vide that improved understanding required.
simply any convenient public space to which the bike is returned after a
ride – no fixed bike parking/locking infrastructure is provided, and bikes 2.2. Previous research on carbon emissions from shared bike schemes
are locked digitally instead. BSS offer the advantage of using bicycles as
and when required, without the responsibility or the maintenance When a product such as a bike is produced, carbon emissions are
resulting from ownership. released from the manufacturing process and continue to be emitted
According to DeMaio (2009), BSS have developed across 3 genera right through its life due to operations (such as, for example, “reba
tions over the past 45 years. The earliest version of a BSS was the Witte lancing” – moving bikes around to ensure that demand is served
Fietsenplan: The White Bicycle Plan; conceived in 1965 by the Provo adequately in the whole area) and ultimately its recycling or disposal.
anarchist movement to counter the rise of pollution and cars in None of the major manufacturers have published data on the overall
Amsterdam. This initiative was short-lived since the bicycles were greenhouse gas (GHG) emissions incurred in the process of
immediately confiscated by the police, who were hostile to the Provo’s manufacturing a bike, from extracting raw materials to end of produc
activities. The second generation of BSS was marked by the Bycykler tion. However, Shreya (2010) calculated that manufacturing a bike re
København programme in the Danish capital in 1995, which included leases 240 kg of greenhouse gases on average (cited in Lacap & Barney,
fixed docks with a deposit paid by coin; but these suffered high levels of 2015).
vandalism and theft due to the anonymity of the user. Duffy and Crawford (2013) led a study on the effects of physical
To address these issues, the third generation of BSS incorporates a activity on greenhouse gas emissions for common transport modes in
variety of technological improvements such as electronically-locking European countries to measure the gases released in relation to
racks or bike locks, telecommunication systems, smartcards and fobs, manufacturing, maintenance, food consumption, fuel and non-fuel
and mobile phone access (DeMaio, 2009); making users much easier to (maintenance, taxation and insurance). Cycling does not of course
identify, and bikes easier to keep track of. Latest development in this directly involve fossil fuel-related operational emissions. An estimated
space involve the use of GIS-based approaches and multi-criteria deci 86.4 g CO2/km was emitted by cyclists in 2012, dominated by mainte
sion-making to identify the optimal location of bike-share stations nance emissions (52 %), followed by manufacture (26 %) and food en
(Kabak, Erbaş, Çetinkaya, & Özceylan, 2018). ergy (22 %). The degree to which food energy used to power a bike is
Bike-sharing slowly gained ground in the following years until 2005 actually additional food consumption is returned to later in the paper.
when JC Decaux - a French multinational corporation known for its bus Carbon emissions from individually owned bikes are not the same as
stop advertising systems - developed public bicycle rental systems in those from BSS due to the very different life cycle process of the latter.
Rennes (Vélo’v) and in Paris (Vélib’), both in France, prompting a For example, battery operated smart bicycle locks used in BSS result in
worldwide interest in BSS as a mode of transport. increased carbon emissions through manufacturing, maintenance, and
With the introduction of many new technologies, free-floating bike waste disposal. In addition, shared bikes are made using more plastic
sharing then appeared as an innovative BSS model that some consider to and metal to help protect them from vandalism, especially their elec
be a fourth generation. The earliest versions of the free-floating bike tronic components. Moreover, a significant difference in carbon emis
sharing system consisted of for-rent-bicycles locked with a combination sions exists through the rebalancing operations necessary to optimize a
code number, which a registered user would access by calling the bike BSS offer (moving the bikes around to ensure that supply meets demand
management company. The user would then call the company a second in different parts of the city).
time for details of the bicycle’s location. In 1998 Deutsche Bahn further Zhang and Mi (2018), used Mobike’s dataset to evaluate the envi
developed this dockless bike hire system, resulting in the launch of Call a ronmental performance of bicycle sharing, calculating that the adoption
Bike in 2000; with the added benefit of enabling users to unlock the of BSS in Shanghai decreased CO2 and NOX emissions from surface
bicycle via SMS or phone call, and more recently using a smartphone transport by 25,240 and 64 tonnes per year. Their research only
app. considered the use of shared bicycles to replace taxis or walking and did
Generally, the main advantage of free-floating BSS over station- not include the life cycle of shared bikes; thus suggesting a likely un
based BSS is the money saved on the construction of docking stations. derestimation of the BSS emissions. Conversely, another study aiming to
However, there are three disadvantages of free-floating schemes: firstly measure the impact of the increasingly popular BSS on transport,
2
L. D’Almeida et al. Sustainable Cities and Society 71 (2021) 103012
sustainability, health, and community liveability in Barcelona consid Table 1
ered all the substitute modes to BSS spanning public transit, motor Comparison between Edinburgh and Glasgow BSS.
vehicle, walking, private bike and taxi (Fishman, Washington, & Edinburgh Glasgow
Haworth, 2012) but, again, not LCA emissions.
BSS name Just Eat Cycle Nextbike
Zheng, Gu, Zhang, and Guo (2019) carried out an LCA of BSS in BSS operator Serco Nextbike GmbH
China. Their system boundary included: producing a shared bike, using Began operation 2018 2014
a shared bike, maintaining a shared bike, and recycling or non-recycling City population 482 640 606 340
of a shared bike, but the activities of, and related carbon emissions City area 259 175,5
First year daily hires 284 202
resulting from, rebalancing operations were excluded. Compared to the Second year daily hires 304 280
modes used prior to bike sharing, they found that the GHG savings for Number of cycles (first year of operation) 500 400
one shared bike are 52.08 kg CO2e. It is worth noting that they did not
consider carbon emissions from bus use, but it is unlikely that small
numbers of people shifting from bus to BSS would lead to reduced bus station or virtual one with markings on the ground.
services and hence reduced emissions from buses. Luo, Kou, Zhao, and The table below compares Edinburgh’s BSS to nearby Glasgow’s
Cai (2019) also carried out a LCA of BSS and an analysis of total nor Nextbike BSS (running since 2013), against which TfE can reasonably
malised environmental impacts (TNEI), comparing station-based to benchmark its experience (Table 1).
dockless schemes in the United States. They found that station-based had Although not the primary focus of the paper, it is useful to consider
higher TNEI (due to the impacts of manufacturing the docks) but lower how Glasgow’s BSS operates in comparison to that of Edinburgh to the
LCA (due to lesser requirements for rebalancing bikes between loca extent that they are two Scottish cities of similar population size working
tions) than the dockless schemes. Bonilla-Alicea, Watson, Shen, Tamayo, in line with broadly the same transport policy and objectives. As the
and Telenko (2020) come to a similar conclusion in their study – not set Glasgow scheme was introduced earlier, its growth gives some indica
in any particular country - of “smart bikes” used in dockless BSS but put tion of the trajectory that Edinburgh’s BSS might be expected to follow.
this down mainly to the increased emissions involved in the production Firstly, the renting process differs: the unlocking step in Glasgow
of such bikes. The proportion of trips transferring from private car was includes a 4-digit lock code which is entered onto the bike’s computer;
crucial in assessing TNEI and LCA for both types of scheme. The litera the bike can also be unlocked by hotline. Secondly, Nextbike only
ture available to date indicates that this proportion is normally a small operates with a physical station with a mechanical lock. Thirdly, Next
part of the overall trips made by BSS: the vast majority transfer from bike provides the same number of bikes as Just Eat Cycles which is a little
public transport or walking (de Chardon, Caruso, & Thomas, 2017; surprising given that Glasgow has 120,000 more inhabitants more
Midgley, 2011; Ricci, 2015). The degree to which any resulting fall in Edinburgh. In addition, more stations are located in Edinburgh (80
public transport demand translates into reduced public transport supply versus 62 in Glasgow), which could be explained by Edinburgh’s larger
is crucial to calculating LCA impacts of BSS, but there is very little city surface area (259 km2 vs 175.5 km2 for Glasgow). Lastly, Nextbike’s
literature on this topic – Campbell and Brakewood (2017) find a sig annual pass is more affordable than Edinburgh’s; Glasgow having a 11 %
nificant reduction in bus ridership in New York due to transfer to lower cost of living (Cost of Living Comparison, 2020). The scheme
bikeshare, but do not discuss how the public transport operator has or quickly mushroomed following an increase in monthly hires: 6550 in
will respond to this in terms of service provision. The environmental March, 8177 in April and 10215 in June 2019. We can reasonably as
performance of bike-sharing schemes seems therefore to be significantly sume that the results of this paper – although it is not a study of the
bound to how such schemes are designed, implemented, managed, and Glasgow scheme – will also have relevance to that scheme, given the
agreed-upon as Mi and Coffman (2019) have shown. This is confirmed similar operating context and conditions.
by current results in the existing literature (such as those of Luo et al.,
2019, and Bonilla-Alicea et al., 2020), which vary a lot according to the 4. Method
definition of the BSS life cycle, the consideration of alternative transit
modes’ carbon factors, and assumptions made about levels of reba This section sets out the goal and scope of the LCA, describes the
lancing activity. While rebalancing operations are often studied as a sources of the data used, and the structure of the calculation for each of
complex mathematical optimization problem, the carbon released by production, operation and disposal respectively. It also sets out the
them is not dealt with as a topic. In fact, few papers have been published limitations of the method and the data used. An important factor for
in Europe about the environmental benefits of using BSS. This study sourcing the data was the fact that one of the authors was seconded three
adds to such existing body of knowledge and represents the first inte days per week over a two-month period to Transport for Edinburgh
grated study of its kind of the LCA impacts of BSS in Europe, addressing (TfE), the organisation ultimately responsible for the BSS, to survey
research gaps such as the inclusion of balancing operations in the LCA, operations, understand procedures and, crucially, to gain access to an
transport involved in manufacturing, and public transport responses to extensive range of data related to the BSS including production-to-
the BSS. maintenance life cycle stages, GPS tracking, and end of life scenarios
for shared bikes.
3. The empirical case: Edinburgh’s bike sharing scheme Just Eat The calculation of carbon emissions is conceived according to Life
Cycles Cycle Assessment process and was supplemented by a street survey in
order to gather primary data from users including one key factor: how
Edinburgh’s third generation BSS Just Eat Cycles was conceived in the user would have made the trip instead, had the BSS not been
2018 by Transport for Edinburgh (TfE), a public sector transport man available.
agement organisation. Just Eat Cycles is operated by the outsourcing
company Serco, under a three-year contract with TfE to implement and 4.1. Life Cycle Assessment (LCA)
manage a new cycle hire scheme. To use a Just Eat Cycles bike, the
process is as follows: The LCA draws up an accounting balance sheet of the relationship
Users are required to buy a pass on the app; a pass costs £1.50 for the between an object/system/organization and the ecosystem surrounding
first hour, each additional 30 min costs £1, a day pass costs £3 and an it: it is a question of counting the resources taken from and the waste put
annual one costs £90. Thanks to the location services of the app, the back into the environment throughout its life. Several essential concepts
closest bike is then identified. After unlocking it, the ride can begin and are explained here, such as the major stages of the life cycle, the func
last for up to 1 h. To return the bike it must be locked at a physical tional unit and a sensitivity analysis.
3L. D’Almeida et al. Sustainable Cities and Society 71 (2021) 103012
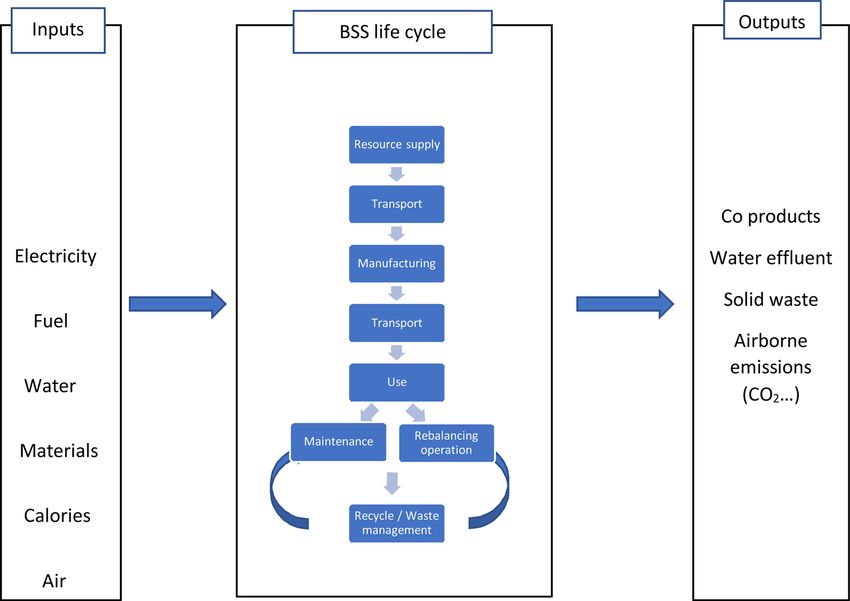
Fig. 1. Inputs, outputs and system boundary of the analysis.
The major stages of the life cycle are resource supply (supply of raw function: here, transporting 1 person over 1 km. Clearly, not all means of
materials, transport), manufacture (transport, construction-installation transport can be equally employed for any distance, for instance if we
process), use (maintenance, repair, replacement, rehabilitation, use of were to evaluate a trip of 500 km there would not be an equivalence of
energy, water during the use stage), end of life (dismantling, transport, choices. However, for the purpose of urban distances, especially in the
waste treatment, disposal), benefits and expenses (possibility of reuse, case of a medium-sized city like Edinburgh, this functional unit allows
recycling). Each of these stages releases greenhouse gases. To quantify for a meaningful comparison of all transportation alternatives. We adopt
the environmental impacts of the BSS, Kgeq. CO2 will be used as a a cradle-to-grave system boundary, from resource supply to end-of-life
reference unit. The majority of greenhouse gas impacts can be expressed activities. Like in every LCA, numerous assumptions are required in
using the Kgeq. CO2 unit of measurement as per the Global Warming terms of input data, and life cycle inventory and these are detailed in the
Potential (GWP) that measures the effect of a greenhouse gas on global following sections.
warming compared to that of carbon dioxide. UK Government (DBEIS,
2019) carbon data is used to calculate carbon impacts. 4.1.2. Inventory of life cycle (ILC)
The LCA of the BSS will relies on ISO 14040 and 14044 (Curran, At different stages of the BSS lifecycle, there are incoming and out
2008). LCA consists of 4 phases: going flows, as shown by the life cycle inventory flowchart in Fig. 1,
below.
- goal and scope definition The lifetime of a Just Eat Cycle is estimated at 5 years according
- life cycle inventory (LCI) Serco, the scheme operator. For this study, primary data comes from the
- life cycle impact assessment (LCIA) first ten months of operation from September 2018, which is then scaled
- interpretation up to a 5 year-period.
4.2. Input data for LCA calculation
4.1.1. Goal and scope
The aim is to establish an approach for evaluating the environmental This section aims to present and explain the construction of the life
impacts of the BSS implemented in Edinburgh in September 2018. This cycle inventory (LCI) behind the carbon calculator for the BSS, to
approach will be applied over a relatively short period in the first explain the inputs, to discuss certain adjustments and to detail the steps
instance of this paper, because the BSS has only been in operation for a in the subsequent calculation. Input data and their source are shown in
short time, but it would be possible to apply the approach over a longer Table 2, below.
period as well, were data to be available. The purpose of this analysis is
to quantify and evaluate the environmental consequences of the 4.2.1. Emissions from production
implementation of the BSS in Edinburgh, with an intent to identify op The carbon emissions related to the production of 1,000 bikes are
portunities for improving the scheme in the future. Our intended audi calculated according to the weight of each material constituting the
ence, in addition to scholars operating in this field, includes the wider bicycle. Carbon factors are then assigned to the materials, factors which
public of the City of Edinburgh as well as key policy- and decision- take into account both the supply of resources, and their transformation:
makers that might benefit from the results of this assessment. The life ∑
cycle analysis method makes it possible to compare the environmental Csupply, manuf = Csupply, manuf , material i ∗ Wmaterial i
impact of the BSS with the use of another means of transport (car, bus, i
tram, motorcycle, personal bike, walking) through the functional unit.
where Csupply, manuf, material i is the carbon released per kg material i for
The functional unit of a product is the combination of a quantity and a
supply and manufacture and i = {’metal’ ; ’plastic’}, Wmaterial i the weight
4L. D’Almeida et al. Sustainable Cities and Society 71 (2021) 103012
Table 2 second in early 2019 in response to the success of the BSS. On the one
Table of the BSS and carbon impacts inputs, carbon factors are extracted from hand, it is assumed that the loading of the truck is at 50 % empty when
DBEIS conversion factor 2019. selecting the carbon factor (favorable case: the way back is used for a
0 – INPUTS Source second delivery). On the other hand, stemming from the supply of bi
Specific to bikes
cycles in two stages, it is necessary to count each trip twice. For the 5-
Number of bikes 1000 TfE data year period calculation, this whole transport operation is included a
Weight of plastic (kg/bike) 6 TfE data second time to replace the 1,000 bikes that have reached their estimated
Weight of metal (kg/bike) 10 TfE data end of life within the period.
Number of batteries 1200 TfE data
Weight of 1 battery (kg) 0.1 TfE data
Bikes’ kilometrage in a 5- 41 668 5 year extrapolation based on data 4.2.2. Emissions from use
year period (km) (1) 650 from TfE for the first year of operation The period of use is the most interesting to explore. The carbon
emissions specific to the operation of the BSS are apparent, while those
Specific to materials constituting the bikes from human activity generated by the physical effort of cycling are less
Metal supply and 4.3 UK Government GHG Conversion
so. Nevertheless, we know that cycling requires some more calories than
manufacturing factor (kg Factors, 2019
CO2/kg)
driving a car or commuting by bus or tram, therefore the carbon foot
Plastic supply and 3.1 UK Government GHG Conversion print of food is worthy of consideration. Scarborough et al. (2014)
manufacturing factor (kg Factors, 2019 studied dietary greenhouse gas emissions of meat-eaters, fish-eaters,
CO2/kg) vegetarians and vegans in the UK. To draw out the average 2,000 cal
Batteries supply and 12 UK Government GHG Conversion
ories carbon emissions from UK food, it was necessary to rebalance the
manufacturing factor (kg Factors, 2019
CO2/kg) results due to a greater number of women taking part in the survey than
Metal closed loop factor (kg 4.31 Bilan GES, ADEME men. With these proportions adjusted, the study found that a standard
CO2/t) UK 2,000 kcal diet releases approximately 4.85 kg CO2e per day.
Plastic closed loop factor (kg 877 Bilan GES, ADEME Knowing that 29.80 calories are needed to cover one km by bike (Har
CO2/t)
Batteries landfill factor (kg 75.492 UK Government GHG Conversion
vard Health Publishing, 2014), it is possible to calculate carbon emis
CO2/t) Factors, 2019 sions based on diet, however that is not the only factor to consider
(Scarborough et al., 2014). Whilst humans need “fuel” from food calo
Specific to transport during manufacturing process ries for exercise, the process is led by the breathing cycle during which
China to London by sea (km) 21975 TfE data & Google Maps the body inhales O2 and exhales CO2, a cycle which is related to the
Container ship factor (kg 0.02 UK Government GHG Conversion
intensity of the activity. While cycling, 10 g of CO2 is released by the
CO2/km/t) Factors, 2019
London to Stratford-upon- 130 TfE data & Google Maps human body per km. Thus, human activity generates carbon emissions
Avon by road (km) as described as follows:
Stratford-upon-Avon to 540 TfE data & Google Maps
Edinburgh by road (km) Chuman activity = [cal ∗ Ccal + Cexh ] ∗ Kbikes
HGV (7,5-17 t) 100% laden 0.71 UK Government GHG Conversion
factor (kg CO2/km) Factors, 2019 where cal are the calories needed to cover 1 km = 29.80 kcal, Ccal are the
4.85
carbon emissions released by one kcal = 2,000 = 2.43 E-3 kg CO2e, Cexh is
Specific to the use (human activity & BSS operation)
Human respiration factor (g 10,000 http://rstudio-pubs-static.s3.ama the carbon emissions exhaled by breath cycle to cover 1 km = 0.01 kg
CO2/km) zonaws.com/11243_3bf3af25db654 CO2e, Kbikes : km travelled by the BSS’ users on a 5-year period = 41 668
09c9a56b85166b54c77.html 650 km
Calories needed for cycling 29.80 Harvard Health Publishing, 2014 The derivation of kilometres travelled over a 5 year-period is
(cal/km)
UK food factor (kg CO2/cal) 0.00243 Scarborough et al., 2014
explained as follows. According Glasgow’s public scheme numbers,
(2) between 2014, the year of launch, and 2019, the number of rentals
Electricity consumption of an 10 U.S Energy Information increased fivefold. Assuming an equivalent growth in use as in Glasgow
average depot (kW/m2/ Administration, 2012 and based on actual data from the 10 first months of operation in
year)
Edinburgh, when 2,314 million km were travelled (Just eat cycles, Trip
Depot’s surface (m2) 360 TfE data
kW factor (kg CO2/kW) (3) 0,26 BEIS, Electricity generation and supply data, 2019)-, then over a 5 year period, usage would follow an arith
figures for Scotland, Wales, Northern metic progression and hit 14,65 million km.
Ireland and England, Energy Trends
Rebalancing operation - 2 209170 TfE data U2018 = 2 777 910; U2019 = 5 555 820; U2020 = 8 333 730; U2021 = 11 111 640;
vans kilometrage (km) U2022 = 13 889 550km
Diesel van factor (kg CO2/ 0.1945 UK Government GHG Conversion
km) Factors, 2019 Whilst the food consumption and breathing impacts of human ac
tivity (cycling) can be calculated as shown above, there is great uncer
tainty about the degree to which these impacts are higher or lower than
of material i
travel on foot, by running, by scooter, car or bus (including walking
This paper uses UK Government data for the emissions impacts of
between bus stop or car parking space and final destination). Thus, ul
plastic, metal and battery production. Other sources such as Cherry,
timately, due to this uncertainty, it was decided not to include food
Weinert, and Xinmiao (2009) and Chen, Zhou, Zhao, Wu, and Wu (2020)
consumption and breathing impacts in the LCA calculations for the BSS
estimate lower emissions impacts for material produced in China; our
compared to other modes of transport.
approach therefore represents a conservative hypothesis for our case.
After 5 years, it is assumed that all the bikes have to be replaced because
4.2.3. Emissions from operation
of vandalism and wear and tear. As a consequence, we consider the
GHG are also released by the organisational operations of the BSS.
production of 2,000 bikes for the scenario over a 5 year-period.
Firstly, through rebalancing operations, which consist of moving some
The components are made in China, then brought by ship and
bikes from one station to another according to demand, and moving
assembled in Stratford-upon-Avon, and finally transported an estimated
malfunctioning and repaired bikes to the depot or back into service;
540 km by road to Edinburgh. It is interesting to note that the fleet of
which is carried out by two vans running on diesel. There is a lack of
1,000 bikes was formed in two stages: the first in September 2018, the
information on the total km travelled by these vans but based on data for
5L. D’Almeida et al. Sustainable Cities and Society 71 (2021) 103012
Table 3 Table 4
Adjusted carbon factor of 1 kW h. Percentage of different life stages of BSS carbon emissions; HA: human activity.
Scotland 2018 Share Carbon factor (kg CO2/ Pro-rated kg CO2/ Life stage % with HA % without HA
kWh) kWh)
1− 3 RESOURCE SUPPLY - MANUFACTURING 1.8 % 33.3 %
Nuclear 28 % 0,006 2− 4 TRANSPORT 0.9 % 14.1 %
Coal 11 % 1,06 0,121811 5 – USE 97.2 % 49.9 %
Other 55 % 0,00642 6 - ENDING LIFE - waste disposal 0.1 % 2.7 %
Renewables
Onshore wind 40 % 0,0127
Hydro 10 % 0,006 as follows:
Offshore wind 5% 0,0148
• Finish the survey before the start of the festival1, if not, adjust the
July 2019, it was estimated that they had travelled 37,000 km from the results according to the proportions of residents and tourists
date of launch of Just Eat Cycles in September 2018, and thus that they observed in the previous period
would travel 210 000 km over a 5-year period. • Vary the hours of observations according to the target audience: for
Secondly, in the depot, electric machines are used to repair me workers, departure for work (8 h–9 h30) and departure from work
chanical spares and computers; furthermore, the offices use heating and (16-17h30), for tourists all day from 9am, for residents doing leisure
the depot requires regular maintenance (US Energy Information activities (after 17h30)
Administration, 2012). Thus, the electric consumption (kWh) resulting • Different days of the week
from the operation of the depot results in carbon emissions from energy • Varied survey locations: few users in the centre would use the car,
generation. In 2018 in Scotland, the electricity generation mix was re but more would in the suburbs.
newables (55 %), nuclear (28 %), gas and oil (17 % (see BEIS, 2019)).
These proportions enable us to calculate the adjusted kW carbon impact The survey took place at BSS stations and users were approached
based on the carbon impact of each mean of energy generation (Table 3). when taking or parking a bike. Each of the 200 BSS’ user surveyed was
Thus, the carbon released through the depot and bikes’ operation is: asked the following about his/her travel:
Cexploitation = Kvans ∗ Cdiesel + Celec ∗ Elecconsumption - Kind of trip (travelling to/from, business, leisure, shopping, school,
sightseeing).
Kvans : kilometrage made by the vans since the launch of the BSS, Cdiesel : - Distance between origin and destination.
carbon released per km by diesel van, Celec : adjusted carbon released per - Alternative mean of transport (car, bus, tram, walking, school, uber/
kW, Elecconsumption : the consumption of electricity by the depot since the taxi, bike).
launch. - Whether they had used their main mode of transport (e.g. train) in
In total, the use period is responsible for the following carbon combination with another means of transport (e.g. bike)?
emissions:
Cuse = Chuman activity + Cexploitation 4.4. Limitations
4.2.4. End of life and disposal The main limitations of the method are as follows. Firstly, not all of
How the end of life of a product is managed depends a lot on the our input data come from the same source. This is due to data re
regional culture for disposal and recycling of waste. In Scotland, steel quirements and availability and the multi-disciplinary nature of our
and aluminum are recycled, plastic too depending on how many times it analysis, which ranges from material manufacturing to breathing cycles
has been reused. Plastic is exported to be recycled which does increase of human activities. Secondly, due to the mixed nature of our data and
the initial carbon impact of the operation; however, this observation is the fact that some of it comes from secondary sources, we are unable to
not taken into account in the calculation due to lack of information: offer a robust evaluation of the overall quality of our input data. In
∑ particular it was not possible for us to source manufacturing GHG data
Cending life = Cending life, material i ∗ Wmaterial i from the province in China where the bikes are manufactured, and so UK
i GHG standard factors were used instead, which is a further limitation.
The greatest empirical uncertainties in the data are the kilometres
Cending life, material i : carbon released per kg of material for ending life
travelled by van rebalancing the bikes around the city; the climate im
treatment i where i = {’metal’ ; ’plastic’}, Wmaterial i : weight of material i pacts of food consumption and activity of the riders compared to if they
travelled by other modes; and the response of the bus company to
reduced demand caused by riders switching from bus to bikeshare.
4.3. Modal shift to BSS and previous modes of transport used
5. Initial results: carbon emissions from the BSS itself
A critical factor for calculating emissions savings from the BSS is the
mode of transport that would have been used in the absence of the Including human activity, the BSS will after the first 5 years of its
scheme. Since the BSS data held by Transport for Edinburgh only covers operation have released 3,630 tonnes of CO2e. Applied to 1 bike, its use
sales, bikes’ condition and GPS tracking, the street survey enables us to constitutes 87 gCO2e/km. Excluding human activity, the BSS will have
understand the circumstances of the users’ journeys on a significant released 195 tonnes of CO2e (the human activity impacts are shown for
sample of 200 individuals of both sex and all ages. It is imperative to reference) (Table 4).
know which mode users would have taken if they had not had access to
the BSS, to calculate the carbon emissions savings resulting from the use
of the scheme.
It was fundamental to establish a diverse and representative sample,
1
The Fringe Festival happens in August each year in Edinburgh for 3 weeks,
when the number of tourists in the city increases enormously.
6L. D’Almeida et al. Sustainable Cities and Society 71 (2021) 103012
5.1. Sensitivity analysis Table 5
Table of the inputs for carbon emissions savings’ calculations, carbon factors are
A sensitivity analysis was carried out to assess the variations in LCA extracted from DEFRA conversion factor 2019.
results through changing stated assumptions and parameters. In each 0 – INPUTS SOURCE
stage of the scheme’s lifecycle, we can observe how carbon emissions Specific to bikes
can fluctuate according to the parameters initially selected. The inclu Number of bikes 1000 TfE data
sion of emissions from human activity involved in cycling, the Bikes’ km travelled since BSS 41 668 TfE data
assumption of a round-trip or one way truck journey for the delivery of launch (km) 650 km
Total BSS carbon emissions (t X this papers’ calculations
the bikes, the variation in km travelled for the balancing operation (if
CO2)
there is optimization or not), the variation of the kWh value according to
how electricity is produced -which varies spatially and through time - Specific to other mode of transport
and finally the way in which waste is managed will all affect the final Share of bus (%) X street survey
result. This section shows the effect of making these variations. Bus carbon factor (kg CO2/ 0.167 Bilan GES, ADEME
km/pass)
Across most impact categories, the environmental intensity of the use
Share of car (%) X street survey
phase is the single most influential variable (97.1 %). Within this, car Car carbon factor (kg CO2/ 0.1733 UK Government GHG Conversion
bon emissions from human activity represent 97.2 % of the use period km) Factors 2019
emissions and therefore 94.5 % of all emissions. Food constitutes 88 % of Share of walking (%) X street survey
human activity emissions; however, the literature review highlighted Walking carbon factor (kg 0
CO2/km)
some of the uncertainties in relation to this factor. As we could not
reliably verify how much more, and of what foods, people eat as a result
of cycling rather than using another mode, this factor was removed from
the final calculation, as was the human breathing cycle, in order to
enable consistent comparison. We could however assume that riding a
shared bike is a significant indirect source of CO2e emissions if up to
416 tonnes of CO2e resulting from human breathing is included. How
ever, if emissions from food and from the breathing cycle are excluded,
riding a Just Eat Cycle bike releases 9.6 g CO2e/km.
A 100 % laden HGV was assumed to make 1 trip (not a round trip) for
the purpose of delivering the bikes from London/Stratford-upon-Avon
and Stratford-upon-Avon/Edinburgh. If no delivery is planned for the
way back, the bikes are assumed to contribute environmentally as per a
round trip. The carbon factor decreases from 0.71 to 0.63 kg CO2/km but
distances are doubled. Emissions from transport during manufacturing
and delivering would thereby increase by 1.7 % and the total emissions
from 200 to 204 tonnes CO2e.
The management of the rebalancing vans is not optimized at the
present time. According to Liu and Sun (2016), mixed integer non-linear
programming (MINLP), nature inspired algorithms (NNIA) and genetic
algorithm (GA) are optimization models for efficient vehicle routing that
Fig. 2. Percentage of different life stages in BSS carbon emissions, excluding
can yield a reduction of up to 3.4 % in travel distances of such operations
human activity.
(Liu, Sun, Chen, & Xiong, 2016; Pal & Zhang, 2017). Today, the 37,
000 km traveled could be at least2 reduced to 35,750 km which would
6. Emissions savings of BSS compared to other modes
save 244 kg CO2e. However, this represents less than 0.1 % of all
emissions. However, based on the intern’s analysis whilst on site with
6.1. Method for carbon emissions savings
the operators, the rebalancing operations are currently so poorly opti
mized that they could be improved by 30 % which would imply a 1%
Based on the BSS total carbon emissions, the total km travelled since
reduction in all emissions.
the launch and the share of alternative mode of transport, the carbon
The kWh carbon factor was calculated based on Scotland’s energy
emissions savings can be calculated as follows:
production infrastructure in order to be as realistic as possible and was
∑
estimated at 0.2550 kg CO2 compared to 0.2556 from UK conversion Cem sav = CBSS − Kbikes ∗ Pi ∗ Ci
factor, assuming no significant variation. i
Product end life management has a relatively small influence on
carbon impact (5.3 %), recycling was selected for metal and plastic CBSS : carbon released by the BSS since its launch, Kbikes : kilometrage
based on shared bike treatment trends, since respectively 71 % and 46.2 made by the BSS users over a 5-year period = 41 668 650 km, Pi : the
% were recycled in 2017 (Department for Environment Food & Rural percentage of alternative mode i’s use where i = {bus’ ;’ car’ ;’ walking’ },
Affairs, 2019). It is interesting to note that the landfill aspect could Ci : carbon released per km by mode i
modify the carbon factor, but no data is available to continue the The inputs are detailed further in Table 5, below.
calculation. One consideration was necessary to calculate the value: the car and
bus carbon factors include manufacturing, use and waste disposal but do
not include the human activity (breathing and food calories) so to
maintain consistency, and as explained earlier, the CBSS value does not
consider carbon emissions from any human physical activity (breathing
or food consumption). It is for this reason that the walking carbon factor
2 is shown as zero in Fig. 2.
We consider here the difference of efficiency between 2 optimization
models but the difference between non-optimized and optimized must be even We have calculated that the carbon emissions of the BSS, excluding
greater. human activity, amount to 200 tonnes, extrapolated over a period of
7L. D’Almeida et al. Sustainable Cities and Society 71 (2021) 103012
Fig. 3. Evolution of the carbon emissions savings through the years, on a 10-month period, 5, 8 and 10 years.
5 years (estimated lifetime of a Just Eat Cycles bike). At the level of the acknowledged that, in the context of all transport in Edinburgh, the BSS
functional unit, a Just Eat cycle releases 9.6 g g CO2e/km, which is 50 only reduces CO2e emissions by 0.5 %, which is small but represents a
times less than an average car with petrol (259 g CO2e/km). According move in the right direction. Other benefits resulting from the BSS should
to Cherry et al. (2009), an individual bike is responsible for 4.7 g also be highlighted: some limited improvement to traffic flow (fewer
CO2e/km and an electric one 31.2 g CO2e/km due in part to the battery cars), improving users’ fitness and creating jobs locally (operating the
management and the materials surplus, thus, the shared bike can be BSS). It is notable that the BSS has proven to be a great success in terms
positioned between the individual bike –at almost the double its LCA of utilization of the bikes in spite of Edinburgh’s mediocre average
carbon emissions - and the electric bike. weather conditions and rugged terrain. However, our analysis has
Moreover, the street survey enabled us to evaluate the proportion of shown that the BSS as a policy intervention to reduce transport related
alternative modes to cycling in the city, based on a diverse sample of 105 CO2e emissions has a small impact relative to other transport emissions
users (workers, students, tourists, etc.): 47 % would have traveled by due to the small number of trips made in comparison to total mobility,
bus, 17 % by car and 36 % on foot, had the BSS not been available. due to the short distances of trips made, and because most trips do not
Assuming that these users travel the average distance for a journey by a transfer from private car. Therefore, it is important for policy-makers to
car, bus or on foot in Scotland, then the carbon emissions savings real have other objectives in mind that they wish to achieve with the
ized by the BSS whole fleet over a 5-year period are estimated at implementation of BSS, and not solely GHG emissions reduction.
4,300 tonnes CO2e, almost the equivalent to a hundred Edinburgh- Whilst the data for this paper are from 2019− 2019, it is also worthy
London journeys by plane of 200 passengers. of note that the 2020 covid-19 crisis seemed help the BSS to flourish to
To estimate the carbon emissions savings, carbon factors were allo the extent that people use public transport less in favour of green indi
cated to alternative modes, including bus where 0.167 kg CO2e/km/ vidual modes of transport. At the same time, vandalism appears to have
passenger was calculated. However, another assumption could be that increased which requires increased maintenance, waste management,
since Edinburgh’s bus company would be highly unlikely to reduce the parts and whole bike manufacturing orders (McPherson, 2017). Also,
number of buses in service in response to the relatively small reduction when bikes are stolen -which occurs more and more frequently-, Serco
in passenger numbers resulting from the BSS, then zero carbon emissions agents have to drive around the city to recover them via geolocation.
savings should be assigned to bus as alternative mode. In this scenario, This consumes additional fuel especially since the routes are
the BSS carbon emissions savings are much lower: 716 tonnes of CO2e. non-optimized. All these operations generate additional carbon emis
Thus, given the difficulty this presents in assuming either zero or sions, but these are not quantified in this paper.
0.167 kg CO2e/km/passenger emissions savings from bus travel, carbon An interesting future research direction is to consider how much the
emissions savings are estimated to vary significantly between the two presence of BSS reduces the need to own a car and therefore reduce the
scenarios, between 716 and 4,300 tonnes. total amount of travel undertaken, and therefore reduce carbon emis
Starting from the 4,300 tonnes for a five year period of operation, it is sions. It would also be worthwhile to estimate by calculation the extent
possible to extrapolate emissions savings over a further five year period. to which rebalancing operations can be optimized regarding the number
Even if it is assumed that over these five years the number of users and of stations and bikes; and to incorporate food and human activity into
the kilometres travelled remain constant, that the BSS continues to emissions savings calculations, rather than just into the emissions cal
replace the same shares of walk, bus and car trips, that each bike is culations for the BSS itself.
replaced and manufactured by an identical process, and that 1.2 batte
ries is the average for one bike, more than 12,000 tonnes CO2e is forecast Funding
to be saved over the first decade of operation, as shown in Fig. 3.
This research did not receive any specific grant from funding
7. Conclusions, policy recommendations and future research agencies in the public, commercial, or not-for-profit sectors.
directions
Declaration of Competing Interest
This paper presents research findings on the environmental impact of
the recently adopted bike sharing scheme Just Eat Cycles in the City of The authors report no declarations of interest.
Edinburgh and demonstrates that it is not negligible (200 t CO2e over
5 years of operation). From a policy point of view, it must be
8L. D’Almeida et al. Sustainable Cities and Society 71 (2021) 103012
Acknowledgements Just eat cycles, Trip data. (2019). Historical data [Data file]. Retrieved from https://edin
burghcyclehire.com/open-data/historical.
Kabak, M., Erbaş, M., Çetinkaya, C., & Özceylan, E. (2018). A GIS-based MCDM approach
The authors would like to acknowledge the non-financial support of for the evaluation of bike-share stations. Journal of Cleaner Production, 201, 49–60.
Transport for Edinburgh (TfE) in providing access to the data and https://doi.org/10.1016/j.jclepro.2018.08.033. ISSN 0959-6526.
research environment for this article. Lacap, J., & Barney, R. (2015). Calculating changes in CO2e emissions as a result of increased
cycling.
Liu, J., Sun, L., Chen, W., & Xiong, H. (2016). Rebalancing bike sharing systems: A multi-
References source data smart optimization. Proceedings of the 22nd ACM SIGKDD International
Conference on Knowledge Discovery and Data Mining, 1005–1014.
BEIS. (2019). Electricity generation and supply figures for Scotland, Wales, Northern Ireland Luo, H., Kou, Z., Zhao, F., & Cai, H. (2019). Comparative life cycle assessment of station-
and England, energy trends (Accessed 22 July 2019) https://scotland.shinyapps.io/s based and dock-less bike sharing systems. Resources, Conservation and Recycling, 146,
g-scottish-energy-statistics/?Section=RenLowCarbon&Subsection=RenElec&Cha 180–189.
rt=ElecGen. McPherson, K. (2017). Glasgow’s public cycle hire scheme: Analysis of usage between July
Bonilla-Alicea, R. J., Watson, B. C., Shen, Z., Tamayo, L., & Telenko, C. (2020). Life cycle 2014 and June 2016 (p. 27). Glasgow Centre for Population Health.
assessment to quantify the impact of technology improvements in bike-sharing Meddin, R. (2019). The bike-sharing world map [ONLINE]. URL: https://www.google.com
systems. Journal of Industrial Ecology, 24(1), 138–148. /maps/d/viewer?ie=UTF8&oe=UTF8&msa=0&mid=1UxYw9YrwT_R3SGsktJ
Campbell, K. B., & Brakewood, C. (2017). Sharing riders: How bikesharing impacts bus U3D-2GpMU (Accessed 15 August 2019).
ridership in New York City. Transportation Research Part A: Policy and Practice, 100, Mi, Z., & Coffman, D. (2019). The sharing economy promotes sustainable societies.
264–282. Nature Communications, 1214. https://doi.org/10.1038/s41467-019-09260-4
Chen, J., Zhou, D., Zhao, Y., Wu, B., & Wu, T. (2020). Life cycle carbon dioxide emissions Midgley, P. (2011). Bicycle-sharing schemes: Enhancing sustainable mobility in urban areas,
of bike sharing in China: Production, operation, and recycling. Resources, 8 pp. 1–12). United Nations: Department of Economic and Social Affairs.
Conservation and Recycling, 162, Article 105011. Murphy, E., & Usher, J. (2015). The role of bicycle-sharing in the city: Analysis of the
Cherry, C. R., Weinert, J. X., & Xinmiao, Y. (2009). Comparative environmental impacts Irish experience. International Journal of Sustainable Transportation, 9(2), 116–125.
of electric bikes in China. Transportation Research Part D: Transport and Environment, Pal, A., & Zhang, Y. (2017). Free-floating bike sharing: Solving real-life large-scale static
14(5), 281–290. rebalancing problems. Transportation Research Part C: Emerging Technologies, 80,
Cost of Living Comparison Between Glasgow, United Kingdom And Edinburgh, United 92–116.
Kingdom. (n.d.). Retrieved 12 May 2020, from https://www.numbeo.com/cost-of-li Ricci, M. (2015). Bike sharing: A review of evidence on impacts and processes of
ving/compare_cities.jsp?country1=United+Kingdom&city1=Glasgow&coun implementation and operation. Research in Transportation Business & Management,
try2=United+Kingdom&city2=Edinburgh. 15, 28–38.
Curran, M. A. (2008). Life-cycle assessment. Encyclopaedia of ecology (pp. 2168–2174). Rosen, P., Cox, P., & Horton, D. (2007). Cycling and society. Transport and society. Ashgate
Elsevier Inci. Five-Volume Set. Pub.
de Chardon, C. M., Caruso, G., & Thomas, I. (2017). Bicycle sharing system ‘success’ Scarborough, P., Appleby, P. N., Mizdrak, A., Briggs, A. D., Travis, R. C., Bradbury, K. E.,
determinants. Transportation Research Part A, Policy and Practice, 100, 202–214. et al. (2014). Dietary greenhouse gas emissions of meat-eaters, fish-eaters,
DeMaio, P. (2009). Bike-sharing: History, impacts, models of provision, and future. vegetarians and vegans in the UK. Climatic Change, 125(2), 179–192.
Journal of Public Transportation, 12(4), 3. Shreya, D. (2010). Life cycle assessment of transportation options for commuters.
Department for Business, Energy & Industrial Strategy (DBEIS). (2019). Conversion Massachusetts Institute of Technology.
factors 2019: Full set. URL: Government of the United Kingdom https://www.gov. US Energy Information Administration, About the Commercial Buildings Energy
uk/government/publications/greenhouse-gas-reporting-conversion-factors-2019. Consumption Survey. (2012). Electricity consumption totals and conditional intensities
Department for Environment Food & Rural Affairs. (2019). UK statistics on waste. URL: by building activity subcategories [Data file]. Retrieved from https://www.eia.gov/co
https://www.gov.uk/government/statistics/uk-waste-data. nsumption/commercial/data/2012/c&e/cfm/pba4.php.
Duffy, A., & Crawford, R. (2013). The effects of physical activity on greenhouse gas Zhang, Y., & Mi, Z. (2018). Environmental benefits of bike sharing: A big data-based
emissions for common transport modes in European countries. Transportation analysis. Applied Energy, 220, 296–301.
Research Part D: Transport and Environment, 19, 13–19. Zhang, L., Zhang, J., Duan, Z., & Bryde, D. (2015). Sustainable bike-sharing systems:
Fishman, E., Washington, S., & Haworth, N. L. (2012). An evaluation framework for Characteristics and commonalities across cases in urban China. Journal of Cleaner
assessing the impact of public bicycle share schemes. Production, 97, 124–133.
Harvard Health Publishing. (2014). Calories burned from different sports. https://www. Zheng, F., Gu, F., Zhang, W., & Guo, J. (2019). Is bicycle sharing an environmental
health.harvard.edu/diet-and-weight-loss/calories-burned-in-30-minutes-of-leisure-a practice? Evidence from a life cycle assessment based on behavioral surveys.
nd-routine-activities. accessed 10/10/2020. Sustainability, 11(6), 1550.
Ibold, S., & Nedopil, C. (2018). The evolution of free-floating bike-sharing in
China–sustainable transport in China. Sustainable Transport in China. Retrieved
August 29, 2019.
9You can also read