State of Ohio Monthly Climate Update - Review - December 2022
←
→
Page content transcription
If your browser does not render page correctly, please read the page content below
State of Ohio
     Monthly Climate Update
     Review – December 2022
a)                                                    Temperature
                                                      After a long stretch of near-normal temperatures, Ohio
                                                      saw both frigid and warm temperatures at the end of
                                                      December. In the month’s first three weeks, temperatures
                                                      generally stayed around 0-2°F above normal until a
                                                      powerful cold front on December 22nd brought substantial
                                                      drops in temperature. Its passage exposed the state to a
                                                      sub-freezing polar airmass in the days surrounding
                                                      Christmas, lasting nearly a week. Soon after, warm air
                                                      traveling from the Gulf of Mexico raised temperatures well
                                                      above normal for the end of the year. Overall,
                                                      temperatures in Ohio averaged around 25-35°F, with
                                                      variability in both directions resulting in averaged
                                                      departures of only 0-2°F less than recent normals (Figs. 1a
b)
                                                      and 1b). Though mostly near the middle, three distinct
                                                      county-level regions in the north and southwest ranked in
                                                      the warmer third of their 128-year record (Fig.2).

     Figure 1a: Average temperature and 1b:
     Departure from Normal for the month of
     December 2022. Data courtesy of the              Figure 2: State of Ohio average temperature ranks by county for December 2022. Courtesy of the
     Midwestern Regional Climate Center               National Centers for Environmental Information (https://www.ncdc.noaa.gov/sotc/).
     (http://mrcc.purdue.edu).

      Provided by the State Climate Office of Ohio, a collaboration of the Byrd Polar and Climate Research Center,
                   Geography Department, and OSU Extension with support from Energent Solutions                                                   1
State of Ohio
Monthly Climate Update
Review – December 2022
a)
Precipitation
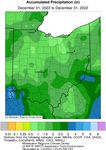
Despite multiple light precipitation events in December,
the majority of Ohio saw less accumulated precipitation
than normal over the month. Most of Ohio received
around 1.5 to 3 inches of liquid-equivalent precipitation,
with a band in the north and west of the state seeing only
0.5 to 1 inches. Additionally, local areas in the far
southwest and southeast received more than 3 inches
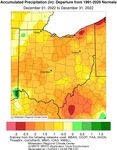
(Fig. 3a). With this, precipitation in nearly all of Ohio
totaled 0.5 to 2 inches less than 30-year normals, with a
small area in the northeast seeing up to 3 inches less.
Only local pockets west of Cincinnati and in the state’s far
northwest received up to 0.5 inches more precipitation
b) than normal (Fig. 3b). Compared to the 128-year record,
nearly every county in the state ranked in the drier third,
with counties in the dry band reaching past the driest ten.
Notably, Lake and Cuyahoga counties saw their second
driest December on record (Fig. 4).
Figure 3a: Accumulated precipitation and
3b: Departures from Normal for the month
of December 2022. Data courtesy of the
Midwestern Regional Climate Center Figure 4: State of Ohio precipitation ranks by county for December 2022. Courtesy of the National
(http://mrcc.purdue.edu). Centers for Environmental Information (https://www.ncdc.noaa.gov/sotc/).
Provided by the State Climate Office of Ohio, a collaboration of the Byrd Polar and Climate Research Center,
Geography Department, and OSU Extension with support from Energent Solutions 2State of Ohio
Monthly Climate Update
Review – December 2022
a) Soil and Energy
Below-average precipitation in December
resulted in continuation of below average soil
moisture at the end of the month throughout
Ohio. At both 0-40cm and 0-200cm levels, the
northwest half of the state recorded very dry soil
moisture percentiles at the end of December,
with the southeast recording slightly improved,
but still dry moisture levels (Figs. 5a and 5b).
Despite persistent dry conditions, dormant
vegetation and lack of many active crops
b) combined with multiple small-scale precipitation
events in December resulted in minimal impacts
in Ohio outside of some slow stream flow levels.
Despite the extended cold spell near Christmas,
heating degree days (HDDs) remained close to
expectations in December, with the northern half
of Ohio seeing slightly fewer than the south. No
cooling degree days (CDDs) were recorded
despite the above-average temperatures
experienced at the end of the month (Fig. 6).
Figure 5a: 0-40 cm and 5b: 0-200 cm soil moisture percentile across the region at the
end of December. Courtesy of NASA SPoRTLIS
(https://weather.msfc.nasa.gov/sport/case_studies/lis_IN.html).
Figure 6: (Left) December 2022 heating & cooling degree days.
(Right) Corresponding Ohio Climate Divisions. Data courtesy of
the Midwestern Regional Climate Center
(http://purdue.mrcc.edu).
Provided by the State Climate Office of Ohio, a collaboration of the Byrd Polar and Climate Research Center,
Geography Department, and OSU Extension with support from Energent Solutions 3State of Ohio
Monthly Climate Update
Review – December 2022
Notable Events
After a relatively calm and consistent
first half of December, Ohio finished off
the month with swings towards both
temperature extremes. In the evening of
December 22nd, Ohio experienced the
passage of an unusually powerful cold
front, which broke records by dropping
temperatures by up to 40°F in six hours,
resulting in an extended period of
temperatures 15-25°F below normal
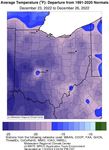
(Fig. 7). Temperatures approaching zero,
wind chills far into the negatives, and
widespread icing left by the flash freeze
combined with snow and winds created
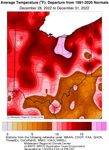
hazardous conditions for those Figure 7: Average temperature departure on December 23rd-26th (above) and Figure 8:
travelling during the holiday season. Average temperature departure on December 28th-31st, 2022 (below) from 1991-2020
normals across Ohio. Data courtesy of the Midwestern Regional Climate Center
(http://mrcc.purdue.edu).
In stark contrast, the approach of an
additional low-pressure system in the
following days forced warm air from the
Gulf of Mexico up into the Midwest,
gradually raising temperatures in Ohio
and resulting in average temperature
departures of 5-17°F above normal in
the final days of the year (Fig. 8). While
the rapid change in conditions allowed
for the quick clearing of ice and snow
from roads before the New Year, pipes
that had burst during the freezing event
promptly began leaking water as
temperatures reached well above
freezing, resulting in instances of water
damage throughout the state.
Provided by the State Climate Office of Ohio, a collaboration of the Byrd Polar and Climate Research Center,
Geography Department, and OSU Extension with support from Energent Solutions 4State of Ohio
Monthly Climate Update
Forecast: Jan-Mar 2023
a) Looking Ahead
The Climate Prediction Center’s 3-month outlook
shows probabilities of above-average temperature
and precipitation in Ohio over the first quarter of
2023. While somewhat uncertain, the
southeastern half of the state has a slight
probability of above normal temperatures, with
the northwest having equal chances of higher or
lower than average temperatures (Fig. 9a).
Meanwhile, the entire state is predicted to have
above-average precipitation in the following
months, with the northwestern half having the
highest probability (Fig. 9b). As the winter season
continues through the beginning of the year,
b)
greater precipitation may result in a higher
frequency of disruptive weather. On the other
hand, above normal precipitation will be effective
at helping to relieve dry soil and drought
conditions that have persisted throughout the
state.
Note: these outlooks do not provide the quantity of
above or below normal conditions,
just the likelihood of occurrence (i.e.,
the probability).
Figure 9a: Nationwide Seasonal Temperature and 9b: Precipitation Outlook
for January-March. Courtesy of the Climate Prediction Center
(https://www.cpc.ncep.noaa.gov/).
Authors:
Jacob L. Fields Geddy R. Davis Aaron B. Wilson
Atmospheric Sciences Undergraduate Meteorologist/Atmospheric Scientist State Climate Office of Ohio
Student Assistant: Climate Services Program Coordinator: Climate Services Byrd Polar and Climate Research Center
Byrd Polar and Climate Research Center Byrd Polar and Climate Research Center OSU Extension
The Ohio State University The Ohio State University The Ohio State University
fields.609@osu.edu davis.5694@osu.edu wilson.1010@osu.edu
Provided by the State Climate Office of Ohio, a collaboration of the Byrd Polar and Climate Research Center,
Geography Department, and OSU Extension with support from Energent Solutions 5You can also read


