State of Ohio Monthly Climate Update
←
→
Page content transcription
If your browser does not render page correctly, please read the page content below
State of Ohio
     Monthly Climate Update
     Review – February 2023
a)                                                    Temperature
                                                      Temperatures in February were defined by their variability,
                                                      as Ohio experienced multiple unseasonable days with
                                                      maximum temperatures in the upper 60’s to lower 70’s
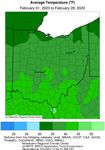
                                                      throughout the month. Overall, these fluctuations mostly
                                                      resulted in average temperatures of 35-45°F, with far
                                                      northern Ohio seeing averages of only 30-35 °F (Fig. 1a).
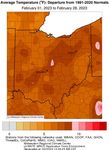
                                                      Warm spikes contributed to average temperature
                                                      departures of 6-9°F higher than 30-year normals, with a
                                                      small area northeast of Columbus seeing temperatures
                                                      10°F higher than normal (Fig. 1b). At the county level,
                                                      every Ohio county ranked within their 4th warmest
                                                      February in the 129-year record, with Knox, Licking, and
                                                      Lawrence Counties seeing their warmest February on
b)
                                                      record (Fig. 2).

      Figure 1a: Average temperature and 1b:
      Departure from Normal for the month of
      February 2023. Data courtesy of the             Figure 2: State of Ohio average temperature ranks by county for February 2023. Courtesy of the
      Midwestern Regional Climate Center              National Centers for Environmental Information (https://www.ncdc.noaa.gov/sotc/).
      (http://mrcc.purdue.edu).

      Provided by the State Climate Office of Ohio, a collaboration of the Byrd Polar and Climate Research Center,
                   Geography Department, and OSU Extension with support from Energent Solutions                                                    1
State of Ohio
Monthly Climate Update
Review – February 2023
a)
Precipitation
While February saw the finalization of drought removal in
Ohio, sporadic precipitation in the month resulted in
varied accumulation in the state. Most of Ohio’s
midsection received 0.5-3 inches of accumulated
precipitation in February, while northwest and far
southern portions of the state saw up to 5 inches (Fig.
3b). This resulted in the bulk of Ohio seeing negative
departures from 30-year normals, ranging from 0-2 inches
less accumulation than normal. Conversely, the
northwestern and southern regions saw 0-3 inches more
accumulated precipitation than normal (Fig. 3b). At the
county level, the state was split into three parts, with the
b) northwest ranking wetter, the southeast ranking drier,
and the southwest through northeast, as well as the
south ranking near 129-year normals for February. The
northwest saw the greatest departures, with widespread
rankings in the top ten wettest Februarys (Fig. 4).
Figure 3a: Accumulated precipitation and
3b: Departures from Normal for the month
of February 2023. Data courtesy of the
Midwestern Regional Climate Center Figure 4: State of Ohio precipitation ranks by county for February 2023. Courtesy of the National
(http://mrcc.purdue.edu). Centers for Environmental Information (https://www.ncdc.noaa.gov/sotc/).
Provided by the State Climate Office of Ohio, a collaboration of the Byrd Polar and Climate Research Center,
Geography Department, and OSU Extension with support from Energent Solutions 2State of Ohio
Monthly Climate Update
Review – February 2023
a) Soil and Energy
Although mostly dry throughout the month, the
passage of a strong storm system on February
27th resulted in saturated soil close to the surface
at the end of February. At the 0-40cm level, soil
moisture was moderating throughout the state
on the last day of the month, though the events
of the previous day were very influential (Fig.
5a). The 0-200cm level, which is a deeper cross
section of the soil near the surface, was less
affected by the precipitation, as moisture
b) gradually moves downward through the soil over
time. As such, this level saw the driest soil
moisture in portions of Ohio’s western half, with
the northeast seeing more moderate moisture at
the end of the month (Fig. 5b).
Numerous warm spikes resulted in significantly
less heating degree days (HDDs) than normal in
February, with consistent departures throughout
Ohio. Despite occasionally reaching the lower
70’s, no cooling degree days (CDDs) were
recorded in the state, agreeing with historical
normals for February (Fig. 6).
Figure 5a: 0-40 cm and 5b: 0-200 cm soil moisture percentile across the region at the
end of February. Courtesy of NASA SPoRTLIS
(https://weather.msfc.nasa.gov/sport/case_studies/lis_IN.html).
Figure 6: (Left) February 2023 heating & cooling degree days.
(Right) Corresponding Ohio Climate Divisions. Data courtesy of
the Midwestern Regional Climate Center
(http://purdue.mrcc.edu).
Provided by the State Climate Office of Ohio, a collaboration of the Byrd Polar and Climate Research Center,
Geography Department, and OSU Extension with support from Energent Solutions 3State of Ohio
Monthly Climate Update
Review – February 2023
Notable Events
On February 27, the passage of a strong
low-pressure system through the Great
Lakes produced severe weather across
the western, southern, and central parts
of the state. Average high temperatures
in the upper 50s and lower 60s
throughout Ohio combined with ample
low-level moisture allowed for
widespread thunderstorm development,
resulting in numerous damaging wind
and hail reports, as well as two
confirmed EF1 tornadoes in the towns
Figure 7: Statewide severe weather reports for February 27, 2023, including damaging
of Middletown and New Carlisle and winds, hail, and tornadoes (above) and Figure 8: Accumulated Precipitation on February
two EF0 tornadoes in Orient and Etna 27, 2023 (below). Data courtesy of National Weather Service Local Storm Report archive,
accessed via Iowa Environmental Mesonet (https://mesonet.agron.iastate.edu/), and the
Township near Pataskala (Fig. 7). The Midwestern Regional Climate Center (http://mrcc.purdue.edu).
storm also delivered up to 1 inch of
accumulated precipitation to much of
the northern half of the state,
constituting the wettest day of the
month for Columbus (Fig. 8). This event
was notable not just for its severity, but
because tornado-producing storms are
very unusual in Ohio during February,
with less than 2% of all tornado events
in the state since 1950 having occurred
in this timeframe.
Provided by the State Climate Office of Ohio, a collaboration of the Byrd Polar and Climate Research Center,
Geography Department, and OSU Extension with support from Energent Solutions 4State of Ohio
Monthly Climate Update
Forecast: Mar-May 2023
a) Looking Ahead
The CPC’s 3-month outlook further maintains
predictions of higher temperature and
precipitation in Ohio through May. The
entire state has a slight probability of above-
normal temperatures in the coming months,
though confidence is relatively low (Fig. 9a).
Although previous warm temperatures in February
have currently transitioned to a cool snap so far
in March, above-normal temperatures may return
in the April timeframe after the last vestiges of
winter present themselves. Warming trends will
also be noticed as day-length continues to
increase.
b)
Along with most of the Midwest and northern
Appalachians, Ohio has a high probability of
above-normal precipitation through May (Fig. 9b).
In transitioning to the warm season, a
continuation of an active pattern in Ohio is
expected to bring more rain producing events, as
well as potentially impactful storms as spring
progresses.
Note: these outlooks do not provide the quantity of
above or below normal conditions,
just the likelihood of occurrence (i.e.,
Figure 9a: Nationwide Seasonal Temperature and 9b: Precipitation Outlook the probability).
for March-May. Courtesy of the Climate Prediction Center
(https://www.cpc.ncep.noaa.gov/).
Authors:
Jacob L. Fields Geddy R. Davis Aaron B. Wilson
Atmospheric Sciences Undergraduate Meteorologist/Atmospheric Scientist State Climate Office of Ohio
Student Assistant: Climate Services Program Coordinator: Climate Services Byrd Polar and Climate Research Center
Byrd Polar and Climate Research Center Byrd Polar and Climate Research Center OSU Extension
The Ohio State University The Ohio State University The Ohio State University
fields.609@osu.edu davis.5694@osu.edu wilson.1010@osu.edu
Provided by the State Climate Office of Ohio, a collaboration of the Byrd Polar and Climate Research Center,
Geography Department, and OSU Extension with support from Energent Solutions 5You can also read


