SIA Group Analysts/Media Briefing - 1H FY21/22 - Singapore ...
←
→
Page content transcription
If your browser does not render page correctly, please read the page content below

SIA Group
                                                                                                                                                    Analysts/Media Briefing
                                                                                                                                                         1H FY21/22
                                                                                                                                                               (ended 30 September 2021)

                                                                                                                                                                           12 November 2021

The copyright in this material (other than in respect of information from external sources) is owned by Singapore Airlines Ltd. Singapore Airlines Ltd has not independently verified the information from external sources. This material may
not be modified, reproduced, distributed, republished or transmitted in whole or in part in any manner or by any means without prior permission of Singapore Airlines Ltd.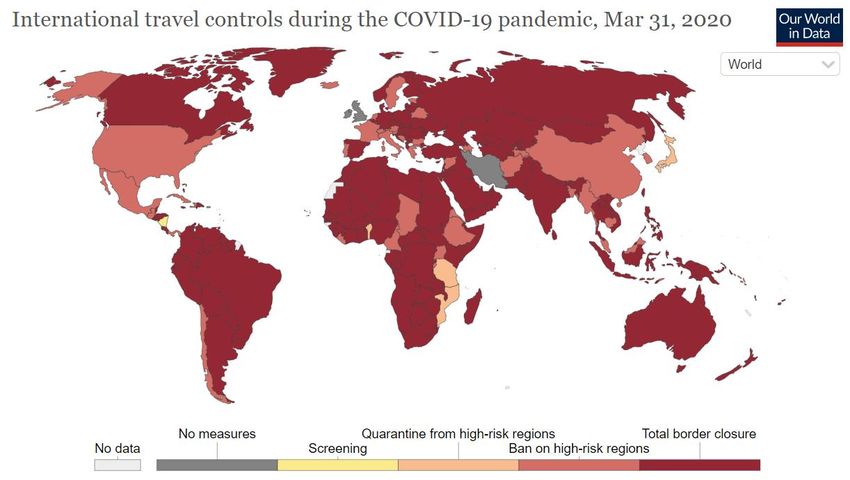
PRESENTATION BY:

                                                        EXECUTIVE VICE PRESIDENT
                                                           FINANCE & STRATEGY

                                                                                   MR. TAN KAI PING

The copyright in this material (other than in respect of information from external sources) is owned by Singapore Airlines Ltd. Singapore Airlines Ltd has not independently verified the information from external sources. This material may
not be modified, reproduced, distributed, republished or transmitted in whole or in part in any manner or by any means without prior permission of Singapore Airlines Ltd.
Group Financial Results
 Key Takeaways – 1H FY21/22 Results

  1H net loss of $837 million, an improvement of $2,630 million YoY (+75.9%), driven by:
  ▪ Better operating performance ($1,244 million)
  ▪ Absence of $1,449 million aircraft impairment charges taken last year

  1H operating loss of $619 million, an improvement of $1,244 million YoY (+66.8%):
  ▪ Excluding hedging ineffectiveness and fair value gain/loss on fuel derivatives, underlying operating loss improved by $601 million YoY
     (+46.3%), driven by improvement in passenger performance and record high cargo revenue

  Quarter-on-quarter, operating loss higher by $71 million (-25.7%):
  ▪ Underlying operating loss marginally higher by $6 million (-1.7%)

  Monthly operating cashflows near break-even

  Stronger passenger business outlook with international border openings and travel corridors

                                                                                                                   Slide 2
The copyright in this material (other than in respect of information from external sources) is owned by Singapore Airlines Ltd. Singapore Airlines Ltd has not independently verified the information from external sources. This material may
not be modified, reproduced, distributed, republished or transmitted in whole or in part in any manner or by any means without prior permission of Singapore Airlines Ltd.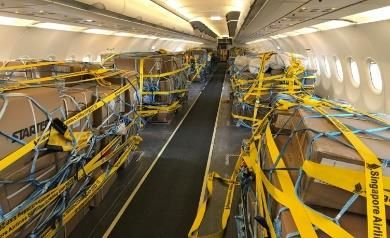
Group Operating Statistics
 Calibrated capacity recovery continues

 % vs
 Pre-Covid
 (Jan’20)                                                                                                                                                                                                                            ASK
          70.0%
                                                                                                                                                                                              62.8%
                                                                                                                                                                                                                                    1H YoY
          60.0%                                                                                                                                                56.8%
                                                                                                                                                                                                                                     5.4x
                                                                                                                                                                                                                                   Q2 vs Q1
                                                                                                 49.3%
          50.0%                                                                                                                 47.4%
                                                                                                                                                                                                       43.6%
                                                                                                                                                                                                                                    +21.5%
                                                                  41.3%
                                   38.7%                                                                                                                               37.9%
          40.0%
                                                                                                                                        31.1%                                         32.2%
          30.0%                                                                                           26.7%                                        26.5%
                                                                                                                        21.2%
          20.0%                             16.5%
                                                                          19.6%                                                                                                                                                 Overall CTK
                                                                                         13.6%
                                                                                                                                                                                                                                  1H YoY
          10.0%
                             3.8%
                                                            7.1%                                                                                                                                                                 +125.9%
             0.0%
                                                                                                                                                                                                                                 Q2 vs Q1
                              Q1 FY20/21                     Q2 FY20/21                     Q3 FY20/21                     Q4 FY20/21                     Q1 FY21/22                     Q2 FY21/22                              +15.1%
                                                    Pax Capacity - ASK                       Cargo Capacity - CTK                          Overall Capacity - CTK

                                                                                                                   Slide 3
The copyright in this material (other than in respect of information from external sources) is owned by Singapore Airlines Ltd. Singapore Airlines Ltd has not independently verified the information from external sources. This material may
not be modified, reproduced, distributed, republished or transmitted in whole or in part in any manner or by any means without prior permission of Singapore Airlines Ltd.
Group Financial Results

                                                                   1H      1H    Better/                                                 Better/                     Q2                         Q1                       Better/                 Better/
                                                                 FY21/22 FY20/21 (Worse)                                                 (Worse)                   FY21/22                    FY21/22                    (Worse)                 (Worse)
                                                                  ($’M)   ($’M)   ($’M)                                                    (%)                      ($’M)                      ($’M)                      ($’M)                    (%)
Total Revenue                                                     2,826.9                 1,634.4                 1,192.5                  73.0%                    1,532.5                    1,294.4                     238.1                 18.4%

Total Expenditure                                                 3,446.3                 3,497.3                   51.0                   1.5%                     1,877.5                    1,568.8                   (308.7)                 (19.7)%
-- Net fuel cost                                                   810.2                   376.0                   (434.2)               (115.5)%                    450.1                      360.1                     (90.0)                  (25.0)%
      Fuel cost (before hedging)                                     862.0                   218.4                 (643.6)                    n.m.                     489.3                     372.7                    (116.6)                (31.3)%
      Fuel hedging (gain)/loss                                       (51.8)                  157.6                  209.4                     n.m.                     (39.2)                    (12.6)                     26.6                   n.m.
-- Fuel hedging ineffectiveness                                           -                  461.8                   461.8                    n.m.                          -                          -                         -                  -
-- Fair value (gain)/loss on fuel                                    (78.8)                  101.8                   180.6                    n.m.                      (7.0)                    (71.8)                     (64.8)               (90.3)%
  derivatives
-- Non-fuel expenditure                                            2,714.9                  2,557.7                (157.2)                  (6.1)%                    1,434.4                   1,280.5                   (153.9)                (12.0)%

Operating Loss                                                    (619.4)               (1,862.9) 1,243.5                                     66.8                   (345.0)                   (274.4)                     (70.6)                (25.7)%

Net Loss                                                          (836.8)               (3,467.0) 2,630.2                                     75.9                   (427.6)                   (409.2)                     (18.4)                (4.5)%

                                                                                                                   Slide 4
The copyright in this material (other than in respect of information from external sources) is owned by Singapore Airlines Ltd. Singapore Airlines Ltd has not independently verified the information from external sources. This material may
not be modified, reproduced, distributed, republished or transmitted in whole or in part in any manner or by any means without prior permission of Singapore Airlines Ltd.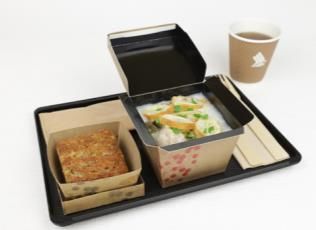
Group Revenue
 Growth driven by improvement in passenger flown revenue and strong cargo performance

                                                                     Group Revenue ($’M)

                                                                                                                                                                                                                     1H FY21/22
                                                                                                                                                                       1,532.5
                                                                                                                                                                                                                      $2,826.9M
                                                                                                                                         1,294.4
                                                                                                           1,114.8
                                                                                                                                                                                                                             YoY
                                                                             1,066.7
                                                                                                                                                                                                                           $1,192.5M
                  850.6
                                                 783.8                                                                                                                                                                     (+73.0%)

                                                                                                                                                                                                                             QoQ
                                                                                                                                                                                                                            $238.1M
                                                                                                                                                                                                                           (+18.4%)
                 Q1                             Q2                            Q3                            Q4                            Q1                            Q2
               FY20/21                        FY20/21                       FY20/21                       FY20/21                       FY21/22                       FY21/22

                                                                                                                   Slide 5
The copyright in this material (other than in respect of information from external sources) is owned by Singapore Airlines Ltd. Singapore Airlines Ltd has not independently verified the information from external sources. This material may
not be modified, reproduced, distributed, republished or transmitted in whole or in part in any manner or by any means without prior permission of Singapore Airlines Ltd.
Group Revenue
Growth driven by higher passenger flown revenue and strong cargo performance
Revenue Breakdown from Key Contributors
(% vs pre-Covid Q3 FY19/20^)
Revenue Breakdown for 1H FY21/22
Record
1,200 High
Pax Flown
Revenue 191.0%
1,000
26.6% $752.9M 167.6%
Cargo & (+$597.6M, n.m.)
Mail 800 138.7%
$1,874.9M
($’mil)
(+$635.1M, +51.2%) 7.1% 600
11.9%
9.5% 8.7%
66.3% Engineering 400
Services & Others 35.3%
$199.1M 200
15.3% 34.4%
(-$40.2M, -16.8%)
0
Passenger Flown Cargo & Mail Engineering Services
Revenue and others
Q4 FY20/21 Q1 FY21/22 Q2 FY21/22
^ Q3 FY19/20 was the last full quarter prior to the onset of Covid-19
Slide 6
The copyright in this material (other than in respect of information from external sources) is owned by Singapore Airlines Ltd. Singapore Airlines Ltd has not independently verified the information from external sources. This material may
not be modified, reproduced, distributed, republished or transmitted in whole or in part in any manner or by any means without prior permission of Singapore Airlines Ltd.Group Expenditure
YoY improvement in 1H driven by the absence of hedging ineffectiveness and FV gain vs loss on fuel derivatives
Group Expenditure ($’M)
1,887.4 1,877.5
1H FY21/22
$3,446.3M
YoY
1,609.9
1,568.8 $51.0M
1,433.6 (-1.5%)
1,397.5
QoQ
$308.7M
(+19.7%)
Q1 Q2 Q3 Q4 Q1 Q2
FY20/21 FY20/21 FY20/21 FY20/21 FY21/22 FY21/22
Slide 7
The copyright in this material (other than in respect of information from external sources) is owned by Singapore Airlines Ltd. Singapore Airlines Ltd has not independently verified the information from external sources. This material may
not be modified, reproduced, distributed, republished or transmitted in whole or in part in any manner or by any means without prior permission of Singapore Airlines Ltd.Group Expenditure
On an adjusted basis, expenditure up due to higher net fuel costs and higher non-fuel costs with more flying
Group Expenditure ($’M) – Adjusted
(Excluded fuel hedging ineffectiveness
and fair value gain/loss on fuel derivatives)
1,884.5
1H FY21/22
$3,525.1M
1,632.2 1,640.6 YoY
1,548.5 $591.4M
1,510.0
1,423.7
(+20.2%)
QoQ
$243.9M
(+14.9%)
Q1 Q2 Q3 Q4 Q1 Q2
FY20/21 FY20/21 FY20/21 FY20/21 FY21/22 FY21/22
Slide 8
The copyright in this material (other than in respect of information from external sources) is owned by Singapore Airlines Ltd. Singapore Airlines Ltd has not independently verified the information from external sources. This material may
not be modified, reproduced, distributed, republished or transmitted in whole or in part in any manner or by any means without prior permission of Singapore Airlines Ltd.Group Expenditure
Higher net fuel cost and non-fuel expenditure on increased flying activities
1H FY21/22
$3,525.1M
YoY
$591.4M
(+20.2%)
^ Based on group expenditure excluding fuel hedging ineffectiveness and fair value gain or loss on fuel hedging derivatives
Slide 9
The copyright in this material (other than in respect of information from external sources) is owned by Singapore Airlines Ltd. Singapore Airlines Ltd has not independently verified the information from external sources. This material may
not be modified, reproduced, distributed, republished or transmitted in whole or in part in any manner or by any means without prior permission of Singapore Airlines Ltd.Net Fuel Cost 1H FY21/22
Net fuel cost up due to higher fuel prices and volume uplifted, partially mitigated by hedging gain and forex
Group Fuel Cost Analysis ($’M)
+436.3 -209.4
-36.0
810.2
Hedging Weaker
+243.3 gain vs USD
loss against +$434.2M
Higher SGD (+115.5%)
weighted
376.0 average
fuel price
Higher
uplift
1H FY20/21 Volume Price Hedging Exchange 1H FY21/22
Slide 10
The copyright in this material (other than in respect of information from external sources) is owned by Singapore Airlines Ltd. Singapore Airlines Ltd has not independently verified the information from external sources. This material may
not be modified, reproduced, distributed, republished or transmitted in whole or in part in any manner or by any means without prior permission of Singapore Airlines Ltd.Group Operating Loss
Operating loss for 1H reduced YoY, but higher QoQ
Group Operating Loss ($’M)
1H FY21/22
-$619.4M
-318.8
-274.4 YoY
-330.8 -345.0
$1,243.5M
(+66.8%)
-826.1
QoQ
-1,036.8
$70.6M
(-25.7%)
Q1 Q2 Q3 Q4 Q1 Q2
FY20/21 FY20/21 FY20/21 FY20/21 FY21/22 FY21/22
Slide 11
The copyright in this material (other than in respect of information from external sources) is owned by Singapore Airlines Ltd. Singapore Airlines Ltd has not independently verified the information from external sources. This material may
not be modified, reproduced, distributed, republished or transmitted in whole or in part in any manner or by any means without prior permission of Singapore Airlines Ltd.Group Operating Loss (Underlying)
Underlying operating loss for 1H reduced YoY, but marginally higher QoQ
Underlying Group Operating Loss ($’M)
(Excluded fuel hedging ineffectiveness and
FV gain/loss on fuel derivatives)
1H FY21/22
-$698.2M
YoY
$601.1M
-346.2 -352.0 (+46.3%)
-481.8
-517.4
-573.1 QoQ
$5.8M
-726.2 (-1.7%)
Q1 Q2 Q3 Q4 Q1 Q2
FY20/21 FY20/21 FY20/21 FY20/21 FY21/22 FY21/22
Slide 12
The copyright in this material (other than in respect of information from external sources) is owned by Singapore Airlines Ltd. Singapore Airlines Ltd has not independently verified the information from external sources. This material may
not be modified, reproduced, distributed, republished or transmitted in whole or in part in any manner or by any means without prior permission of Singapore Airlines Ltd.Group Operating Loss
Operating loss narrowed mainly on improvement in flown revenue and absence of fuel hedging ineffectiveness
Group Operating Loss ($’M)
+180.6
+461.8
+635.1
FV gain
-197.4 -619.4
vs loss
last year
Largely:
• Higher landing,
+597.6 -434.2 Absence of fuel parking & +$1,243.5M
hedging overflying (+66.8%)
Higher Higher ineffectiveness charges (-108.8)
cargo net fuel which was • Handling charges
flown cost recorded last (-108.1)
revenue year • Higher staff costs
(-86.7)
Higher • Lower
-1,862.9
pax flown depreciation
revenue (+135.2)
1H FY20/21 Pax flown Cargo flown Net fuel Fuel hedging FV gain on fuel Others 1H FY21/22
rev rev cost ineffectiveness derivatives
Slide 13
The copyright in this material (other than in respect of information from external sources) is owned by Singapore Airlines Ltd. Singapore Airlines Ltd has not independently verified the information from external sources. This material may
not be modified, reproduced, distributed, republished or transmitted in whole or in part in any manner or by any means without prior permission of Singapore Airlines Ltd.Operating Results for the Main Companies of the Group
All major entities recorded lower losses YoY
1H 1H Better/ Better/ Q2 Q1 Better/ Better/
FY21/22 FY20/21 (Worse) (Worse) FY21/22 FY21/22 (Worse) (Worse)
($’M) ($’M) $M (%) ($’M) ($’M) $M (%)
Full-service carrier* (386.5) (1,424.7) 1,038.2 72.9 (233.9) (152.6) (81.3) (53.3)
Low-cost carrier (217.0) (413.7) 196.7 47.5 (103.2) (113.8) 10.6 9.3
SIAEC Group (6.7) (24.6) 17.9 72.8 (3.8) (2.9) (0.9) (31.0)
* Includes results for SIA and SilkAir
Slide 14
The copyright in this material (other than in respect of information from external sources) is owned by Singapore Airlines Ltd. Singapore Airlines Ltd has not independently verified the information from external sources. This material may
not be modified, reproduced, distributed, republished or transmitted in whole or in part in any manner or by any means without prior permission of Singapore Airlines Ltd.Group Net Loss
Net losses significantly lower YoY but slightly higher QoQ
Group Net Loss ($’M)
1H FY21/22
-141.8 -$836.8M
-409.2 -427.6
-661.9
YoY
$2,630.2M
-1,123.3 (+75.9%)
QoQ
$18.4M
-2,343.7 (-4.5%)
Q1 Q2 Q3 Q4 Q1 Q2
FY20/21 FY20/21 FY20/21 FY20/21 FY21/22 FY21/22
Slide 15
The copyright in this material (other than in respect of information from external sources) is owned by Singapore Airlines Ltd. Singapore Airlines Ltd has not independently verified the information from external sources. This material may
not be modified, reproduced, distributed, republished or transmitted in whole or in part in any manner or by any means without prior permission of Singapore Airlines Ltd.Group Net Loss
Lower net loss mainly driven by better operating performance and absence of non-cash items recorded last year
+127.0 -181.8
+170.4
-73.3 +11.3
+1,333.1
Largely due to
Related to absence of -836.8
when SIA impairment of
gained aircraft leased
control of to NokScoot
Tiger (+115.5)
Airways
+1,243.5 +$2,630.2M
(+75.9%)
-3,467.0
1H FY20/21 Better Absence of Absence of Absence of Taxation Net finance Others 1H FY21/22
Operating impairment impairment NokScoot charges
Performance of surplus of goodwill liquidation
aircraft
Slide 16
The copyright in this material (other than in respect of information from external sources) is owned by Singapore Airlines Ltd. Singapore Airlines Ltd has not independently verified the information from external sources. This material may
not be modified, reproduced, distributed, republished or transmitted in whole or in part in any manner or by any means without prior permission of Singapore Airlines Ltd.Group Financial Position
As at 30 September 2021 As at 31 March 2021
Total assets ($’M) 44,366.9 37,581.3
Total debt ($’M) 15,069.2 14,336.9
Total cash and bank balances ($’M) 12,529.6 7,783.0
Total liabilities ($’M) 22,031.8 21,303.2
Equity attributable to Owners of the Company ($’M) 21,956.9 15,905.9
Debt: Equity ratio (times)R1 0.69 0.90
Net Asset Value Per Share ($)R2 7.40 5.36
Adjusted Net Asset Value Per Share ($)R3 3.33 3.60
R1 Total debt : equity ratio is total debt divided by equity attributable to owners of the Company.
R2 Net asset value per share is computed by dividing equity attributable to owners of the Company by the number of ordinary shares in issue less
treasury shares.
R3 Adjusted net asset value per share is computed by dividing equity attributable to owners of the Company by the number of ordinary shares in issue
less treasury shares, assuming the conversion of all mandatory convertible bonds and convertible bonds.
Slide 17
The copyright in this material (other than in respect of information from external sources) is owned by Singapore Airlines Ltd. Singapore Airlines Ltd has not independently verified the information from external sources. This material may
not be modified, reproduced, distributed, republished or transmitted in whole or in part in any manner or by any means without prior permission of Singapore Airlines Ltd.Group Fleet Development
Net increase of 15 aircraft by end of FY21/22
Operating Fleet As at 30 September 2021 In Out As at 31 March 2022
SIA 777-300ER 23 23
A380-800 12 12
A330-300 - -
A350-900 56 +2 58
787-10 15 +5 20
737-800 9 9
737-8 MAX 6 +1^ 7
747-400F 7 7
Total 128 +8 136
Scoot 787-8 10 +2 12
787-9 10 10
A320ceo 21 21
A320neo 5 5
A321neo 4 +5 9
Total 50 +7 57
GROUP TOTAL 178 +15 193
^ During 2H FY21/22, SIA expects to take delivery of eight 737-8 MAX aircraft, of which one will enter into service by the end of the FY21/22
and the rest will enter service during the course of FY22/23.
Slide 18
The copyright in this material (other than in respect of information from external sources) is owned by Singapore Airlines Ltd. Singapore Airlines Ltd has not independently verified the information from external sources. This material may
not be modified, reproduced, distributed, republished or transmitted in whole or in part in any manner or by any means without prior permission of Singapore Airlines Ltd.Fuel Hedging
SIA Group remains hedged up to Q1 FY23/24 with additional gains locked in from close-out trades
▪ Following the outbreak of the Covid-19 pandemic, there was a significant reduction in the Group’s capacity and hence fuel
consumption, compared to prior planned flight schedules.
▪ In view of the reduced consumption and the uncertainty that remains in the recovery profile, the Group took steps in the first
half of FY21/22 to recalibrate our fuel hedge book closer to a neutral posture through sell swaps to close out some of the
prior hedge positions.
Fuel Hedging Position Percentage Hedged Average Hedged Price for Brent
(as at 31 October 2021) (%) (USD/BBL)
2H FY21/22 30 57
Q1 FY22/23 - Q1 FY23/24 40 60
To be recognised in P&L
On a Cash Settled Basis
Summary of Gains from Close-out Trades in future periods
(USD’M)
(USD’M)
1H FY21/22 38 -
2H FY21/22 89 24
FY22/23 – FY24/25 225 208
Slide 19
The copyright in this material (other than in respect of information from external sources) is owned by Singapore Airlines Ltd. Singapore Airlines Ltd has not independently verified the information from external sources. This material may
not be modified, reproduced, distributed, republished or transmitted in whole or in part in any manner or by any means without prior permission of Singapore Airlines Ltd.Projected Group Capital Expenditure
Projected Capital Expenditure
FY21/22 FY22/23 FY23/24 FY24/25 FY25/26 FY26/27
($’M)
Aircraft 3,600 3,700 3,800 4,000 2,400 2,100
Others 300 300 300 300 300 300
Total 3,900 4,000 4,100 4,300 2,700 2,400
Slide 20
The copyright in this material (other than in respect of information from external sources) is owned by Singapore Airlines Ltd. Singapore Airlines Ltd has not independently verified the information from external sources. This material may
not be modified, reproduced, distributed, republished or transmitted in whole or in part in any manner or by any means without prior permission of Singapore Airlines Ltd.PRESENTATION BY:
CHIEF EXECUTIVE OFFICER
MR. GOH CHOON PHONG
The copyright in this material (other than in respect of information from external sources) is owned by Singapore Airlines Ltd. Singapore Airlines Ltd has not independently verified the information from external sources. This material may
not be modified, reproduced, distributed, republished or transmitted in whole or in part in any manner or by any means without prior permission of Singapore Airlines Ltd.1 Managing an Unprecedented Crisis
2 Preparing to Emerge Stronger
3 Moving Nimbly to Seize Opportunities
4 Committed to Sustainability
Slide 22
The copyright in this material (other than in respect of information from external sources) is owned by Singapore Airlines Ltd. Singapore Airlines Ltd has not independently verified the information from external sources. This material may
not be modified, reproduced, distributed, republished or transmitted in whole or in part in any manner or by any means without prior permission of Singapore Airlines Ltd.Managing an Unprecedented Crisis
Slide 23
The copyright in this material (other than in respect of information from external sources) is owned by Singapore Airlines Ltd. Singapore Airlines Ltd has not independently verified the information from external sources. This material may
not be modified, reproduced, distributed, republished or transmitted in whole or in part in any manner or by any means without prior permission of Singapore Airlines Ltd.Managing an Unprecedented Crisis
Responding with agility to sudden border closures and flight disruptions
Group Capacity
(M ASK)
13,112
15,826
8,273
526
Feb’20
Jan’20
Apr’20
Mar’20
Group Passengers
Carried
0.01m
3.4m
2.2m
1.1m
Jan’20
Feb’20
Apr’20
Mar’20
Source: Oxford COVID-19 Government Response Tracker, Blavatnik School of Government, University of Oxford
Slide 24
The copyright in this material (other than in respect of information from external sources) is owned by Singapore Airlines Ltd. Singapore Airlines Ltd has not independently verified the information from external sources. This material may
not be modified, reproduced, distributed, republished or transmitted in whole or in part in any manner or by any means without prior permission of Singapore Airlines Ltd.Managing an Unprecedented Crisis
Moved quickly to raise liquidity to ensure survival
Renegotiated contracts with Airbus and Boeing
From shareholders, through Rights
S$15.0B Issue of shares and MCBs
Additional Restructured fleet orders to moderate current capacity growth
liquidity raised S$2.1B Aircraft secured financing and meet projected long-term needs
since Deferred >$4b of capex out of FY20/21 – FY22/23
1 Apr 2020 S$2.0B Sale-and-leaseback of 11 aircraft
Issuance of convertible bonds and
S$2.0B notes
S$21.6B New committed lines of credit* and
S$0.5B Implemented staff measures
unsecured loan
~20% of positions reduced in FY20/21
Instituted paycuts
Renewed existing committed lines of
Committed LOCs S$1.7B credit
(untapped)
S$0.4B New committed lines of credit*
S$2.1B Expenditure remains closely watched
Ongoing effort to conserve cash and improve cost structure
*Refers to the same newly committed LOCs
Slide 25
The copyright in this material (other than in respect of information from external sources) is owned by Singapore Airlines Ltd. Singapore Airlines Ltd has not independently verified the information from external sources. This material may
not be modified, reproduced, distributed, republished or transmitted in whole or in part in any manner or by any means without prior permission of Singapore Airlines Ltd.Managing an Unprecedented Crisis
Strong financial position allows us to focus on responding to the crisis
Operating cashflows approaching break-even
Monthly optg
cashflows
-
in S$’M
Approaching
break-even
(100)
S$100M to S$150M
(200)
Under S$300M
(300)
S$300M to S$400M
(400)
Q1 Q2 Q3 Q4 Q1 Q2
FY20/21 FY21/22
*Operating cashflows includes net cash provided by operating activities and repayment of lease liabilities, and excludes proceeds from forward sales. Line is best-fit for illustration purposes only.
Slide 26
The copyright in this material (other than in respect of information from external sources) is owned by Singapore Airlines Ltd. Singapore Airlines Ltd has not independently verified the information from external sources. This material may
not be modified, reproduced, distributed, republished or transmitted in whole or in part in any manner or by any means without prior permission of Singapore Airlines Ltd.Preparing to Emerge Stronger
Slide 27
The copyright in this material (other than in respect of information from external sources) is owned by Singapore Airlines Ltd. Singapore Airlines Ltd has not independently verified the information from external sources. This material may
not be modified, reproduced, distributed, republished or transmitted in whole or in part in any manner or by any means without prior permission of Singapore Airlines Ltd.Preparing to Emerge Stronger
Reviewed the end-to-end travel journey to prioritise health safety, seamlessness, and customer experience
Pre-flight Check-In/Lounge/Boarding Inflight Arrival/Post-flight
COVID-19 Info Centre Health assessment for passengers Care Kit for pax Staggered disembarkation
• Comms & health safety videos at stations
• Enhanced flight credits rebooking
Mounted hand sanitisers outside lavatory
Digital Health Verification Solutions Electronic Health Declaration
Personalised Travel Crew in masks, goggles (gloves for
Restrictions & Visa Info meal collection & full PPE for lav cleaning)
Protective barriers at counters, Protective barriers at
• Travel advisory subscription
Staff in masks, Hand sanitisers All pilots and cabin crew vaccinated counters, Staff in masks,
Hand Sanitisers
Flexibility in ticket conditions
Cleaning & disinfection, Long HEPA filters on all aircraft
lasting anti-microbial coating Cleaning & disinfection
Cleaning & disinfection, Electrostatic
Enhanced Travel Guard with AIG spraying, Long lasting anti-microbial
Safe distancing markings Safe distancing markers
coating
Membership Programme
Print & Go Contactless Kiosk & F&B Changes
Tier requalification assistance, Baggage E2E
miles extension Auto Bag Tag Printing Self-Service Suite
Companion App, IFE controlled via PED
Pre departure test E-library Customer Surveys
facilitation service E-library • On-going New Normal survey to
understand customers’ travel
Digital Food Ordering (SKL) E-shopping concerns & changing needs
Auto & Online Check-in
with Digital Boarding Pass
Additional measures to minimise Digital inflight menu
crew & pax interaction at boarding
Amenities to enhance health & safety
Themes: Cleanliness & Hygiene Reducing Contact & Safe Distancing Facilitating Travel
Digital Initiatives Among Industry First Italics mean Work in Progress Pillow wrapping in biodegradable plastic
Slide 28
The copyright in this material (other than in respect of information from external sources) is owned by Singapore Airlines Ltd. Singapore Airlines Ltd has not independently verified the information from external sources. This material may
not be modified, reproduced, distributed, republished or transmitted in whole or in part in any manner or by any means without prior permission of Singapore Airlines Ltd.Preparing to Emerge Stronger
Reviewed the end-to-end travel journey to prioritise health safety, seamlessness, and customer experience
Digital Health Verification
Solutions
• SIA among world’s first to pilot digital
health verification solutions High staff vaccination rates
• Now building internal capabilities to • SIA Group among world’s first airlines
verify digital health certs to operate flights with full complements
of vaccinated crew on 11 Feb 2021
• Continue to build interoperability with more
standards and more destinations, to make • All cabin crew and pilots rostered on
customers’ check-in journeys smoother SQ flights are fully-vaccinated; Scoot to
in the new normal follow in Dec’21
Live e-Shopping onboard
Digital Food Ordering at SKL • First airline to offer live online • Scoot the first LCC in the world
shopping onboard to receive the Diamond Status and
5-star rating in the two audits
Slide 29
The copyright in this material (other than in respect of information from external sources) is owned by Singapore Airlines Ltd. Singapore Airlines Ltd has not independently verified the information from external sources. This material may
not be modified, reproduced, distributed, republished or transmitted in whole or in part in any manner or by any means without prior permission of Singapore Airlines Ltd.Preparing to Emerge Stronger
Innovating to engage and excite customers onboard and on-ground
Engaging all five senses to elevate customers’ Strategic transformation of
experience
• Onboarded >245 new non-air partners in 1H
Sight Taste Touch An SIA Group FY21/22
lifestyle rewards • Building a loyalty proposition for Group-wide assets
programme – Scoot, KrisShop, Kris+, and Pelago
Enhancing KF for a wider Driving member engagement
consumer base online and in-person
• Investing in the latest • Wide variety of F&B • Renowned service
cabin products options on-board • Milestone rewards to nudge • ~5m KF members (+4% YoY)
excellence across all
• Strong batik motif brand and at lounges more frequent usage • New KF social media channels
customer touchpoints
association • KrisFlyer for Families to offer • >20 bespoke experiences in 4
pooling flexibility markets held in 1H FY21/22
Sound Scent
Growing ’s customer mindshare
• Growing portfolio of brands & concept
+40% YoY stores, leveraging on the SIA brand
in 1H sales
• New Sonic branding, introduced • Batik Flora scent, our new • Expanding presence in overseas markets
in Apr’21 signature ambient fragrance, to +25% YoY • Build Group ecosystem synergies with
be launched in Dec’21 in 1H web traffic KrisWorld & Kris+
Slide 30
The copyright in this material (other than in respect of information from external sources) is owned by Singapore Airlines Ltd. Singapore Airlines Ltd has not independently verified the information from external sources. This material may
not be modified, reproduced, distributed, republished or transmitted in whole or in part in any manner or by any means without prior permission of Singapore Airlines Ltd.Preparing to Emerge Stronger
Bolstering our passenger and cargo network and services
Forging global airline partnerships for growth Aggressively capturing cargo momentum
61% Record-high
of pre-Covid cargo revenue
EUR achieved in
capacity restored
Deepen existing
in Q2 FY21/22 2 Q2 FY21/22 and
partnerships
N Asia
AME 1H FY21/22
Develop nascent
Strengthen network Expanding LHG JV partnerships,
connectivity scope between including with NH
EUR-SEA/SWP
MOU with UA on
commercial W Asia & Africa
SEA
cooperation Build regional
Access high-growth
connectivity,
markets, including
including with MH
with UK
SWP
Hinterland Continued operations of 2x SIA Increasing cool chain
partnerships with 773ER and 2x Scoot A320neos containers & solutions for
VA & NZ as converted freighters to enhanced pharmaceutical
capture ad-hoc charter cargo capabilities
34 codeshare partners to connect passengers to
>200 additional destinations 1 opportunities
(1) As at Sep’21; (2) pre-Covid refers to Q2 FY19/20
Slide 31
The copyright in this material (other than in respect of information from external sources) is owned by Singapore Airlines Ltd. Singapore Airlines Ltd has not independently verified the information from external sources. This material may
not be modified, reproduced, distributed, republished or transmitted in whole or in part in any manner or by any means without prior permission of Singapore Airlines Ltd.Preparing to Emerge Stronger
Lead The New World
Pursuing key revenue and cost initiatives to achieve financial sustainability
Strengthening core airline revenue through initiatives such as sales operations transformation, dynamic
pricing on direct channels and leveraging new distribution capabilities
Transforming KrisFlyer programme, accelerating growth in KrisShop and developing new engines of revenue
growth such as Kris+ lifestyle ecosystem and Parxl e-commerce logistics platform
>250 initiatives Comprehensively redesigned SIA’s inflight experience to focus on what customers value and as a result,
embarked on since FY20/21 reduced waste and increased crew productivity
to achieve a more
competitive cost base and Leveraged automation, tools and data to improve process efficiency, decision-making and operational resilience
stronger revenue
generating capabilities
Drive cost efficiencies with key partners e.g. restructuring technical handling and MRO contracts, revamping
operating model for ground and passenger handling activities
Transforming the way we work to enhance productivity and efficiency
>200 initiatives >110 staff 100% >500,000 staff hours
implemented to optimise trained as BPR Champions to lead of global HQ ground staff underwent saved from Business Process Reviews &
business processes process reviews across the organisation at least one digital mindset training digital initiatives since the pandemic
Slide 32
The copyright in this material (other than in respect of information from external sources) is owned by Singapore Airlines Ltd. Singapore Airlines Ltd has not independently verified the information from external sources. This material may
not be modified, reproduced, distributed, republished or transmitted in whole or in part in any manner or by any means without prior permission of Singapore Airlines Ltd.Moving Nimbly to Seize Opportunities
Slide 33
The copyright in this material (other than in respect of information from external sources) is owned by Singapore Airlines Ltd. Singapore Airlines Ltd has not independently verified the information from external sources. This material may
not be modified, reproduced, distributed, republished or transmitted in whole or in part in any manner or by any means without prior permission of Singapore Airlines Ltd.Moving Nimbly to Seize Opportunities
We are collaborating with authorities to re-start travel in a safe and calibrated manner
Vaccinated Travel Lanes (VTL)
Quarantine-free travel for vaccinated travellers
New VTL ticket bookings for next 3 departure months
SIA Group to operate VTL flights from
160,000
21 cities, 14 countries
Australia, Brunei, Canada, Denmark, France,
Germany, Italy, Malaysia*, Netherlands, 120,000
South Korea*, Spain, Switzerland, UK, USA
• Expansion of VTL destinations represents a 80,000
meaningful restart of travel
• VTL flights saw 7x increase in bookings since
VTL announcement 40,000
• Strong booking demand observed, especially in
premium cabins
-
19 Aug 2021 (Germany, 9 Oct 20219 (Canada,
Oct 2021 Denmark, 26 Oct
26 2021 (Australia,
Oct 2021 8 Nov 2021
8 Nov (Malaysi
2021
19 Aug 2021
Brunei) France, Germany, Italy,
(Canada, Denmark, France, Switzerland)
(Australia, Switzerland)
(Germany, Brunei)
Netherlands, S Korea,
Italy, Netherlands, Spain,
S Korea,
Spain,
UK, UK, USA)
USA)
* SIA will begin VTL flights from S Korea from 16 Nov 2021. VTL flight schedules between Kuala Lumpur and Singapore are expected to be announced soon.
As at 8 Nov 2021. Bookings in this slide are for XXX-SIN VTL flights departing 8Nov’21 – 31Jan’22. Line is best-fitted for purposes of this slide Respective VTL announcement dates
Slide 34
The copyright in this material (other than in respect of information from external sources) is owned by Singapore Airlines Ltd. Singapore Airlines Ltd has not independently verified the information from external sources. This material may
not be modified, reproduced, distributed, republished or transmitted in whole or in part in any manner or by any means without prior permission of Singapore Airlines Ltd.Moving Nimbly to Seize Opportunities
We will continue to proactively capture revenue opportunities
SIA Group expected to operate 43% of pre-Covid Agile and nimble approach to route management
passenger capacity by Dec’21
% vs. pre-Covid in Jan’20
20,000
38% New routes launched
Copenhagen-Rome, Athens-Berlin
32%
15,000
ASK (mil seat-km)
26%
53% of pre-Covid Older points & routes restarted
destinations by
21% Dec’21 Taipei-Los Angeles, Vancouver-Seattle
10,000
14%
Tactical capacity increases in response
5,000
7% to market changes
4% • Transatlantic/Transpacific openings: restarting Tokyo-Los Angeles,
Frankfurt-New York, Manchester-Houston, Hong Kong-San Francisco
routes
0
• Leisure travel sandboxes: increasing frequencies to Phuket
• Strong VTL demand: restart of A380 operations on London, Sydney
As at 8 Nov 2021; pre-Covid refers to Jan’20
Slide 35
The copyright in this material (other than in respect of information from external sources) is owned by Singapore Airlines Ltd. Singapore Airlines Ltd has not independently verified the information from external sources. This material may
not be modified, reproduced, distributed, republished or transmitted in whole or in part in any manner or by any means without prior permission of Singapore Airlines Ltd.Moving Nimbly to Seize Opportunities
We have been shoring up operational readiness to support a quick ramp-up in capacity
We have reactivated resources at lower utilisation rates to provide ample buffer
79% 92% of
Active pilots 86% of
activated cabin crew
activated
Group passenger operating Group pilots and cabin crew
fleet status in Nov’21 as at Nov’21
• 135 SIA & Scoot aircraft will be deployed in Nov’21 to • Most crew are deployed on at least one flight a month to
support network plans, including 3 A380s maintain up-to-date knowledge
• Utilisation can be quickly ramped up with current aircraft • Inactive crew are deployed to other parts of the
alone to support network expansion organisation or are on Voluntary NPL
*Active aircraft refers to aircraft deployed on passenger and cargo-only services, including to support operational requirements. Active crew refers to crew deployed on flights at least once a month.
Slide 36
The copyright in this material (other than in respect of information from external sources) is owned by Singapore Airlines Ltd. Singapore Airlines Ltd has not independently verified the information from external sources. This material may
not be modified, reproduced, distributed, republished or transmitted in whole or in part in any manner or by any means without prior permission of Singapore Airlines Ltd.Moving Nimbly to Seize Opportunities
We can expect more border re-openings as more countries attain high vaccination rates and move to ‘live with Covid-19’
(20 Sep 2021)
(3 Oct 2021)
(21 Oct 2021)
(5 Nov 2021)
(7 Oct 2021)
(17 Oct 2021)
(26 Oct 2021)
(1 Nov 2021)
Source: The Straits Times
Slide 37
The copyright in this material (other than in respect of information from external sources) is owned by Singapore Airlines Ltd. Singapore Airlines Ltd has not independently verified the information from external sources. This material may
not be modified, reproduced, distributed, republished or transmitted in whole or in part in any manner or by any means without prior permission of Singapore Airlines Ltd.Committed to Sustainability
Slide 38
The copyright in this material (other than in respect of information from external sources) is owned by Singapore Airlines Ltd. Singapore Airlines Ltd has not independently verified the information from external sources. This material may
not be modified, reproduced, distributed, republished or transmitted in whole or in part in any manner or by any means without prior permission of Singapore Airlines Ltd.Committed to Sustainability
We are accelerating our de-carbonisation journey in spite of Covid-19
SIA Group is committed to net-zero carbon emissions by 2050
1 New aircraft technology 2 Infrastructure & operational efficiency
• We are industry-leading with one of the world’s youngest fleets
Reducing fuel burn
Weight reduction
through Air Traffic
6 yrs 1 mth 15 yrs 3 mths initiatives to
Management
SIA Group fleet age Global fleet age lightweight the aircraft
initiatives, e.g.,
(at Nov’21) (at Nov’21) 1 and reduce fuel burn
arrival sequencing
• We are committed to investing in new-gen aircraft, which are up to 30% Removal of footrests on 40% reduction in
more fuel-efficient vs previous-gen aircraft selected aircraft could taxi fuel uplift at SIN
lightweight each aircraft Runway 3 with use of
62% by up to 300kg data analytics
of SIA Group’s operating pax fleet are new-gen aircraft 2
(at Nov’21)
20k solar panels installed in SIN offices
• We have 133 new-gen aircraft on firm order for delivery in the coming
4,300t of carbon emissions avoided per yr
years
Sources: (1) CAPA; (2) New-gen as defined in ATAG Waypoint 2050 report
Slide 39
The copyright in this material (other than in respect of information from external sources) is owned by Singapore Airlines Ltd. Singapore Airlines Ltd has not independently verified the information from external sources. This material may
not be modified, reproduced, distributed, republished or transmitted in whole or in part in any manner or by any means without prior permission of Singapore Airlines Ltd.Committed to Sustainability
We are accelerating our de-carbonisation journey in spite of Covid-19
SIA Group is committed to net-zero carbon emissions by 2050
3
Sustainable aviation fuels (SAF) as the key 4 Carbon offsets as a near to medium-
in-sector de-carbonisation lever term lever
2011 Compliance with
Joined SAF Users Group
International action group international standards
SIA supports CORSIA as the only
2017 global market-based measure to achieve carbon-neutral growth beyond 2020
World’s first green package flights
SIN-SFO flights powered by SAF blend
Voluntary carbon offset programme
2020
Collaborating with Swedavia Launched in Jun’21, SIA & Scoot passenger and cargo customers can
Year-long partnership with Swedavia Airport to now offset their carbon footprint on high-quality projects
deploy SAF blend on ARN-DME to better Further enhancements planned to enable use of KrisFlyer miles and
understand SAF logistics HighFlyer corporate points for offsetting
2021-
Core participant in SIN ecosystem to Engaging ecosystem to secure
commercialising SAF quality carbon credits
Actively exploring options on local SAF production and delivery
Slide 40
The copyright in this material (other than in respect of information from external sources) is owned by Singapore Airlines Ltd. Singapore Airlines Ltd has not independently verified the information from external sources. This material may
not be modified, reproduced, distributed, republished or transmitted in whole or in part in any manner or by any means without prior permission of Singapore Airlines Ltd.Committed to Sustainability
We remain firmly committed to sustainability across Environment, Social, and Governance dimensions
Food waste Paper waste Plastic waste
Waste New short-haul economy class Elimination of paper menus, Replacing 3.9m plastic
meals give >50% weight, newspapers & magazines
management >60% waste, and >80% achieve >1,800 tonnes in
straws & swizzle sticks with
wooden ones in a yr
SUP reductions paper savings per yr
Emergency carriage Enhanced staff The Upcycling
of essential supplies volunteerism Project
Supporting our
communities Renewed partnership with 2,100 staff deployed as SIA Collaborating with artists, brands,
Temasek Foundation & World Group Ambassadors to 32 educational institutions, and
Food Programme in Jul’21 organisations in total social enterprises to repurpose
aircraft parts and equipment
Slide 41
The copyright in this material (other than in respect of information from external sources) is owned by Singapore Airlines Ltd. Singapore Airlines Ltd has not independently verified the information from external sources. This material may
not be modified, reproduced, distributed, republished or transmitted in whole or in part in any manner or by any means without prior permission of Singapore Airlines Ltd.Thank You The copyright in this material (other than in respect of information from external sources) is owned by Singapore Airlines Ltd. Singapore Airlines Ltd has not independently verified the information from external sources. This material may not be modified, reproduced, distributed, republished or transmitted in whole or in part in any manner or by any means without prior permission of Singapore Airlines Ltd.
You can also read