SENSITIVITY AND SPECICITY OF TWO WHO APPROVED SARS-COV2 ANTIGEN ASSAYS IN DETECTING PATIENTS WITH SARS-COV2 INFECTION
←
→
Page content transcription
If your browser does not render page correctly, please read the page content below
Sensitivity and Specificity of Two WHO Approved
SARS-CoV2 Antigen Assays in Detecting Patients
with SARS-CoV2 Infection
Chandima Jeewandara
 University of Sri Jayewardenepura Faculty of Medical Sciences
Dinuka Guruge
 Colombo Municipal Council
Pradeep Pushpakumara
 University of Sri Jayewardenepura Faculty of Medical Sciences
Deshan Madushanka
 University of Sri Jayewardenepura Faculty of Medical Sciences
Tibutius Jayadas
 University of Sri Jayewardenepura Faculty of Medical Sciences
Indika Chathuranga
  Colombo Municipal Council
Inoka Abeyratne
  University of Sri Jayewardenepura Faculty of Medical Sciences
Saubhagya Danasekara
 University of Sri Jayewardenepura Faculty of Medical Sciences
Thilagaraj Pathmanathan
 University of Sri Jayewardenepura Faculty of Medical Sciences
Deshni Jayathilaka
 University of Sri Jayewardenepura Faculty of Medical Sciences
Gayasha Somathilaka
 University of Sri Jayewardenepura Faculty of Medical Sciences
Heshan Kuruppu
 University of Sri Jayewardenepura Faculty of Medical Sciences
Laksiri Gomes
 University of Sri Jayewardenepura Faculty of Medical Sciences
Vijith Gunasekara
 Ministry of Health, Sri Lanka
Ruwan Wijayamuni
 Colombo Municipal Council
Graham Ogg

                                               Page 1/17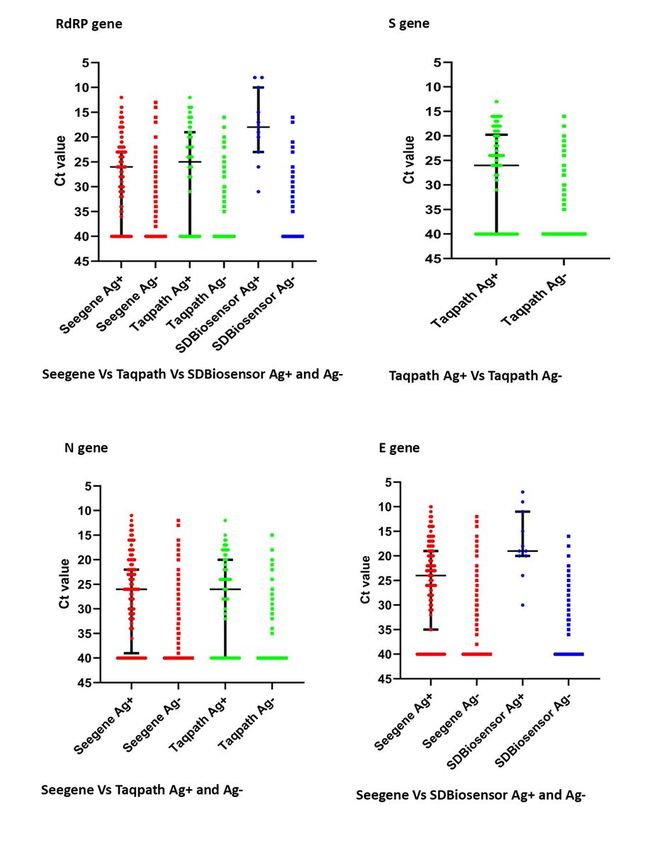
University of Oxford
Gathsaurie Neelika Malavige ( gathsaurie.malavige@ndm.ox.ac.uk )
University of Sri Jayewardenepura https://orcid.org/0000-0001-9201-0449
Research article
Keywords: SARS-CoV-2, Rapid antigen tests, PCR, Abbott Ag test, SD-Biosensor Ag test, antibodies
Posted Date: June 16th, 2021
DOI: https://doi.org/10.21203/rs.3.rs-618824/v1
License: This work is licensed under a Creative Commons Attribution 4.0 International License.
Read Full License
Page 2/17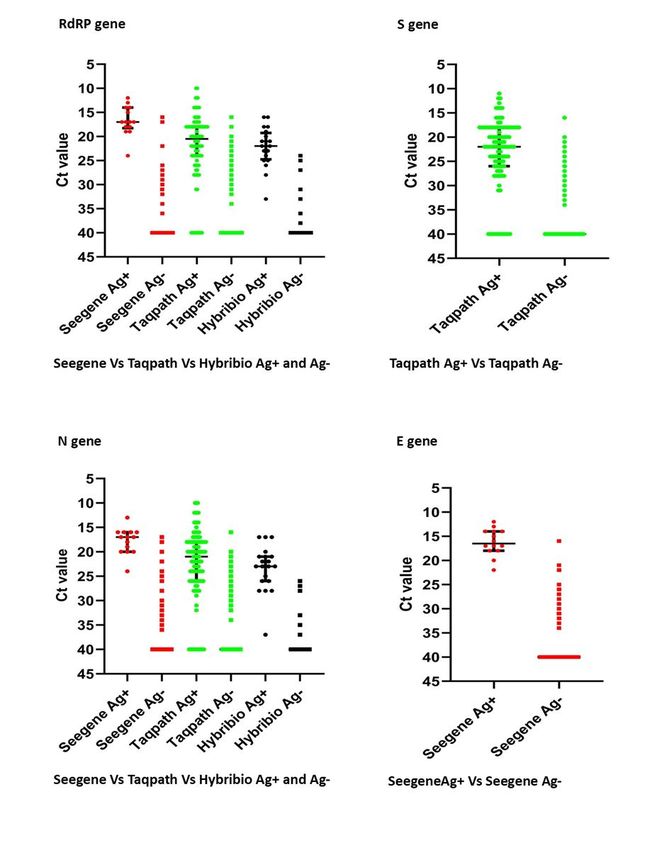
Abstract
Background: SARS-CoV-2 rapid antigen (Ag) detection kits are widely used in addition to quantitative real-
time PCR (RT-qPCR), as they are cheaper with a rapid turnaround time. As there are many concerns
regarding their sensitivity and specificity, in different settings, we evaluated two WHO approved rapid Ag
kits in a large cohort of Sri Lankan individuals.

Methods: Paired nasopharangeal swabs were obtained from 4845 participants for validation of the SD-
Biosensor rapid Ag assay and 3625 for the Abbott rapid Ag assay, in comparison to RT-qPCR. A short
questionnaire was used to record symptoms at the time of testing, and blood samples were obtained
from 2721 of them for detection of SARS-CoV-2 specific antibodies.

Results: The overall sensitivity of the SD-Biosensor Ag kit was 36.5% and the Abbott Ag test was 50.76%.
The Abbott Ag test showed specificity of 99.4% and the SD-Biosensor Ag test 97.5%. At Ct values 30
(46.1 to 82.9%). 32.1% of those who gave a positive result with the SD-Biosensor Ag test and 26.3% of
those who gave positive results with the Abbott Ag test had SARS-CoV-2 antibodies at the time of
detection.

Conclusions: Both rapid Ag tests appeared to be highly sensitive in detecting individuals at lower Ct
values, in a community setting in Sri Lanka, but it will be important to further establish the relationship to
infectivity.

Background
Quantitative real time PCR (RT-qPCR), with use of specific primers targeting two or three genes of the
SARS-CoV2 virus is considered as the gold-standard in the diagnosis of a patient infected with the virus
[1, 2]. However, the use of RT-qPCR has several limitations in relation to poor sensitivity and also due to
the difficulties in using these in community surveillance [3]. Due to the high cost, the need of dedicated
equipment and trained individuals, use of RT-qPCR has been challenging for many developing countries
with scare resources. In order to fulfill this need many diagnostic tests which are faster and cheaper, such
the loop-mediated isothermal amplification (RT-LAMP) for detection of viral RNA[4], CRISPR-based assays
[5] and many different types of lateral flow antigen detection assays [1, 6, 7].

The rapid antigen assays (RATs) are convenient to use due to the very fast turnaround time, to able to test
the individuals at the point of care and also as they are relatively cheaper. However, there have been many
concerns regarding their poor sensitivity and sometimes the occurrence of false-positive results [7, 8].
While these RATs appear to be the ideal test in community surveillance programs, their pretest probability
depends on the prevalence of SARS-CoV2 in the community [7]. The pre-test probability is lower in
                                                   Page 3/17
communities with lower prevalence rates giving rise to higher false positive rates [7, 8]. The World Health
Organization recommends a minimum of 80% sensitivity and 97% specificity in the RATs that are used
for diagnostic purposes[8]. However, the studies that have assessed the sensitivity and specificity of the
currently approved RATSs, have varied in study design and in some have been evaluated in a relatively
small number of individuals [9]. Furthermore, it has been reported that certain SARS-CoV-2 can given to
false negative results due to certain mutations that occur in the N protein [10].
Although the sensitivity of these RATs have been questioned, they are thought to be adequately sensitive
to detect individuals with higher viral loads, especially during the early phases of infection and therefore,
who are likely to be more infectious [9]. Therefore, the WHO has recommended their use to investigate
certain outbreak situations, to monitor disease trends in communities and for early detection and
isolation of infected individuals in setting where there is a high degree of community transmission [9].
Although the use of these RATs are not recommended in setting where there is a low community
prevalence to test individuals especially before elective procedures such as elective surgery, blood
donation and at points of entry [9], many countries use the tests in these setting due to the costs and time
associated with the PCRs. As the performance of these RATs is known to vary in different settings, with
different SARS-CoV-2 variants, we proceeded to evaluate the performance of two of the test kits, in a large
cohort in individuals in the city of Colombo, Sri Lanka.
Methods
Participants
The Colombo Municipality Council (CMC) has a population of 752,993 individuals in an area of 37.3 km2
and is one of the highest population dense areas (20,187.5 persons/km2) in the country. The highest
number of cases of COVID-19 were reported in the CMC area during October 2020 to mid-January 2021,
which reported, 13216 cases during this period. Therefore, in order to identify cases in the community, RT-
qPCR was carried out in primary contacts of cases and also during community surveillance. Since the
SD-Biosensor and Abbott RATs were first used in Sri Lanka since end of November, individuals residing in
the CMC were invited to participate in this study. Paired nasopharyngeal swabs for each participant was
obtained for the RAT and RT-qPCR. A short questionnaire was used to record symptoms at the time of
testing, and self-reported symptoms of fever, sore throat, cough and diarrhoea were recorded. In 2721 of
the participants, a blood sample was also obtained for the detection of SARS-CoV-2 antibodies, following
informed written consent.
Informed consent and human experimentation guidelines
Informed written was obtained from all participants, in whom a blood sample was collected. Ethics
approval for the study was obtained from the Ethics Review Committee of the University of Sri
Jayewardenepura.
Realtime RT-PCR for detection of SARS CoV-2:
Page 4/17Nasopharyngeal swabs samples of the participants were lysed and RNA was extracted using QIAmp Viral
RNA Mini Kit (Qiagen, USA, Cat: 52906) and used to detect the presence of the SARS-CoV2 virus using
four different PCR kits; Allplex™ SARS-CoV-2 Assay (SeeGene, Korea), TaqPath™ COVID-19 RT-PCR Kit
(Thermo Fisher Scientific, USA), STANDARD M nCoV Real-Time Detection kit (SD Biosensor,Korea) and
COVID-19 Real-time PCR Kit (HBRT-COVID-19) (Chaozhou Hybribio Biochemistry Ltd, China) as different
kits were available in our laboratory during different time periods. The qRT-PCR carried out according to
the manufacturer’s instructions. A cycle threshold value (Ct) of ≤ 38 for two or more genes was
considered as a positive PCR result.
SD Biosensor and Abbott RAT
Nasopharyngeal swabs samples of 4845 participants were used for validation of the SD-Biosensor RAT
and 3625 for the Abbott RAT. Dedicated sterilized nasopharyngeal swabs in the kit were used to collect
the sample. Samples for the Abbott PanbioTM COVID-19 RAT (Abbott, Germany) and the Standard Q
covid 19 Ag test (SD Biosensor, Korea) were collected, and the assay carried out and interpreted
according to the manufacturers instructions. All the samples were processed within an hour of the
sample collection.
Detection of antibodies to SARS-CoV-2
SARS-COV-2 specific antibodies (IgM, IgG and IgA) were assessed using WANTAI SARS-CoV-2 Ab ELISA
(Beijing Wantai Biological Pharmacy Enterprise, China) in 2721 individuals in blood samples obtained at
the time paired samples were obtained for RT-qPCR/RAT. The Wantai ELISA assay was shown to have a
sensitivity of 98% [11] and was found to be 100% specific in serum samples obtained in 2018, in Sri
Lankan individuals. The assay was carried out and results were interpreted according to manufacturers’
instructions.
Statistical analysis
GraphPad Prism version 6 was used for statistical analysis. As the data were not normally distributed,
differences in means were compared using the Mann-Whitney U test (two tailed). The descriptive
statistics including the frequencies, percentages with 95% confidence intervals, cross-tabulations,
measures of sensitivity, specificity, positive and negative predictive values were calculated using the MS
Excel and R software tool (R version 3.3.3 (2017-03-06) and R-Studio Version 1.3.959).
Results
Performance of the SD-Biosensor RAT
In order to evaluate the sensitivity and specificity of the SD-Biosensor RAT, paired samples were tested in
4845 individuals. The sensitivity and specificity of the SD-Biosensor RAT was evaluated against three
PCR kits; SeeGene (n = 2427), Taqpath (n = 1667) and SD Biosensor (n = 692), as different kits were
available in our laboratory during different time periods. All three of these kits have the RdRP gene of the
Page 5/17SARS-CoV2 as a target, while SeeGene has N and E genes as the other target genes, Taqpath has N and S
as the other genes and SD-Biosensor E gene as the other target gene.
Of the 4845 individuals, 893 gave a positive RT-qPCR result, 3925 were negative and 27 gave an
inconclusive result. Of the 893 RT-qPCR positive individuals, the RAT was positive in 324 (36.3%)
individuals, negative in 567 (63.5%) and invalid result in 2 individuals. Therefore, the overall sensitivity of
the SD-Biosensor RAT was 36.4% (95% CI -33.3–39.8%). Of those who had a negative RT-qPCR result,
96/3925 (2.4%) gave a positive RAT result and therefore, the specificity was 97.7% (95% CI − 97–98%).
The positive predictive value (PPV) of the assay compared to RT-qPCR was 76.5% and the negative
predictive value (NPV), was 87.6%. The sensitivity of this RAT at different Ct values for different PCR kits
is shown in Table 1.
Table 1
Positivity rate of the SD-Biosensor rapid Ag kit for different RT-qPCR kits at different Ct values
PCR Kit Avg Ct Value Sensitivity of the SD- 95% CI Lower 95% CI Upper
for PCR Biosensor Ag kit Limit Limit
SeeGene Kit < 25 76.6% 69.5% 82.5%
26–30 36.2% 28.1% 45.1%
31–38 6.1% 3.3% 10.6%
TAQPATH < 25 71.3% 60.4% 80.2%
Kit 26–30 13% 6.7% 23%
31–38 9.5% 1.7% 31.8%
SD-Biosensor < 25 72.1% 59% 82.5%
RT-qPCR
26–30 7.8% 2.5% 19.7%
Kit
31–38 0% 0% 6.4%
The viral load in a respiratory sample inversely correlates with the cycle threshold (Ct). As individuals with
lower Ct values, have higher viral loads and likely to be more infectious [12], we evaluated the sensitivity
of this RAT at different Ct values of the RdRp gene, E gene, N gene and S that was used in the RT-qPCR
assay (Fig. 1). For the RdRp gene, the median Ct value of SD-Biosensor RAT positive samples was 26
(IQR 23 to 40) by the SeeGene kit, 25 (IQR 19 to 40) by the Taqpath kit and 10 (IQR 10 to 23) by the SD-
Biosensor RT-qPCR kit (Fig. 1A). For the RAT negative samples, the median Ct values for all three kits was
40 (IQR 40 to 40). The S gene target was only present in the Taqpath kit and the median Ct values for RAT
positive samples was 26 (IQR 19.75 to 40) (Fig. 1B). Two PCR kits had primers targeting the N gene and
the median Ct value of SD-Biosensor RAT positive samples was 17 (IQR 16 to 20) for the SeeGene kit and
26 (IQR 22 to 39) by the Taqpath kit and 26 (IQR 20 to 40) (Fig. 1C). Two kits had primers targeting the E
gene and the median Ct value of SD-Biosensor Ag positive samples in the SeeGene kit was 24 (IQR 19 to
35) and for the SD-Biosensor RT-qPCR kit it was 19 (IQR11 to 20) (Fig. 1D).
Page 6/17Performance of the Abbot RAT
For determining the sensitivity and specificity of the Abbott SARS-CoV2 RAT, the RAT and RT-qPCR were
carried out in 3625 individuals. The sensitivity and specificity of the Abbott RAT were evaluated against
three PCR kits; SeeGene (n = 555), Taqpath (n = 2490) and Hyrbribio (n = 280), as different kits were
available in our laboratory during different time periods. Of the 3625 individuals, 327 gave a positive RT-
qPCR result, 3288 were negative and 10 gave an inconclusive result. Of the 327 RT-qPCR positive
individuals, the RAT was positive in 166 (50.76%) individuals and negative in 161(49.24%). Of those who
had a negative RT-qPCR result, 20/3288 gave a positive RAT result. Therefore, the overall sensitivity of the
RAT was 50.76% (95% CI − 45.2–56.3%) and the specificity was 99.4% (95% CI − 99.0–99.6%). The PPV
of the assay compared to RT-qPCR was 89.2% and the NPV was 95.3%. The sensitivity of this RAT at
different Ct values for different PCR kits is shown in Table 2.
Table 2
Positivity rate of the Abbott rapid Ag kit for different RT-qPCR kits at different Ct value
PCR Kit Avg Ct Value for Sensitivity of the Abbott 95% CI Lower 95% CI Upper
PCR Ag kit Limit Limit
SeeGene < 25 77.3% 54.2% 91.3%
Kit
26–30 7.1% 0.4% 35.8%
31–38 0% 0% 22.9%
TAQPATH < 25 81.4% 72.9% 87.7%
Kit 26–30 18.7% 10.9% 29.7%
31–38 25% 4.5% 64.4%
Hybri-Bio < 25 88.9% 63.9% 98.1%
Kit
26–30 60% 17% 92.7%
31–38 11.1% 0.6% 49%
The sensitivity and specificity of this RAT was also evaluated for different Ct values of the RdRp gene, E
gene, N gene and S that was used in the RT-qPCR assay (Fig. 2). For the RdRp gene, the median Ct value
of Abbott RAT positive samples was 17 (IQR 14 to 18.25) for the SeeGene kit, 20.5 (IQR 18 to 24) by the
Taqpath kit and 22 (IQR 19.25 to 24.75) by the Hybribio kit (Fig. 2A). For the RAT negative samples, the
median Ct values for all three kits was 40 (IQR 40 to 40). For the S gene, which was only targeted by the
Taqpath kit, the median Ct value of RAT positive samples was 22 (IQR 18 to 26) (Fig. 2B). All three PCR
kits had primers targeting the N gene and the median Ct value of Abbott RAT positive samples was 17
(IQR 16 to 20) for the SeeGene kit, 21 (IQR 18 to 26) by the Taqpath kit and 23 (IQR 21 to 26) by the
Hybribio kit (Fig. 2C). The SeeGene kit only had primers targeting the E gene and the median Ct value of
RAT positive samples was 16.5 (IQR 14 to 18) (Fig. 2D).
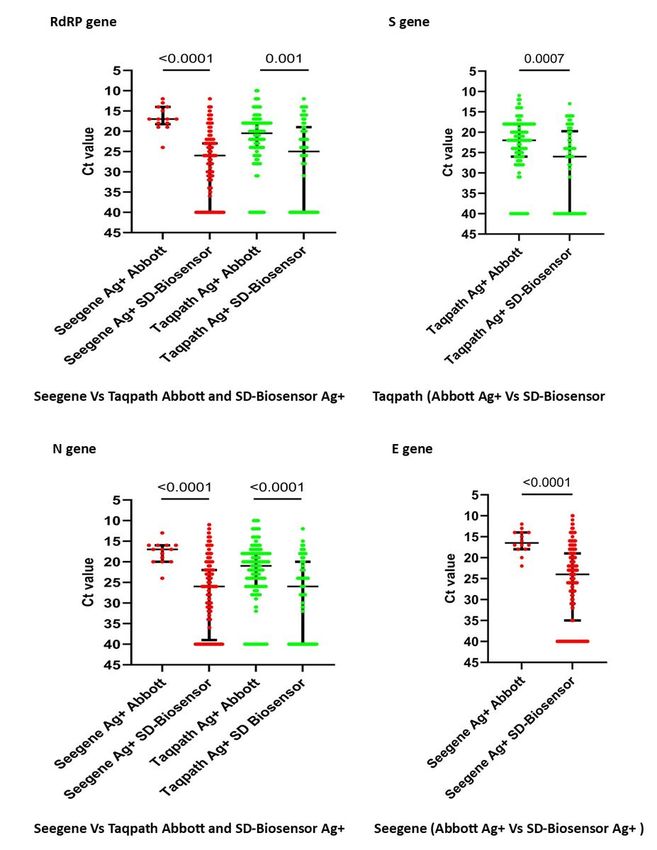
Page 7/17Comparison of the Ct values in the samples which gave a positive result by the SD-Biosensor vs the
Abbot RAT
In order to determine the differences in detection by the two RATs at different Ct values, we compared the
Ct values of the samples which gave a positive result for the SD-Biosensor RAT and the Abbott RAT for
the RdRP, S, N and the E genes. This comparison was only carried out for the SeeGene and the Taqpath
kits as the SD-Biosensor RT-qPCR kits were not used to validate the Abbott RAT and the Hybribio PCR kit
was not used to validate the SD-Biosensor RAT. For RdRP, S, N and the E gene, the Ct values of the Abbott
RAT positive samples was significantly less for the SD-Biosensor RAT positive samples for both PCR kits
(Fig. 3). For the RdRP gene the Ct values of the Abbot RAT positive samples was significantly less for the
SeeGene kit (p < 0.0001) than the Taqpath kit (p = 0.001) (Fig. 3A). The Ct values of the Abbott RAT
positives were again significantly lower for the S gene with the Taqpath kit (p = 0.0007) (Fig. 3B) and also
for the N gene in the SeeGene kit (p < 0.0001) and the Taqpath kit (p < 0.0001) (Fig. 3C). The Ct values of
the Abbott RAT positives were again significantly lower for the S gene with the Taqpath kit (p = 0.0007)
(Fig. 3B) and also for the N gene in the SeeGene kit (p < 0.0001) and the Taqpath kit (p < 0.0001) (Fig. 3C).
Only the Seegene kit targeted the E gene and again the Ct values of the Abbott RAT positives were again
significantly lower in the Abbott RAT positive samples compared to the SD-Biosensor Ag positive samples
(p < 0.0001) (Fig. 3D).
Presence of SARS-CoV2 antibodies and the performance of the RATs
Individuals infected with the SARS-CoV2 virus may shed virus for a prolonged period [13, 14], but are
often thought to shed dead, or non-culturable virus [15, 16]. The appearance of neutralizing antibodies are
thought to associate with the presence of non-culturable and therefore, virus particles that are non-
infectious [15]. Therefore, it has been proposed that seroconversion and Ct values of > 24 could be used
to release individuals from isolation/quarantine [15]. As one of the most important uses of the SARS-
CoV2 RATs it to detect people who are infectious, we proceeded to investigate their performance in
individuals from the community and in those who are primary and secondary contacts of the index
patient. We obtained blood samples from 2721 individuals at the same time as paired nasopharyngeal
samples were obtained for RT-qPCR and antigen testing. The presence of SARS-CoV2 specific antibodies
were detected using the Wantai ELISA, which detects the presence of virus specific IgA, IgM and IgG
antibodies and was shown to have a sensitivity of 98% [11]. The specificity of this assay was evaluated
in the Sri Lankan population in 81 serum samples obtained in 2018 and was found to be 100% specific.
Of the study participants, 435 (15.98 %), were found to have SARS-CoV-2 specific antibodies, although
they were not aware of any recent or past COVID-19 illness. 209 (48.04%) individuals who had antibodies
gave a positive RT-qPCR result, while 226 (52.4%) SARS-CoV2 antibody positive individuals were negative
for RT-qPCR. The presence of SARS-CoV2 antibodies for the three different PCR kits, at different Ct values
is shown in Table 3.
Page 8/17Table 3
The presence of SARS-CoV2 specific antibodies for different RT-qPCR kits
and different Ct values
Avg Ct Values Seegene TAQPATH SD-Biosensor
< 25 21/80 = 26.25% 15/63 = 23.81% 10/24 = 41.67%
26–30 41/52 = 78.85% 22/62 = 35.48% 12/17 = 70.59%
31–38 58/70 = 82.86% 6/12 = 50% 18/39 = 46.15%
Of those who had a positive result with the SD-Biosensor RAT 60/187 (32.1%) had detectable SARS-CoV-
2 antibodies, while antibodies were detected in 432/1751 (24.6%) of those who tested negative result
(Table 4). Of those who tested positive with the Abbott RAT 10/38 (26.3%) were also positive for
antibodies, and 109/602 (18.1%) who tested negative for the Abbott RAT, had SARS-CoV2 specific
antibodies.
Table 4
The presence of SARS-CoV2 specific antibodies, in those who were
tested positive vs negative for the SARS-CoV2 rapid antigen kits
Ab Positive Ab Negative Total
SD-Biosensor Ag Positive 60 (32.1%) 127 187
SD-Biosensor Ag Negative 432 (24.6%) 1319 1751
Abbott Ag Positive 10 (26.3%) 28 38
Abbott Ag Negative 109 (18.1%) 493 602
Disease symptoms and sensitivity of RAT compared to RT-qPCRs
Four symptoms were recorded at the time of testing in all participants and if they reported at least one of
the four symptoms (fever, sore throat, cough or diarrhea) they were considered to be symptomatic. Of the
8470 individuals, 249 (2.94%) were symptomatic and 8221 (97.1%) were asymptomatic at the time of
testing. Of those who were asymptomatic 1115 (13.2%) were PCR positive. Of those who were PCR
positive, 847 (75.9%) were positive by the SD-Biosensor and 268 (24.03%) by the Abbott RAT. Of those
who were asymptomatic and PCR negative, 88/7106 (1.23%) tested positive for the SD RAT and 20/7106
(0.28%) tested positive for the Abbott RAT.
209 (48.4%) of the PCR positive individuals had SARS-CoV-2 antibodies at the time of testing. 8 of them
were symptomatic while 201 (96.2%) were asymptomatic. While numbers of RT-qPCR positive, antibody-
positive symptomatic individuals is small as expected, there was no significant difference in RT-qPCR
positivity and presence or absence of symptoms or antibody positivity.
Discussion
Page 9/17In this study we have evaluated the performance of two WHO approved RATs in a large cohort of
individuals (n = 8470) in an area of high prevalence (1.76%) when the dominant circulating variant was a
virus of the SARS-CoV-2 B.1.411 lineage[17]. In Sri Lanka, the control strategy consisted of identifying
every possible infected individual through testing of all contacts of cases and also through community
screening in locations where increased numbers of SARS-CoV2 infected individuals were identified.
Therefore, it was important to evaluate if RAT were a good tool to identify infected individuals, in the
community, in comparison to RT-qPCR. Compared to RT-qPCR, the overall sensitivity of the SD-Biosensor
RAT was 36.5% and the Abbott RAT was 50.76%. The Abbott RAT was also found to be more specific
(99.4%) than the SD-Biosensor RAT (97.5%). Therefore, in an area of a high level of transmission,
96/3925 = 2.4% individuals who were identified as being negative by RT-qPCR were given a positive result
by the SD-Biosensor RAT, whereas the false positivity rates of the Abbott RAT were lower (20/3288 =
0.6%). The PPV and the NPV were also significantly better in the Abbott RAT (89.2% and 95.3%)
compared to the SD-Biosensor RAT (76.5% and 87.6%). The Abbott RAT indicated positives at
significantly lower Ct values for all genes for all the RT-qPCR kits tested compared to the SD-Biosensor
RAT. As the Abbott RAT gives a positive result at lower Ct values, it is less likely to give a false positive
result and therefore, has a high specificity, PPV and an NPV.
Although patients who are infected with the SARS-CoV-2 virus have the highest viral loads during early
illness, which associates with infectivity, they can shed non-infectious virus for many weeks [18, 19].
Lower Ct values (< 20) have shown to associate with infectivity [20, 21] and also associate with a higher
probability of culturing the virus [22]. Therefore, the RATs that detect patients having higher viral loads
(lower Ct values), are thought to be ideal in identifying individuals who are most infectious and likely to
spread the virus. Indeed, the Abbot RAT gave positive results for samples with a median Ct value of 17 to
23 for different genes and different PCR kits, while the SD RAT gave positive results for samples with a
median Ct value between 18 to 26 for different gene targets and kits. Therefore, these RAT do appear to
be useful in identifying patients with higher viral loads, who are possibly more infectious.
However, it has been established that individuals with mild or asymptomatic infection are unlikely to be
infectious 7 to 10 days since the onset of symptoms [16, 23]. SARS-CoV-2 specific antibodies become
detectable after 7 days since onset of illness and sometimes much later in patients with asymptomatic of
mild illness [13, 24]. In our cohort of patients, 97.1% were tested positive were asymptomatic at the time
of testing. 48.04% of these individuals had antibodies, suggesting that they had been harboring the
infection for some time. Therefore, a large proportion of asymptomatic individuals who are tested
positive by RT-qPCR and thus isolated from the community seem likely to have passed their infective
period. Interestingly, of those who had Ct values of < 25, 23.8–41.67% had detectable antibodies. This
suggests that even those with lower Ct values at time of detection are likely to have had the infection for
a while and shedding non-infectious virus particles. Therefore, low Ct values per se at the time of
detection in asymptomatic individuals, does not seem to indicate that the person is in the early phase of
the illness. However, antibody positivity was higher with Ct values > 30, with the antibody positivity
ranging from 82.86% for the SeeGene kit to 46.15% for the SD-Biosensor PCR assay.
Page 10/1732.1% of those who gave a positive result with the SD-Biosensor RAT and 26.3% of those who were
positive with the Abbott RAT, had SARS-CoV-2 antibodies at the time of testing. Therefore, RAT do not
appear to necessarily detect only infectious individuals, as a significant proportion of those who tested
positive by RATs seem to have had the infection for at least more than 7 days.
One of the main limitations of this study is that the performance of these RATs was evaluated in
identification of infection of primary and secondary contacts of cases and in community surveillance. As
the majority of this cohort of individuals were asymptomatic when the predominant SARS-CoV2 variant
was B.1.411[17], these RATs could give different sensitivity and specificity in individuals who are
symptomatic, in a hospital setting. Furthermore, if these assays were evaluated in a location of high
prevalence and again the sensitivity and specificity, PPV and NPV could be different in areas where there
is a low prevalence of SARS-CoV2 infection.
Declarations
Ethics approval and consent to participate
Ethics approval for the study was obtained from the Ethics Review Committee of the University of Sri
Jayewardenepura.
Consent for publication
Not applicable.
Availability of data and materials
All data are included in the manuscript and figures.
Competing interests
No conflicts of interests.
Funding
We are grateful to the World Health Organization, the UK Medical Research Council for their support and
the Foreign and Commonwealth Office.
Authors' contributions
CJ, DG, GNM: Conceptualization
CJ, DG, PD, DJ, LS: Methodology
DG, GNM, GS: Formal analysis
Page 11/17PD, DM, TTJ, IPC, ISA, SD, TP, DJ, HK, LG: Investigation
DG, DJ, ISA SD, RW: Data curation
CJ, DG, RW, VG : Project administration
CJ, GNM, GSO: Funding acquisition
GNM, CJ, GS: Writing original draft
GNM, GSO, CJ: Writing-review and editing
Acknowledgements
Not applicable.
References
1. Tang YW, Schmitz JE, Persing DH, Stratton CW. Laboratory Diagnosis of COVID-19: Current Issues
and Challenges. Journal of clinical microbiology 2020, 58(6).
2. Kevadiya BD, Machhi J, Herskovitz J, Oleynikov MD, Blomberg WR, Bajwa N, Soni D, Das S, Hasan M,
Patel M, et al: Diagnostics for SARS-CoV-2 infections. Nat Mater 2021.
3. Mina MJ, Peto TE, Garcia-Finana M, Semple MG, Buchan IE: Clarifying the evidence on SARS-CoV-2
antigen rapid tests in public health responses to COVID-19. Lancet 2021.
4. Yoshikawa R, Abe H, Igasaki Y, Negishi S, Goto H, Yasuda J. Development and evaluation of a rapid
and simple diagnostic assay for COVID-19 based on loop-mediated isothermal amplification. PLoS
Negl Trop Dis. 2020;14(11):e0008855.
5. Broughton JP, Deng X, Yu G, Fasching CL, Servellita V, Singh J, Miao X, Streithorst JA, Granados A,
Sotomayor-Gonzalez A, et al. CRISPR-Cas12-based detection of SARS-CoV-2. Nature biotechnology.
2020;38(7):870–4.
6. Chaimayo C, Kaewnaphan B, Tanlieng N, Athipanyasilp N, Sirijatuphat R, Chayakulkeeree M,
Angkasekwinai N, Sutthent R, Puangpunngam N, Tharmviboonsri T, et al. Rapid SARS-CoV-2 antigen
detection assay in comparison with real-time RT-PCR assay for laboratory diagnosis of COVID-19 in
Thailand. Virol J. 2020;17(1):177.
7. Centre for Disease Control U. Interim Guidance for Antigen Testing for SARS-CoV-2. In. National
Center for Immunization and Respiratory Diseases (NCIRD), Division of Viral Diseases; 2020.
8. Peeling RW, Olliaro PL, Boeras DI, Fongwen N: Scaling up COVID-19 rapid antigen tests: promises
and challenges. The Lancet infectious diseases 2021.
9. WHO: Antigen-detection in the diagnosis of SARS-CoV-2 infection using rapid immunoassays. In:
Interim guidance. Emergencies Preparedness, WHO Headquarters (HQ): Emergencies Preparedness,
WHO Headquarters (HQ); 2020: 9.
Page 12/1710. FDA. Genetic Variants of SARS-CoV-2 May Lead to False Negative Results with Molecular Tests for
Detection of SARS-CoV-2 - Letter to Clinical Laboratory Staff and Health Care Providers. In.: FDA;
2021.
11. Weidner L, Gansdorfer S, Unterweger S, Weseslindtner L, Drexler C, Farcet M, Witt V, Schistal E,
Schlenke P, Kreil TR, et al. Quantification of SARS-CoV-2 antibodies with eight commercially available
immunoassays. J Clin Virol. 2020;129:104540.
12. Singanayagam A, Patel M, Charlett A, Lopez Bernal J, Saliba V, Ellis J, Ladhani S, Zambon M, Gopal
R. Duration of infectiousness and correlation with RT-PCR cycle threshold values in cases of COVID-
19, England, January to May 2020. Euro Surveill 2020, 25(32).
13. Jeewandara C, Jayathilaka D, Gomes L, Wijewickrama A, Narangoda E, Idampitiya D, Guruge D,
Wijayamuni R, Manilgama S, Ogg GS, et al. SARS-CoV-2 neutralizing antibodies in patients with
varying severity of acute COVID-19 illness. Sci Rep. 2021;11(1):2062.
14. Cevik M, Tate M, Lloyd O, Maraolo AE, Schafers J, Ho A. SARS-CoV-2, SARS-CoV, and MERS-CoV viral
load dynamics, duration of viral shedding, and infectiousness: a systematic review and meta-
analysis. Lancet Microbe. 2021;2(1):e13–22.
15. van Kampen JJA, van de Vijver D, Fraaij PLA, Haagmans BL, Lamers MM, Okba N, van den Akker
JPC, Endeman H, Gommers D, Cornelissen JJ, et al. Duration and key determinants of infectious
virus shedding in hospitalized patients with coronavirus disease-2019 (COVID-19). Nat Commun.
2021;12(1):267.
16. Perera R, Tso E, Tsang OTY, Tsang DNC, Fung K, Leung YWY, Chin AWH, Chu DKW, Cheng SMS, Poon
LLM, et al. SARS-CoV-2 Virus Culture and Subgenomic RNA for Respiratory Specimens from Patients
with Mild Coronavirus Disease. Emerg Infect Dis. 2020;26(11):2701–4.
17. Jeewandara C, Jayathilaka D, Ranasinghe D, Hsu NS, Ariyaratne D, Jayadas TT, Madushanka D,
Lindsey BB, Gomes L, Parker MD, et al: Genomic and epidemiological analysis of SARS-CoV-2 viruses
in Sri Lanka. medRxiv 2021:2021.2005.2005.21256384.
18. Wolfel R, Corman VM, Guggemos W, Seilmaier M, Zange S, Muller MA, Niemeyer D, Jones TC, Vollmar
P, Rothe C, et al. Virological assessment of hospitalized patients with COVID-2019. Nature.
2020;581(7809):465–9.
19. Widders A, Broom A, Broom J. SARS-CoV-2: The viral shedding vs infectivity dilemma. Infect Dis
Health. 2020;25(3):210–5.
20. Coyle PV, Molawi NHA, Kacem MABH, Kahlout RAE, Kuwari EA, Khal AA, Gilliani I, Jeremijenko A,
Saeb H, Thani SMA, et al: Inclusion of cycle threshold (CT) values when reporting SARS-CoV-2 RT-
PCR results improves clinical Interpretation in suspected and confirmed COVID-19. medRxiv
2021:2021.2002.2011.21251557.
21. Kampf G, Lemmen S, Suchomel M: Ct values and infectivity of SARS-CoV-2 on surfaces. The Lancet
infectious diseases 2020.
22. Rao SN, Manissero D, Steele VR, Pareja J. A Systematic Review of the Clinical Utility of Cycle
Threshold Values in the Context of COVID-19. Infect Dis Ther. 2020;9(3):573–86.
Page 13/1723. Walsh KA, Spillane S, Comber L, Cardwell K, Harrington P, Connell J, Teljeur C, Broderick N, de Gascun
CF, Smith SM, et al. The duration of infectiousness of individuals infected with SARS-CoV-2. J Infect.
2020;81(6):847–56.
24. Watson J, Richter A, Deeks J. Testing for SARS-CoV-2 antibodies. BMJ (Clinical research ed.
2020;370:m3325.
Figures
Page 14/17Figure 1
Cycle threshold (Ct) values for different gene targets in different RT-qPCR kits compared to the results of
the SD-Biosensor rapid Ag kit. The Ct values for the RdRP gene (A), S gene (B), N gene (C) and E gene (D)
was compared for different kits for Ag positive and Ag negative samples. The lines indicate the median
and the error bars the IQR.
Page 15/17Figure 2
Cycle threshold (Ct) values for different gene targets in different RT-qPCR kits compared to the results of
the Abbott rapid Ag kit. The Ct values for the RdRP gene (A), S gene (B), N gene (C) and E gene (D) was
compared for different kits for Ag positive and Ag negative samples. The lines indicate the median and
the error bars the IQR.
Page 16/17Figure 3
Comparison of the Ct values for different gene targets of RT-qPCR kits of positive samples from the SD-
Biosensor Ag kit and the Abbott Ag kit. The Ct values for the RdRP gene (A), S gene (B), N gene (C) and E
gene (D) was compared for different kits for SD-Biosensor Ag positive and Abbot Ag positive samples.
The lines indicate the median and the error bars the IQR.
Page 17/17You can also read