Physical and luminescence properties of rare earth doped phosphate glasses for solid state lighting applications - ThaiJO

Page created by Sergio Frazier
 
CONTINUE READING
Physical and luminescence properties of rare earth doped phosphate glasses for solid state lighting applications - ThaiJO
Volume 14, Number 3, Pages 20 – 26

     Physical and luminescence properties of rare earth doped phosphate
                  glasses for solid state lighting applications

    M. Shoaib1 , N. Chanthima2,3,∗ , G. Rooh1 , R. Rajaramakrishna2 , and J. Kaewkhao2,3
                             1 Departmentof Physics, Abdul Wali Khan University, Mardan 23200, Pakistan
                       2
                      Physic Program, Faculty of Science and Technology, Nakhon Pathom Rajabhat University,
                                                  Nakhon Pathom, 73000, Thailand
         3 Center of Excellence in Glass Technology and Materials Science (CEGM), Nakhon Pathom Rajabhat University,

                                                  Nakhon Pathom, 73000, Thailand

                                                              Abstract
Luminescent glass for use in LED based lighting applications has recently attracted significant research interest. Samples of
oxyfluoride phosphate glass doped with Dy2 O3 and Eu2 O3 were prepared using the conventional melt quenching process. The
samples were studied through analysis of their density, molar volume, refractive index, absorption spectra, emission spectra,
excitation spectra, decay time profile and by plotting their characteristics on a CIE diagram. It was found that the density of the
glass samples produced increased with the concentration of ions in them. The absorption spectra for glass samples produced
using both ions had clear absorption peaks. The excitation spectra that were found for NSDy and NSEu showed the strongest
peaks at 350 and 393 nm respectively. It was thought that these peaks corresponded to the transition of 6 H15/2 and 7 F0 to the
excited states 6 F11/2 + 6 H9/2 and 5 L6 respectively. The Judd-Ofelt (JO) theory was used to calculate the JO intensity parameters
and radiative properties of the glass samples that were produced. The emission peaks that were observed at 573 nm for NSDy
and 612 nm for NSEu show higher intensity than the other peaks. It was thought that these peaks corresponded to the transitions
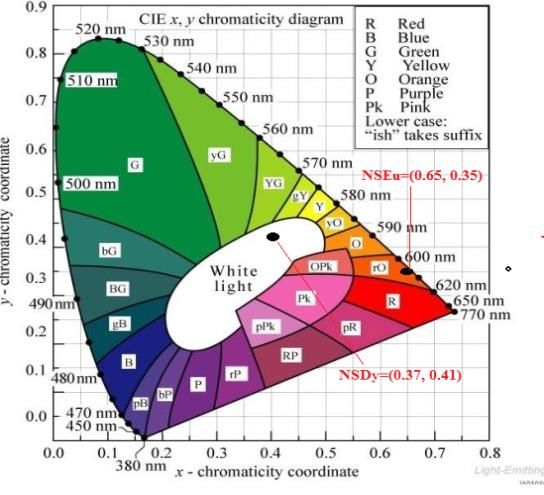
of 6 H13/2 → 4 F9/2 and 5 D0 → 7 F3 respectively. The CIE coordinates showed that the NSDy emits visible light in the white region
and the NSEu emits visible light in the Reddish orange regions. It was concluded that both of the glass types produced could
be good candidates for applications in the field of solid-state lighting and LEDs.

Keywords: Phosphate glass, refractive index, CIE diagram
                                                       Article history: Received 14 January 2019, Accepted 21 June 2019

1. Introduction                                                      doped phosphate glasses. The addition of modifiers
                                                                     ions such as SrO is also known to increase the sta-
   Luminescent materials doped with Rare Earth (RE)                  bility of the glass against devitrification and corro-
ions have attracted the recent attention of many schol-              sion. Glass made with rare earth, RE, ions also has
ars. This is due to the growth of applications for                   an ever increasing list of potential uses in several tech-
new tunable solid-state lasers, solar energy convert-                nological fields. The addition of Na2 O to the glass
ers, white Light Emitting Diodes (w-LEDs), fiber op-                 mixture improves the RE ion solubility leading to the
tic communication devices, field emission displays                   possibility of using even higher concentrations of ions
(FEDs), plasma display panels (PDPs), up-converters,                 [2]. Fluorophosphate hosts are suitable for RE3+ ions
stimulated phosphors, energy storage materials, radi-                due to their optical properties. Fluorophosphate hosts
ation shielding and alternating current driven LEDs                  offer the combined advantages of both fluoride and
(AC-LED) [1].                                                        phosphate glasses. These are high transparency, low
   Among different glass hosts, phosphate glasses                    phonon energy, good moisture resistance, physical and
have unique properties. They have high thermal sta-                  chemical stability, low nonlinear refractive index and
bility, high transparency, a low melting point, a high               high transparency from near UV to the mid IR spectral
gain density and low dispersion rates [2]. There is                  range. In addition to this they have a low production
a great amount of interest in the study of rare-earths               cost when produced in a large quantity. Due to their
                                                                     low phonon energies, the host materials, have been ef-
                                                                     fectively used to increase the efficiency of the radiative
   ∗ Corresponding   author; email:natthakridta@webmail.npru.ac.th
                                                                                                          DOI 10.14456/jtir.2019.25
Journal of Thai Interdisciplinary Research                                                                                 21

emissions from the ion doped glass [3].                         The equation used for the calculation of the molar
   Among rare earth ions that were of interest for this       volume was
research Dysprosium is perhaps one of the most im-                                       M
portant. This is because of its compounds having ex-                            Vmol =         (cm3 /mol)                  (2)
                                                                                         ρ
cellent optical, electrical and magnetic properties. The
luminescence lines of Dy3+ are in the 470-500-nm re-          where Vmol is the molar volume, M is the molecular
gion due to the 4 F9/2 →6 H15/2 transition, and in the        mass and ρ is the density of each sample.
570-600-nm region due to the 4 F9/2 →6 H13/2 transi-             An Abbe refractometer was used to measure the re-
tion. If the emission intensity of the two transitions is     fractive index (n) of each sample. This contained a
equal, the color of the luminescence produced is close        sodium-vapor lamp as a light source and used mono
to white [4]. Triply ionized Europium (Eu3+ ) ions are        bromo-naphthalene (C10 H7 Br) as a contact liquid. The
also of great interest due to the narrow and monochro-        UV-Vis-NIR absorption spectrum for each sample
matic nature of the 5 D0 →7 F2 transition which pro-          was recorded using a UV-Vis-NIR spectrophotome-
duces red light at around 610 nm [5].                         ter (Shimadzu, UV-3600) in the wavelength range
   In this research Dy2 O3 and Eu2 O3 doped phosphate         from 200 to 2500 nm. Photoluminescence excitation
glasses samples were prepared using the melt quench-          and emission spectra were recorded using a fluores-
ing technique. They were also modified through the            cence spectrophotometer (Agilent Technologies, Cary
addition of Na2 O and SrO in the process. Following           Eclipse) with a xenon lamp as a light source. Lumi-
this the physical and luminescence properties of the          nescence decay time measurements were carried out
samples were investigated. Density, refractive index,         using the same device. The CIE 1931 chromaticity
absorption spectra, photo-luminance and decay time            diagram was used to characterize the emission color
were all analysed.                                            of the samples in the electromagnetic visible spec-
                                                              trum. The quality of the emitting light was evaluated
                                                              by comparison of the correlated color temperature, or
2. Experimental Details                                       CCT, values.
                                                                 The f-f transitions that were thought to occur in our
                                                              glass samples were studied through the use of JO the-
  Glass samples were prepared using the melt
                                                              ory. The theory shows that the experimental and the
quenching technique. The chemical composition of
                                                              calculated oscillator strengths for observed absorption
he samples was as follows:
                                                              bands correspond to the transition of an ion from an
  NSDy – 10Na2 O: 10SrO: 10GdF3 : 69P2 O5 : 1Dy2 O3
                                                              initial state with wave function ψJ to a final state hav-
  NSEu – 10Na2 O: 10SrO: 10GdF3 : 69P2 O5 : 1Eu2 O3 .         ing wave function ψ0 J 0 . These are given by Eq. 3 and
   The terms NSDy and NSEu will be used to refer to           Eq. 4 respectively [7].
these samples for the remainder of this paper.
   The compounds Na2 CO3 , SrCO3 , GdF3 ,
                                                                        3.303mc2
                                                                                   Z                               Z
NH4 H2 PO4 , Dy2 O3 and Eu2 O3 were used as                    fext   =                ε(v)dv = 4.318 × 10    −9
                                                                                                                       (v)dv
raw materials for the production of the glass samples.                    πe2 N
The compounds were weighed to give the proportions                                                                         (3)
shown above and were mixed thoroughly. Alumina
crucibles were used to melt the mixture at 1200 ◦ C                    8π2 mcv (n2 + 2)2 X
in an electric furnace. After being melted for 3 hours        fcal =                                Ωλ (ψ j || U λ || ψ0 j0 )2
                                                                     3h(2 j + 1)      9n    λ=2,4,6
in the electric furnace the melt was poured on a
stainless-steel mold and allowed to quench. The glass                                                                     (4)
samples were then annealed at 300 ◦ C to remove               where Ωλ (λ = 2, 4, 6) are known as the JO intensity
internal stresses. Finally the glass samples were cut         parameters.
and polished so that they were ready for analysis.               These JO parameters can be determined using the
                                                              experimental oscillator strengths obtained from Eq. 1
   The density of glass samples was measured using
                                                              and Eq. 2. The least-squares fitting approximation is
the Archimedes’ principle. Water was used as the im-
                                                              then used to obtain JO parameters. Once the JO pa-
mersion liquid. The weights of the glass samples were
                                                              rameters are obtained they can be used in Eq. 4 to find
measured in water as well as in air. The equation re-
                                                              the calculated oscillator strength.
ported in previous literature [6] was then used to cal-
                                                                 In Eq. 4 the refractive index of the glass is given
culate the density of each sample using Eq. 1.
                                                              by n, J represents the total angular momentum of the
                   wair                                       ground state, v (cm−1 ) is the energy of the transition
         ρ=                 × ρwater    (g/cm3 )        (1)   and || Uλ || is the squared doubly reduced matrix ele-
              wair − wwater
                                                              ments of the unit tensor operator. These are calculated
where wair is the weight of the samples in air and the        for λ = 2, 4 and 6 from the intermediate coupling ap-
wwater is the weight in water. 1.000 g/cm3 is the density     proximation for the transition from state with ψ j to
of the water that was used for the calculation.               state with ψ0 j0 at energy v (cm−1 ). It should be noted
22                                                                                                                                                                                                      Vol. 14 No. 3 May – June 2019

                                                                                                   Table 1. Density, molar volume and refractive Index.

                                                         Samples                       Density (g/cm3 )                    Molar volume (cm3 /mol)                                               Refractive index
                                                           Host                         2.845±0.003                                 48.35                                                             1.527
                                                          NSDy                          2.855±0.001                                 48.84                                                             1.530
                                                          NSEu                          2.875±0.005                                 48.49                                                             1.530

                                         6                                                          1275nm           NSDy                                                                                                               NSEu
                                            H15/2                                                                                                                               (B)
                                                                                                                      (A)

                                                                                                                                                                                                                          2086 nm
         Absorption (arb.units)

                                                                                                                                                                                                                                    2210 nm
                                                                                                                                      Absorption (arb.units)

                                                                                                                                                                       395 nm
                                         386nm

                                                                                                                                                                                        533 nm
                                                                                          1095nm

                                                                                                                                                                                465nm
                                                                              901nm
                                              451nm

                                                                                                                  1683nm
                                                                     804nm
                                                             754nm

                                   300                600                    900            1200           1500            1800                                300                         600             1800          2100                 2400
                                                                             Wavelength (nm)                                                                                                     Wavelength (nm)

                                                      Figure 1: Absorption spectra in the UV-Vis-NIR region for the (A) Dy doped and (B) Eu doped glasses.

that the squared doubly reduced matrix elements are
independent of the host [8].
                                                                                                                                                                                                          λ4p
                                                                                                                                                                     σ(λ p )(ψJ, ψ0 J 0 ) =                          A(ψJ, ψ0 J 0 )              (10)
                 64π4 v3 n(n2 + 2)2           64π4 v3 3                                                                                                                                               8πcn2∆λe f f
AR(ψ j,ψ0 ) =                        S ed +             n S md
               3h(2 j + 1)   9              3h(2 j + 1)
                                                          (5)                                                                                         In this equation λ p is the “emission peak wave-
                                                                                                                                                   length” and ∆λe f f is its “effective linewidth”. The ef-
   In this equation S ed and S md represent electric-
                                                                                                                                                   fective linewidth can be found by dividing the area of
dipole and magnetic-dipole line strengths which are
                                                                                                                                                   the emission band by its average height.
given by the following equations respectively,
                        X
             S ed = e2     Ωλ (ψ j || U λ || ψ0 j0 )2     (6)                                                                                      3. Results and Discussion
                                                            λ=2,4,6
                                                                                                                                                   3.1. Physical properties
                                                                                                                                                      The values for density, molar volume and refrac-
                                      e2 h2    X
                                                                                                                                                   tive index that were found for the glass samples that
 S md                             =    2   2 2
                                                    Ωλ (ψ j || L + 2S || ψ0 j0 )2 (7)
                                    16π m c λ=2,4,6                                                                                                were produced are shown in Table 1. From the table it
                                                                                                                                                   can be clearly seen that the densities of the glass sam-
     The radiative life time, τR , is given by Eq. 8                                                                                               ples increased with the increasing concentration of RE
                                                                                                                                                   ions in the samples. The densities of the samples was
                                                                                 1                                                                 thought to increase because one of the lower molec-
                                                               τR =                                                         (8)
                                                                              AT (ψ j)                                                             ular weight components of the glass composition is
                                                                                                                                                   replaced by a a compound with a higher molecular
where AT is the total transition probability. AT is equal                                                                                          weight. This has the impact of increasing the average
to the sum of all energy states at energy lower than                                                                                               molecular weight of the sample and hence the density.
ψ0 J 0 .                                                                                                                                           The refractive index of a sample is directly related to
   The relative intensities of all of the emission lines                                                                                           its density. the higher density of the glass indicates a
originating from a given excited state can be predicted                                                                                            more compact structure which slows the movement of
by use of the branching ratio (βR ). The branching ratio                                                                                           light causing a higher refractive index [10].
of the system can be determined from Eq. 9.

                                                                                      AR (ψJ, ψ0 J 0 )                                             3.2. Absorption spectra
                                              βR (ψJ, ψ0 J 0 ) =                                                            (9)                       Figures 1 (A) and (B) show the absorption spectra
                                                                                        AT (ψJ)
                                                                                                                                                   for the Dy2 O3 doped and Eu2 O3 doped samples that
  The emission cross section can be calculated using                                                                                               were produced. In the NSDy glass absorption spectra
Eq. 10.                                                                                                                                            eight characteristics peaks were observed. These were
Journal of Thai Interdisciplinary Research                                                                                                                                                                                                                                  23

                                    6       3+                                                                     (A)                  NSDy
                                                                                                                                                                                λem=612 nm                                                                          NSEu
                                 ( H15/2)Dy                                                                                                                                      7
                                                                                                                                                                                                                             393nm
                                                                                  350 nm
                                 8         3+                                                                                λem= 573nm                                           F0,1                                                                               (B)
                                ( S7/2 )Gd
                                                                                                                                                                                8       3+
                                                                                                                                                                                 S7/2(Gd )

                                                                                                                                                       Intensity (arb.units)
       Intensity (arb.units)

                                                                                       364 nm

                                                                                                                                                                                                                    381 nm
                                                                                                                                                                                     CT

                                                                                                                                                                                                          312nm
                                                                                                386 nm

                                                                                                                                                                                                                                       464nm
                                                              312 nm

                                                                        325 nm

                                                                                                                                                                                                                  361nm

                                                                                                                                                                                                                                                     524nm
                                                                                                                    452 nm

                                                                                                                                                                                                                                                             533nm
                                              253 nm

                                                                                                                                                                                                                               414nm
                                                                                                                                                                                                  299nm
                                                         275 nm

                                                                                                           425 nm

                                                                                                                                                                                          275nm
                                                                                                                              473 nm
                                                       297 nm

                               200       250               300                   350                 400            450                500   550                               200                 300                       400               500             600
                                                                        Wavelength (nm)                                                                                                                            Wavelength (nm)

                                                                                 Figure 2: Excitation spectra for the (A) Dy doped and (B) Eu doped glasses.

                                                                       Figure 3: Partial energy level diagram for the (A) Dy doped and (B) Eu doped glasses.

positioned at 386, 451, 802, 901, 1097, 1275 and 1683                                                                                                  the rare earth ions in glass structures. Higher asym-
nm. These were thought to correspond to the Dy3+                                                                                                       metry around rare earth ions can result in the efficient
transition from the ground state, 6 H15/2 , to the excited                                                                                             emission of white and reddish orange light from Dy
states 4 F7/2 , 4 I15/2 , 6 F5/2 , 6 F7/2 , 6 F9/2 , 6 F11/2 + 6 H9/2                                                                                  and Eu doped glasses. Hence higher values of Ω2 indi-
and 6 H11/2 , respectively [11].                                                                                                                       cate that the glass samples produced may be potential
   It was thought that the transition at 1275 nm corre-                                                                                                candidates for solid state lighting applications. Fur-
spond to 6 H15/2 →6 F11/2 + 6 H9/2 . This was observed                                                                                                 thermore, the values of Ω4 and Ω6 also give informa-
as being the hyper sensitive transition and its intensity                                                                                              tion about the bulk structure of glass samples.
was seen to be highly affected by the composition of
the host glass.                                                                                                                                        3.3. Photoluminescence emission and excitation
   In the NSEu absorption spectra, a total of five char-                                                                                                  Fig. 2 shows the excitation spectra for the glass
acteristics Eu3+ ions peaks were observed. These were                                                                                                  samples that were produced. The excitation spectrum
at 395, 465, 533, 2086 and 2210 nm. It was thought                                                                                                     for the NSDy sample was recorded at 573 nm. Twelve
that these corresponded to transitions from the ground                                                                                                 clear peaks were observed. The three peaks positioned
state, 7 F0 , to the excited states of 5 L6 , 5 D2 , 5 D1 and 7 F6                                                                                     at 253, 275 and 312 nm were thought to be due to
respectively. The peak at 2205 nm appeared to corre-                                                                                                   the transition of Gd3+ ions from their ground state,
spond to the transition from the thermally excited state                                                                                               8
                                                                                                                                                         S7/2 , to the excited states 6 D9/2 , 6 I9/2 and 6 P7/2 . Peaks
7
  F1 to the 7 F6 state [12].                                                                                                                           were observed at 297, 325, 350, 364, 386, 425 452
   The JO intensity parameters were calculated from                                                                                                    and 473 nm. These were thought to correspond to
the refractive index and the bands observed in the ab-                                                                                                 transitions from the ground state, 6 H15/2 , to the ex-
sorption spectra. They are listed in Table 2. The                                                                                                      cited states 4 H13/2 , 4 K15/2 , 4 M15/2 +6 P7/2 , 4 I11/2 , 4 I13/2 ,
Ω2 corresponded to an asymmetry around the rare                                                                                                        4
                                                                                                                                                         G11/2 , 4 I15/2 and 4 F9/2 . The excitation transitions for
ions and bonding nature of rare earth with other ions.                                                                                                 both types of glass are illustrated in the partial energy
Higher values of Ω2 indicate higher asymmetry around                                                                                                   level diagram shown in Fig. 3(A).
24                                                                                                                                                                                                                                                 Vol. 14 No. 3 May – June 2019

                                                                                                                                                                
                                                                                                                                                                                                                                                                                  NSEu
                                                  4                                                     (A)             NSDy                                                                                       λex=393 nm           612nm
                                                  F9/2                         573 nm                                                                                                                           5
                                                                                                                                                                                                                   D0                                                          (B)
                                                                                                              λext= 350 nm

                                                                                                                                                                                      Intensity (arb.units)
                 Intensity (arb.units)

                                                              483 nm

                                                                                                                                                                                                                            591nm

                                                                                                                                                                                                                                                                699 nm

                                                                                               675 nm

                                                                                                                    751 nm
                                                                                                                                                                                                                    577nm                          651nm

                                                400                    500          600                   700                 800                                                                             550               600                650          700                   750
                                                                             Wavelength (nm)                                                                                                                                              Wavelength (nm)

                                                                                 Figure 4: Emission spectra for the (A) Dy doped and (B) Eu doped glasses.

                                                     1                                                                                                                                               1
                                                                                                                                                                                                                                                                               NSEu
                                                                                                                             NSDy

                                                                                                                                              Normalized log intensity ( arb.units)
                                                                                                                             IH Fit
                                                                                                                                                                                                                                                                         (B)
         Normalized log intneisyt (arb.units)

                                                                                                                              (A)

                                                  0.1

                                                 0.01

                                                                                                                                                                                         0.1

                                                          0              1         2               3               4                  5                                                                        0        1           2      3        4       5    6             7          8

                                                                                       Time (ms)                                                                                                                                                Time (ms)

                                                                                Figure 5: Decay time profile for the (A) Dy doped and (B) Eu doped glasses.

                                                                                                                                                             states 5 F1 , 5 D4 , 5 G2 , 5 L6 , 5 D2 and 5 D1 . The two peaks
                                                                                                                                                             at 414 and 533 nm were thought to correspond to the
                                                                                                                                                             7
                                                                                                                                                               F1 → 5 D3 , and 7 F1 →5 D1 transitions. A charge trans-
                                                                                                                                                             fer band (CT) was also observed in the NSEu sam-
                                                                                                                                                             ple. This represents a transfer of charge between the
                                                                                                                                                             metal and ligand ions within the sample. Wavelengths
                                                                                                                                                             of 350 and 393 nm were used to record the emission
                                                                                                                                                             spectra for respective samples of NSDy and NSEu be-
                                                                                                                                                             cause the peaks were the most intense. The excitation
                                                                                                                                                             transitions for both types of glass are illustrated in the
                                                                                                                                                             partial energy level diagram shown in Fig. 3(B).
                                                                                                                                                                Fig. 4 shows the emission spectra of the NSDy and
                                                                                                                                                             NSEu glass samples. The characteristics of the Dy3+
 Figure 6: CIE diagram for the NSDy doped and NSEu glasses.                                                                                                  and Eu3+ ion emission peaks were assessed. The emis-
                                                                                                                                                             sion spectra of the NSDy glass sample was found to
                                                                                                                                                             have four transition bands at 483, 573, 675 and 751
                                                                                                                                                             nm. These were thought to correspond to transitions of
   Ten excitation peaks were observed in the analy-                                                                                                          the ions from the 4 F9/2 level to 6 H15/2 , 6 H13/2 , 6 H11/2
sis of the NSEu sample. The peaks at 275 and 312                                                                                                             and 6 H9/2 +4 F11/2 levels. The NSEu spectra had five
nm were thought to corresponding to the Gd3+ transi-                                                                                                         emission peaks at 577, 591, 612, 651 and 699 nm.
tions as mentioned for the NSDy sample. Other peaks                                                                                                          These were thought to correspond to transitions from
were observed at 299, 361, 381, 393, 464, and 524                                                                                                            the 5D0 level to the 7 F1 , 7 F2 , 7 F3 and 7 F4 levels. The
nm. These were thought to correspond to the transi-                                                                                                          peaks at 573 nm for NSDy and 612 nm for NSEu
tion of Eu3+ ions from the ground state, 7 F0 , to excited                                                                                                   showed the highest intensity. and were therefore used
Journal of Thai Interdisciplinary Research                                                                                     25

                                Table 2. Comparison of J-O intensity parameters with reported studies.

           References                      Ω2 (10−20 cm2 )       Ω4 (10−20 cm2 )     Ω6 (10−20 cm2 )          Trend
           Dy3+ Doped glass
           NSDy [present work]             12.38                 6.31                3.20                Ω2   > Ω4   > Ω6
           DyZB10P [13]                    3.950                 0.915               1.954               Ω2   > Ω4   > Ω6
           PPBAlDy [14]                    8.92                  2.55                2.99                Ω2   > Ω4   > Ω6
           PZSMDy1.0 [15]                  11.07                 2.8157              2.1841              Ω2   > Ω4   > Ω6
           CaDy [16]                       1.36                  0.03                0.56                Ω2   > Ω6   > Ω4
           1 DZCTFB [17]                   9.51                  1.8380              3.9577              Ω2   > Ω6   > Ω4
           LSBP1Dy [18]                    5.24                  2.32                1.97                Ω2   > Ω4   > Ω6
           Eu3+ doped glass
           NSEu [present work]             15.65                 10.00               8.12                Ω6   > Ω4   > Ω2
           G1 glass [19]                   14.83                 4.01                2.87                Ω2   > Ω4   > Ω6
           G2 glass [19]                   17.25                 4.62                4.6                 Ω2   > Ω4   > Ω6
           PbFPDy10 [20]                   7.12                  1.59                2.20                Ω2   > Ω6   > Ω4
           PKMAFDy [21]                    7.04                  1.73                1.57                Ω2   > Ω4   > Ω6
           PKAICaFEU10 [22]                7.49                  6.30                0.50                Ω2   > Ω4   > Ω6

Table 3. The radiative transition probability (Ar, (s−1 )), stimu-        Dy3+ ions and the energy transfer parameter. For the
lated emission cross section (σ,10−21 cm2 )) and branching ratio
(βr ) of prepared glasses                                                 NSDy glass sample it was found to be 0.48. The de-
                                                                          cay time for the NSEu sample was measured at an ex-
  Transitions              AR         Σ       βR(exp)    βR(cal)          citation wavelength of 393 nm and an emission wave-
 NSDy (4 F9/2 →)                                                          length of 612 nm. It was found to 2.51 ms. the Energy
    6
      H15/2               199       0.55       0.37       0.13            transfer between the Eu3+ -Eu3+ ion is not dominant
    6
      H13/2               978       5.70       0.59       0.63            and hence the decay time curve shows single expo-
    6
      H11/2               113       0.97       0.02       0.07            nential behavior.
     6
       H9/2               110       1.08       0.01       0.07
                                                                          3.5. CIE diagram
 NSEu (5 D0 →)
       7
         F0                —         —         0.01        —                 The emission color of two types of glass was com-
       7
         F1                53       2.92       0.12       0.05            pared using their color coordinates. In 1931; the Com-
       7
         F2              1131      44.32       0.80       0.75            mission International de I’Eclairage (CIE) established
       7
         F3                —         —         0.02        —              a universal quantitative model of color spaces, the CIR
       7
         F4               245      30.60       0.06       0.17            diagram [24]. Fig. 6 shows the CIE diagram for the
                                                                          two types of glass that were studied.
                                                                             From the CIE diagram it is clear that the NSDy
                                                                          glass emits visible light in the white region of light
for excitation spectra recording. From Fig.4 it can be
                                                                          spectrum while the NSEu emits visible light in the
clearly seen that the glass samples that were produced
                                                                          reddish-orange region. This is the same result as was
show efficient luminescence. This is also supported by
                                                                          obtained by visually inspecting the samples. It con-
the high Ω2 values.
                                                                          firms that the two types of glass may be useful in solid
   The radiative properties of the glass samples are
                                                                          state lighting devices.
listed in Table.3. It can be seen that the NSDy sam-
ple demonstrated higher values of radiative transi-
tion probability, stimulated emission cross section and                   4. Conclusions
branching ratio for 4 F9/2 →6 H11/2 transitions than the
                                                                             Dy2 O3 and Eu2 O3 doped phosphate glass was pre-
other sample. The NSEu sample showed higher values
                                                                          pared using the melt quenching process. The proper-
of these properties for 5 D0 →7 F2 transition.
                                                                          ties the glass samples that were produced were inves-
                                                                          tigated. The absorption spectra for both glass samples
3.4. Decay time profile                                                   had differing characteristics absorption peaks. The
   Fig. 5 show the decay time profile of the glass sam-                   excitation spectra for NSDy and NSEu showed the
ples that were produced. The decay time was mea-                          strongest peaks at 350 and 393 nm respectively. The
sured for NSDy at 350 nm excitation wavelength and                        were thought to correspond to the transition from the
573 nm emission wavelength. It was found to be 0.51                       respective ground states 6 H15/2 and 7 F0 to the excited
ms. The decay profile for the NSDy sample showed                          states 6 F11/2 + 6 H9/2 and 5 L6 . The JO intensity pa-
non-exponential behavior. This finding fits within the                    rameter Ω2 was calculated. It showed relatively high
frame work of IH model with S=6[23]. This indicates                       values for the samples that were produced. This re-
the dipole-dipole energy transfer between the Dy3+ -                      flects the higher asymmetry around rare earth ions in
26                                                                                                       Vol. 14 No. 3 May – June 2019

glass structures. This is thought to result in more ef-                  [12] W. T. Carnall, P. R. Fields, K. Rajnak, Electronic energy levels
ficient radiation emission. This confirms the useful-                        of the trivalaent lanthanide aquo Ions, IV.Eu. J. Chem. Phys. 49
                                                                             (1968) 4450-4455.
ness of the glass types that were produced in solid state                [13] R. Vijayakumar, G. Venkataiah, K. Marimuthu, Structural and
lighting applications. The emission peaks at 573 nm                          luminescence studies on Dy3+ doped boro-phosphate glasses
for NSDy and 612 nm for NSEu showed the highest                              for white LED’s and laser applications. J. Alloy Compd. 652
intensity. These peaks were thought to correspond to                         (2015) 234-243.
                                                                         [14] G. C. Ram, T. Narendrudu, S. Suresh, A. S. Kumar, A.
the transitions 6 H13/2 →4 F9/2 and 5 D0 →7 F3 . The radia-                  V. Sambasiva Rao, V. R. Kumar, D. K. Rao, Investiga-
tive properties such as radiative transition probability,                    tion of luminescence and laser transition of Dy3+ ion in
stimulated emission cross section and branching ratio                        P2 O5 :PbO:Bi2 O3 :R2 O3 (R= Al, Ga, In) glasses. Opt. Mater.
were calculated for the samples using JO theory. The                         66 (2017) 189-196.
                                                                         [15] F. Ahmadi, R. Hussin, S. K. Ghoshal, Judd-Ofelt intensity pa-
value that was found for branching ratio was higher                          rameters of samarium-doped magnesium zinc sulfophosphate
than 50%. This indicates that the glass may be suit-                         glass, J. Non-Cryst. Solids, 452 (2016) 266-272.
able for use in lasers. The CIE coordinates were found                   [16] V. R. Kumar, G. Giridhar, N. Veeraiah, Influence of modifier
for the samples. These showed that the NSDy glass                            oxide on emission features of Dy3+ ion in Pb3 O4 -ZnO-P2 O5
                                                                             glasses, Opt. Mater., 60 (2016) 594-600.
emits in the white region and NSEu glass emits in the                    [17] P. Karthikeyan, S. Arunkumar, K. Annapoorani, K.
reddish orange region. From the results that were ob-                        Marimuthu, Investigations on the spectroscopic properties of
tained in this study and those from previous studies, it                     Dy3+ ions doped Zinc calcium tellurofluoroborate glasses.
                                                                             Spectrochim. Acta A., 193 (2018) 422-431.
is concluded that both of the glass systems that were                    [18] R. Vijayakumar, G. Venkataiah, K. Marimuthu. Structural and
produced would be good candidates for applications                           luminescence studies on Dy3+ doped boro-phosphate glasses
in the field of solid-state lighting.                                        for white LED’s and laser applications. J. Alloy Compd. 625
                                                                             (2015) 234-243.
                                                                         [19] P. V. Do, V. Tuyen, V. X. Quang, N. M. Khaidukov, N. T.
Acknowledgement                                                              Thanh, B. Sengthong, B. T. Huy, Energy transfer phenomena
                                                                             and Judd-Ofelt analysis on Sm3+ ions in K2GdF5 crystal. J.
   The author would like to extend sincere thanks to                         Lumin., 179 (2016) 93-99.
                                                                         [20] C. R. Kesavulu, C. K. Jayasankar, White light emission in
the Dr. J. Kaewkhao, CEGM, NPRU, Thailand and Dr.
                                                                             Dy3+ -doped lead fluorophosphate glasses, Mater. Chem. Phys.,
G. Rooh Department of physics, AWKUM, Pakistan                               130 (2011) 1078-1085.
for financial and technical supports.                                    [21] C. Basavapoornima, C. K. Jayasankar, P. P. Chandrachoodan,
                                                                             Luminescence and laser transition studies of Dy3+ : K-Mg-Al
                                                                             fluorophosphates glasses. Physica B., 404 (2009) 235-242.
References                                                               [22] Rasool SN, Moorthy LR, Jayasankar CK, Optical and lumi-
                                                                             nescence properties of Eu3+ -doped. Mater. Express. 2013; 3(3):
[1] L. Shamshad, N. Ali, Ataullah, J. Kaewkhao, G. Rooh, T.                  1-10.
    Ahmed, F. Zaman, Luminescence characterization of Sm3+ -             [23] R. Praveena, R. Vijaya, C. K. Jayasankar, Photoluminescence
    doped sodium potassium borate glasses for laser application.             and energy transfer studies of Dy3+ -doped flu orophosphate
    J. Alloy Compd. 766 (2018) 828-840.                                      glasses. Spectrochim. Acta A. 70 (2008) 577-586.
[2] A. A. Reddy, M. C. Sekhar, K. Pradeesh, S. S. Babu, G. V.            [24] C. R. Kesavulu, H. J. Kim, S. W. Lee, J. Kaewkhao, E.
    Prakash, Optical properties of Dy3+ -doped sodium-aluminum-              Kaewnuam, N. Wantana, Luminescence properties and energy
    phosphate glasses, J Mater Sci, 46 (2011) 2018-2023.                     transfer from Gd3+ to Tb3+ ions in gadolinium calcium silicob-
[3] N. Vijaya, C. K. Jayasankar, Structural and spectroscopic prop-          orate glasses for green laser application. J. Alloy Compd., 704
    erties of Eu3+ -doped zinc fluorophosphate glasses. J. Mol.              (2017) 557-564.
    Struct. 1036 (2013) 42-50.
[4] Cornelis (Cees) R. Ronda, Luminescence from Theory to Ap-
    plications, Wily-VCh., (2007).
[5] K. Linganna, C. K. Jayasankar, Optical properties of Eu3+ ions
    in phosphate glasses. Spectrochim. Acta A. 97 (2012) 788-797.
[6] U. B. Chanshetti, V. A. Shelke, S. M. Jadhav, S. G. Shankar-
    war, T. K. Chondhekar, A. G. Shankarwar, V. Sudarsan, M.
    S. Jogad, Density and molar volume studies of phosphate
    glasses. FACTA UNIVERSITATIS Series: Physics, Chemistry
    and Technology. 1 (2019 29-36.
[7] ) C. R. Kesavulu, C.K. Jayasankar, White light emission in
    Dy3+ -doped lead fluorophosphate glasses. Mater. Chem. Phys.,
    130 (2011) 1078-1085
[8] S. S. Babu, P. Babu, C. K. Jayasankar, Th. Tröster, W. Sievers,
    G. Wortmann, Optical properties of Dy3+ doped phosphate and
    fluorophosphate glasses. Opt. Mater., 31 (2009) 624-631.
[9] R. Praveena, R. Vijaya, C. K. Jayasankar, Photoluminescence
    and energy transfer studies of Dy3+ -doped fluorophosphate
    glasses. Spectrochim. Acta A., 70 (2008) 577-586.
[10] F. Zaman, J. Kaewkhao, G. Rooh, N. Srisittipokakun, H. J.
    Kim, Optical and luminescence properties of Li2 O-Gd2 O3 -
    MO-B2 O3 -Sm2 O3 (MO=Bi2 O3 , BaO) glasses. J. Alloy Compd.
    676 (2016) 275-285.
[11] W. T. Carnall, P. R. Fields, K. Rajnak, Electronic Energy Lev-
    els in the Trivalent Lanthanide Aquo Ions. I. Pr3+ , Nd3+ , Pm3+ ,
    Sm3+ , Dy3+ , Ho3+ , Er3+ , and Tm3+ . J. Chem. Phys. 49 (1968)
    4424-4455.
You can also read