SAN FRANCISCO HOUSING INVENTORY 2019
←
→
Page content transcription
If your browser does not render page correctly, please read the page content below
2019
SAN FRANCISCO
HOUSING INVENTORY
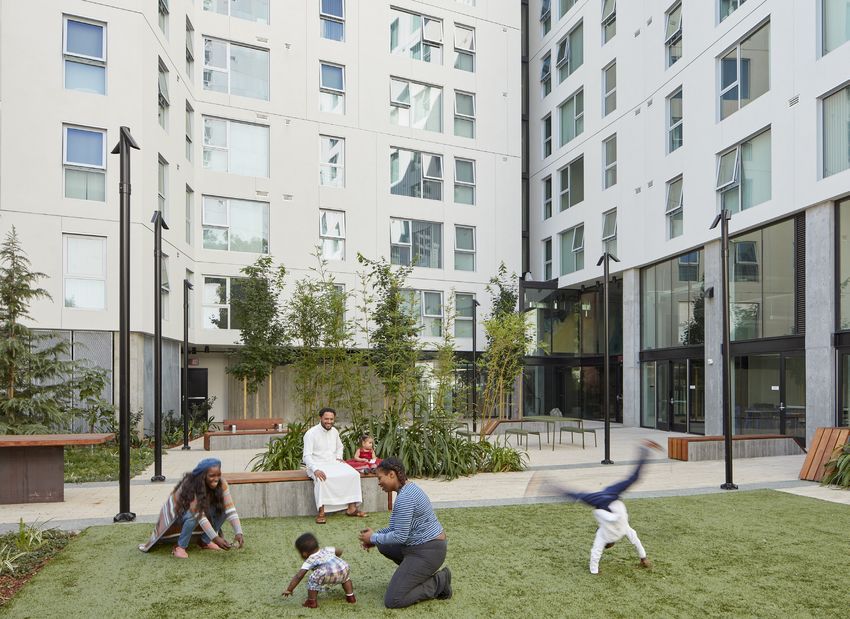
© 2020 San Francisco Planning Department
1650 Mission Street, Suite 400             Front Cover: 210 Taylor Street, 112 Affordable Housing Units;
San Francisco, CA 94103-3114
www.sfplanning.org                         Photo Source: https://www.dbarchitect.com/ Photo Credit: Bruce Damonte
2019
SAN FRANCISCO
HOUSING INVENTORY

           San Francisco Planning Department
                                March 2020
TABLE OF CONTENTS
Introduction 01
Highlights 05
Findings 17
Housing Stock 17
Housing Production Trends 18
New Housing Construction 18
Projects Approved and Under Review by Planning 20
Units Authorized for Construction 21
Demolitions 21
Alterations and Conversions 21
Accessory Dwelling Units 24
Additional Units Proposed Through Density Bonus Programs 25
New Housing Unit Trends 27
Types of Buildings 27
New Housing Units Added by Zoning District 27
Condominiums 29
New Condominium Construction 29
Condominium Conversions 30
Residential Hotels 31
Affordable Housing 32
Standards and Definitions of Affordability 32
New Affordable Housing Construction 35
Inclusionary Housing 37
Affordability of Market Rate Housing 38
Affordable Housing Acquisition and Rehabilitation 39
Changes in Housing Stock by Planning District 40
Housing Stock by Planning District 42
Housing Construction in the Bay Area 45
Appendices 47
Appendix A: Project Lists 48
Appendix B: Community Plan Area Annual Monitoring 67
Appendix C: San Francisco Zoning Districts 72
Appendix D: In-Lieu Housing Fees Collected 74
Appendix E: Glossary 75
iTables
Table 1. San Francisco Housing Stock by Building Type, 2010-2019 17
Table 2. San Francisco Housing Trends, 2000-2019 19
Table 3. Projects and Units Filed at Planning Department for Review, 2015-2019 20
Table 4. Units and Projects Authorized for Construction by DBI by Building Type, 2015-2019 20
Table 5. Units Demolished by Building Type, 2015-2019 22
Table 6. Units Demolished by Zoning District, 2019 22
Table 7. Units Added or Lost Through Alteration Permits, 2015-2019 23
Table 8. Units Lost Through Alterations and Demolitions, 2015-2019 23
Table 9. Accessory Dwelling Units Added, 2019 24
Table 9A. Accessory Dwelling Units Legalized, 2019 24
Table 10. Accessory Dwelling Units Added and Legalized by Building Type, 2019 24
Table 11. Density Bonus Projects in the Pipeline by Total Units, 2019 26
Table 12. Density Bonus Projects in the Pipeline by Status of Application, 2019 26
Table 13. Housing Units Added by Building Type, 2015-2019 26
Table 14. Housing Units Added by Generalized Zoning, 2019 27
Table 15. Housing Units Added by Zoning District, 2019 28
Table 16. New Condominiums Recorded by DPW, 2010-2019 29
Table 17. New Condominiums Recorded by DPW by Building Type, 2015-2019 29
Table 18. Condominium Conversions Recorded by DPW, 2010-2019 30
Table 19. Condominium Conversions Recorded by DPW by Building Type, 2015-2019 30
Table 20. Changes in Residential Hotel Stock, 2015-2019 31
Table 21. 2019 Rental Affordable Housing Guidelines 33
Table 22. 2019 Homeownership Affordable Housing Guidelines 34
Table 23. New Affordable Housing Construction by Income Level, 2015-2019 36
Table 24. New Affordable Construction by Housing Type, 2015-2019 36
Table 25. New Affordable Housing Production by Source, 2015-2019 37
Table 26. Housing Price Trends, San Francisco Bay Area, 2015-2019 38
Table 27. Units Acquired or Rehabilitated, 2015-2019 39
Table 27A. Details of Units Acquired or Rehabilitated, 2019 39
Table 27B. Rental Assistance Demonstration Program, 2019 39
Table 28. Housing Units Completed and Demolished by Planning District, 2019 41
Table 29. San Francisco Housing Stock by Planning District, 2015-2019 43
Table 30. Units Authorized for Construction for San Francisco and the Bay Area Counties, 2019 46
Table A-1. Major Market Rate Housing Projects Completed, 2019 49
Table A-2. Major Affordable Housing Projects Completed, 2019 51
Table A-3. Major Housing Projects Reviewed and Entitled by Planning Department, 2019 52
Table A-4. Major Housing Projects Filed at Planning Department, 2019 54
Table A-5. Major Projects Authorized for Construction by DBI, 2019 57
Table A-6. Density Bonus Projects in the Pipeline by Program as of December 31, 2019 58
Table A-7. Major Affordable Projects in the Pipeline as of December 31, 2019 61
Table A-8. Housing Trends by Neighborhood, 2019 65
Table B-1. Housing Trends by Planning Area, 2019 67
Table B-2. Units Entitled by Planning Area, 2019 68
ii SAN FRANCI SCO PL AN N IN G DE PAR T M E N TTable B-3. Housing Units Added by Building Type and Planning Area, 2019 69
Table B-4. Units Demolished by Building Type and Planning Area, 2019 70
Table B-5. Units Lost Through Alterations and Demolitions by Planning Area, 2019 70
Table B-6. New Affordable Housing Constructed in Planning Areas, 2019 71
Table C. San Francisco Zoning Districts 72
Table D. In-Lieu Housing Fees Collected, Fiscal Years 2010-2019 74
Figures
Figure 1. Housing Production Process 2
Figure 2. San Francisco Housing Stock by Building Type, 2019 17
Figure 3. Units Completed & Demolished by Planning District, 2019 41
Figure 4. San Francisco Housing Stock by Planning District, 2019 42
Figure 5. Bay Area Housing Construction Trends, 2010-2019 46
Maps
Map 1. San Francisco Planning Districts 40
iiiINTRODUCTION:
ABOUT THE 2019
HOUSING INVENTORY
iv SAN FRANCI SCO PL AN N IN G DE PAR T M E N TS a n Fr a n ci s co H ou s i n g I n vento ry | 2019
The Housing Inventory is the Planning Depart- five-year monitoring reports that detail housing
ment’s annual survey of housing production trends production trends.
in San Francisco. The report details changes
in the City’s housing stock, including housing This report was prepared from information
construction, demolition, and alterations, and received from a number of different sources
has been published regularly since 1967. This including the Department of Building Inspection,
report is 50th in the series and presents housing the Department of Public Works, and Planning
production activity completed or authorized during Department records. The Mayor’s Office of Hous-
the year 2019. ing and the Office of Community Investment and
Infrastructure (Successor Agency to the San Fran-
By monitoring changes in San Francisco’s housing cisco Redevelopment Agency) provided informa-
stock, the Housing Inventory provides a basis for tion on affordable housing projects. The California
evaluating the housing production goals and poli- Homebuilding Foundation/Construction Industry
cies of the Housing Element of the San Francisco Research Board provided building permit data for
General Plan. Housing policy implications that the Bay Area region. The California Association of
may arise from data in this report, however, are Realtors provided housing rental and ownership
not discussed here. costs. Project sponsors also contributed data.
The Housing Inventory reports housing production, Copies of this report can be downloaded from
which begins when a building permit application the Publications & Reports link at the Planning
for a project is filed with the City. The application Department’s web site at http://www.sfplanning.
is first reviewed by the Planning Department for org.
compliance with the Planning Code, zoning, and
other applicable policies. If the Planning Depart- A limited number of copies are available for pur-
ment approves the project, the Department of chase from the Planning Department, 1650
Building Inspection (DBI) reviews the application Mission Street, Suite 400, San Francisco, CA
for compliance with the Building Code. If DBI 94103. Copies may also be reviewed at the
approves the application, it issues a permit autho- Government Information Center on the fifth floor
rizing construction. The next step is for the project of the San Francisco Main Library.
sponsor to begin construction on the project. Once
construction has been completed and passed all Department Staff Contact for this report is
required inspections, DBI issues a Certificate of Svetha Ambati, (415) 575-9183,
Final Completion (CFC) for the project. svetha.ambati@sfgov.org.
The Housing Inventory also reports the annual net
gain in housing units citywide by general Zoning
Districts and by Planning Districts. Net gain is
the number of newly constructed units with CFCs
issued, adjusted for alterations – which can add
or subtract units – and demolitions. Affordable
housing, condominiums, and changes in the
residential hotel stock are other areas of interest
covered by the Housing Inventory. In addition, the
report provides a regional perspective by examin-
ing housing construction activity and home prices
for the nine-county Bay Area region. Finally, major
projects completed, authorized, under review, or
in the pipeline are listed in Appendix A. The Hous-
ing Inventory also summarizes housing production
trends in the recently adopted planning areas
in Appendix B. These plan areas have separate
1Housing Production Process
The Housing Inventory describes net changes in days from the date the permit is issued. Start of
the housing stock and details units that have been construction, however, may be delayed for up to
certified complete, units that were authorized for a year. If the permit is not picked up or acted on
construction, and units that are under review by within 90 days, the permit expires. The number of
the Planning Department. units authorized for construction is a key indicator
of future housing construction.
The housing production process begins with a
project review by the Planning Department and Units Certified Complete
ends with the issuance of a Certificate of Final
Completion (CFC) by the Department of Building Projects are inspected by DBI at various stages
Inspection (DBI). Figure 1 outlines the main throughout the construction process. However,
stages of the housing production process. inspectors only issue Certificates of Final Comple-
tions (CFCs) for projects that are deemed 100%
Units Reviewed by Planning Department complete. Units certified complete are an indicator
and DBI of changes to the City’s housing supply and
include units gained or lost from new construction,
For most major projects, review by the Planning alterations, and demolitions.
Department is the first step in the process. Propos-
als are reviewed by the Planning Department for For the purposes of this report, however, units
compliance with the Planning Code, the General that have received Temporary Certificates of Occu-
Plan, environmental requirements, and other regu- pancy (TCOs) or “Final Inspection Approval” from
lations and policies. Generally, only major projects the Department of Building Inspection are also
require special Planning Department approvals, considered and counted as completed units.
such as a conditional use permit or variance. The
number and type of projects undergoing Planning Housing production is measured in terms of units
Department review are indicators of current build- rather than projects because the number of units
ing interest and production expectation within the in a project varies. Not all projects reviewed or
next two to five years. Following Planning Depart- approved are built. A project’s building permit
ment approval and entitlements, the Department application may be withdrawn, disapproved, or
of Building Inspection (DBI) reviews the project for revised; its permit may also expire if, for example,
compliance with the Building Code. a project is not financed. Housing production is
also affected by changes in market conditions and
Units Authorized for Construction the economy. However, once building construction
starts, a project is usually completed within one to
If DBI approves the project following its own two years, depending on the size of the project.
review, it issues building permits authorizing
construction. Projects with approved building
permits generally start construction within 90
FIGURE 1.
The Housing
Production Process Housing Units Housing Units Housing Units Housing Units
UNDER PLANNIng/
Under Planning/ Authorized for Under Certified
DBI REVIEW
Review Construction Construction Complete
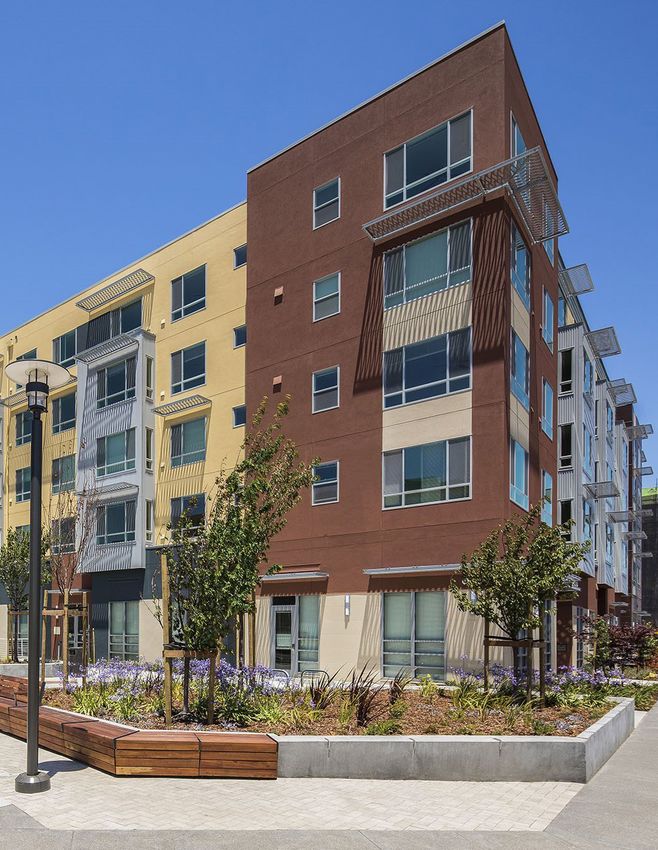
2 SAN FRANCI SCO PL AN N IN G DE PAR T M E N TAlice Griffith Phase III;
Photo Source: http://lowincomehousing.us
3HIGHLIGHTS:
2019 SNAPSHOT
4 SAN FRANCI SCO PL AN N IN G DE PAR T M E N TS a n Fr a n ci s co H ou s i n g I n vento ry | 2019
Summary of highlights
The construction of new housing in 2019 totaled In 2019, affordable housing production totaled
over 4,850 units, which represents a 81% 1,456 units, which is over twice the number of
increase from 2018. This past year’s production affordable housing units produced in 2018. This
represents the second-highest production total in is also almost 50% above the five-year average of
the past twenty years. This production includes 980 affordable units. These new affordable units
4,461 units in new construction and 397 new made up 30% of new units added to the City’s
units added through conversion of non-residential housing stock. This count includes approximately
uses or expansion of existing structures. One 405 inclusionary units and 177 accessory
hundred and sixty units were lost, including dwelling units. About 83% of the new affordable
demolitions (139), unit mergers (3), and removal units are affordable to very-low and low-income
of illegal units (18). The city experienced a 4% households.
increase in units added through alterations and
a 64% decrease in units lost through alterations In 2019, over 2,900 units were authorized for
since 2018. construction, representing a 52% decrease from
2018. New housing authorized for construction
There was a net addition of 4,698 units to the over the past five years continues to be over-
City’s housing stock in 2019, an 82% increase whelmingly (86%) for buildings with 20 or more
from 2018’s net addition. The net addition in units. The Planning Department approved and
2019 is also about 68% higher than the 10-year fully entitled 554 projects in 2019. These projects
average net addition of 2,801, and signifies a propose a total of 2,895 units.
higher year of production than seen in the recent
past. By the end of 2019, there were approxi-
mately 399,300 dwelling units in the city.
Housing stock
Housing Stock by Building Type
399,313 1.2%
2019 change from 2018
30%
31% 20+ Units
10 to 19 Units
5 to 9 Units
2 to 4 Units
Single Family
10%
20%
9%
5NEW CONSTRUCTION trends
20-Year
20-year newNew Constructiontrends,
construction Trends,2000–2019
1997‒2016
6,000
5,000
4,000
Number of Units
3,000
2,000
1,000
0
2000 2001 2002 2003 2004 2005 2006 2007 2008 2009 2010 2011 2012 2013 2014 2015 2016 2017 2018 2019
Units Completed from New Construction Net Change in Number of Units
4,461 93%
20-Year Unit Demolition Trends, 1997‒2016
69%
2019 change from 2018 ABOVE 10-year average
6,000
5,000
4,698 82% 68%
2019 change from 2018 ABOVE 10-year average
4,000
Number of Units
3,000
2,000
1,000
0
2000 2001 2002 2003 2004 2005 2006 2007 2008 2009 2010 2011 2012 2013 2014 2015 2016 2017 2018 2019
Units demolished Net Change in Number of Units
6 SAN FRANCI SCO PL AN N IN G DE PAR T M E N T2000 2001 2002 2003 2004 2005 2006 2007 2008 2009 2010 2011 2012 2013 2014 2015 2016 2017 2018 2019
Units Completed from New Construction Net Change in Number of Units S a n Fr a n ci s co H ou s i n g I n vento ry | 2019
UNIT DEMOLITION TRENDS
20-Year Unit Demolition Trends, 1997‒2016
20-year UNIT DEMOLITION trends, 2000–2019
6,000
5,000
4,000
Number of Units
3,000
2,000
1,000
0
2000 2001 2002 2003 2004 2005 2006 2007 2008 2009 2010 2011 2012 2013 2014 2015 2016 2017 2018 2019
Units demolished Net Change in Number of Units
139 162% 19%
20-Year Unit Authorization Trends, 2000‒2019
2019 change from 2018 ABOVE 10-year average
6,000
5,000
4,000
Number of Units
3,000
2,000
1,000
0
2000 2001 2002 2003 2004 2005 2006 2007 2008 2009 2010 2011 2012 2013 2014 2015 2016 2017 2018 2019
Units authorized for construction Net Change in Number of Units
72000 2001 2002 2003 2004 2005 2006 2007 2008 2009 2010 2011 2012 2013 2014 2015 2016 2017 2018 2019
Units demolished Net Change in Number of Units
UNIT AUTHORIZATION FOR CONSTRUCTION TRENDS
20-year UNITAuthorization
20-Year Unit AUTHORIZATION FOR CONSTRUCTION
Trends, 2000‒2019 trends, 2000–2019
6,000
5,000
4,000
Number of Units
3,000
2,000
1,000
0
2000 2001 2002 2003 2004 2005 2006 2007 2008 2009 2010 2011 2012 2013 2014 2015 2016 2017 2018 2019
Units authorized for construction Net Change in Number of Units
2,944 52% 20%
2019 change from 2018 BELOW 10-year average
8 SAN FRANCI SCO PL AN N IN G DE PAR T M E N T2000 2001 2002 2003 2004 2005 2006 2007 2008 2009 2010 2011 2012 2013 2014 2015 2016 2017 2018 2019
Units demolished Net Change in Number of Units S a n Fr a n ci s co H ou s i n g I n vento ry | 2019
UNIts filed and entitled TRENDS
10-year
10-Year UNIts
Units Filed
Filed andand Entitled,
Entitled 2010–2019
Trends, 2010‒2018
16,000 Units filed at the Planning Department is defined as the number of
units associated with applications that have been fully completed and
accepted for review.
13,000
10,000
Number of Units
7,000
4,000
2,000
0
2010 2011 2012 2013 2014 2015 2016 2017 2018 2019
Units ENTITLED by the planning department
Units FIled at the planning department
2,895 28% 50%
2019 change from 2018 BELOW 10-year average
3,924 28% -%
2019 change from 2018 SAME AS 10-year average
92019 Housing Unit Trends
UNITS ADDED BY BUILDING TYPE, 2019
1.6%
0.4%
5%
1%
20+ Unit BUILDINGS
10 to 19 Unit BUILDINGS
5 to 9 Unit BUILDINGS
2 to 4 Unit BUILDINGS
92% Single Family BUILDINGS
UNITS lost through alterations and demolitions by type of loss, 2019
13%
11%
2%
DEMOLITIONS
ALTERATIONS
ILLEGAL UNITS REMOVED
87% UNITS MERGED INTO LARGER UNITS
Correction TO OFFICIAL RECORDS
units converted
UNITS demolished by building type, 2019
6.5% 8.5%
5+ Unit BUILDINGS
3 to 4 Unit BUILDINGS (0%)
2 Unit BUILDINGS
Single Family BUILDINGS
85%
10 SAN FRANCI SCO PL AN N IN G DE PAR T M E N TS a n Fr a n ci s co H ou s i n g I n vento ry | 2019
CONDOMINIUMS in 2019
new condominiums recorded by building type, 2019
1% 1% 1%
4,327 39%
2019 change from 2018
1%
20+ Units
10 to 19 Units
5 to 9 Units
3 TO 4 Units
96% 2 Units
Condominium Conversions by Building Type, 2019
387 103%
10%
2019 change from 2018
10%
18%
61% 5 to 6 Units
4 Units
3 Units
2 units
11AFFORDABLE HOUSING IN 2019
AFFORDABLE HOUSING AND MARKET-RATE HOUSING, 2019
1,456 126%
30% 2019 change from 2018
MARKET RATE Units
AFFORDABLE Units
70%
Affordable units include 100% affordable units,
inclusionary units, and units built as accessory
dwelling units. For definitions, see page 32.
New Affordable Housing Construction by Income Level, 2019
17%
23%
Extremely Low (S a n Fr a n ci s co H ou s i n g I n vento ry | 2019
HOUSING TRENDS BY GEOGRAPHY
Units Authorized for Construction for San Francisco and the Bay Area Counties, 2019
County Single-Family Units Multi-Family Units Total Units Percent of Total
Alameda 1,871 4,145 6,016 27%
Contra Costa 1,572 1,229 2,801 12%
Marin 130 86 216 1%
Napa 204 17 221 1%
San Francisco 17 2,927 2,944 13%
San Mateo 489 1,061 1,550 7%
Santa Clara 1,804 3,216 5,020 22%
Solano 1,134 56 1,190 5%
Sonoma 1,722 1,056 2,778 12%
TOTAL 8,943 13,793 22,736
Source: California Homebuilding Foundation
North Bay
Sonoma Napa
1%
12% Solano
pacific ocean
1% 5%
Marin
12%
Contra Costa
SAN FRANCISCO East Bay
13% 27% Alameda
San Mateo
7%
22%
Santa Clara
Peninsula & South Bay
13HOUSING
20-YearTRENDS BY GEOGRAPHY
New Construction Trends, 1997‒2016
5-year units authorized in the bay area region, 2015–2019
30,000
25,000
20,000
Number of Units
15,000
10,000
5,000
0
2015 2016 2017 2018 2019
Units Authorized in San Francisco
Units Authorized in rest of bay area region
2,944 52% 36%
20-Year Unit Demolition Trends, 1997‒2016
2019 change from 2018 BELOW 10-year average
6,000
19,792 26% 6%
5,000
2019 change from 2018 below 10-year average
4,000
Number of Units
3,000
2,000
1,000
0
2000 2001 2002 2003 2004 2005 2006 2007 2008 2009 2010 2011 2012 2013 2014 2015 2016 2017 2018 2019
Units demolished Net Change in Number of Units
14 SAN FRANCI SCO PL AN N IN G DE PAR T M E N TS a n Fr a n ci s co H ou s i n g I n vento ry | 2019
Regional Housing Needs Allocation, Planning period 2015–2022
Housing Goals Actual Production % of Production Production Deficit
Household Affordability
2015–2022 as of 2019 Target Achieved as of 2019
Above Moderate
12,536 15,472 100%* -
(> 120% AMI)
Moderate Income
5,460 1,057 19% 4,403
(80–120% AMI)
Low Income
4,639 1,806 39% 2,833
(< 80% AMI)
Very Low Income
6,234 3,679 59% 2,555
(< 50% AMI)
TOTALS 28,869 22,014 66%* 6,855
Actual production totals are not submitted to the State Department of Housing and Community Development as
progress towards RHNA. Building permits authorized count as progress towards RHNA. For the purposes of this report
only, actual production is shown in comparison to RHNA goals.
*Although market rate housing production is above the RHNA goal for that income level, 100% is shown here to
indicate that the goal has been met. The total percentage of target achieved reflects that as well.
Actual Production, 2015-2022
17%
The State Department of Housing and Community Development, along
with the Association of Bay Area Governments set the regional housing
needs allocation or RHNA targets for housing production in every county
in the Bay Area. Sixty percent of RHNA targets are required to be afford-
8% able to households with varying incomes. Over 28,000 net new housing
units have been allocated to San Francisco for the years 2015-2022. The
number of units produced as of 2019 are shown in the pie chart.
5%
70% Very low income (120% AMI)
15FINDINGS:
HOUSING IN
SAN FRANCISCO
16 SAN FRANCI SCO PL AN N IN G DE PAR T M E N TS a n Fr a n ci s co H ou s i n g I n vento ry | 2019
Housing Stock
The number of units in San Francisco’s housing density buildings (two to nine units – 30%), and
stock is derived by taking the total units from the higher density structures (10 or more units –
decennial census count as baseline, then adding 39%). This distribution is similar over
net unit change each subsequent year until the the last nine years and will likely change in the
next census. Because the 2010 Census did not next few years as the trend has been moving
collect detailed housing characteristics, the 2015 towards increasingly larger buildings, as presented
Housing Inventory used data from the 2010 in Table 11.
Five Year American Community Survey (2010
ACS5), and the 2019 Housing Inventory uses this In 2019, there was a net gain of 4,698 units in
calculation as a baseline for consistency. Annual the City’s housing stock. As of December 2019,
net unit change – the sum of units completed from units in buildings with 20 or more units comprised
new construction and alterations minus units lost 30% of the City’s total housing. Of all units added
from demolition and alterations – are added to this since the 2010 ACS5, about 92% have been in
2010 ACS5 baseline count. buildings with 20 units or more.
According to the 2010 ACS5 and new production Table 1 provides a profile of San Francisco’s
over the last nine years, there are about 399,313 housing stock by building type from 2010 through
housing units in San Francisco, distributed 2019. Figure 2 illustrates San Francisco’s housing
between single family units (31%), moderate stock by building type for 2019.
TABLE 1.
San Francisco Housing Stock by Building Type, 2010–2019
Building Type Single Family 2 to 4 Units 5 to 9 Units 10 to 19 Units 20 + Units Total
2010 ACS5 123,951 79,774 37,088 37,656 93,496 372,535
Net Added
235 878 368 677 24620 26,778
2011–2019
TOTAL 124,186 80,652 37,456 38,333 118,116 399,313
Source: U.S. Census Bureau; Planning Department
* This total includes other “housing” types that the Census Bureau counts, such as mobile homes, RVs, vans, and houseboats.
FIGURE 2.
San Francisco 1.6%
Housing StockHousing Production Trends
New Housing Construction
» New construction unit totals for 2019 – 4,461 Three of the largest projects completed in 2019
– is a 93% increase from 2018. New construc- include: 245 1st Street (548 market-rate units
and 149 low-income affordable inclusionary
tion in 2019 is 69% above the 10-year aver-
units), 510 Folsom Street (545 market rate units
age of 2,642 new construction units.
and 109 low-income affordable inclusionary
units), and 600 Minnesota Street (318 student
» Alterations resulted in 397 units added through housing units).
conversion or expansion of existing structures,
and the addition or legalization of accessory The 2500 Arelious Walker Drive development
dwelling units. However, 21 units were lost (100% affordable, with 121 very low-income
due to removal of illegal units and mergers. units and one manager’s unit) and 1150 3rd
Street (100% affordable, with 118 low-income
This means a net total of 376 units were added units) are two major affordable housing projects
completed in 2019.
to the housing stock through “alterations”
of existing units or buildings. This is a 16%
increase from the 323 net units added A list of all market rate projects with ten units or
in 2018 as a result of alterations. more completed in 2019 is included in Appendix
A-1. Appendix A-2 includes all major affordable
» One hundred and thirty-nine units were demol- housing projects completed in 2019.
ished in 2019.
» In 2019, net addition to the City’s housing
stock increased by 82% from 2018. This
2019 net new unit count of 4,698 is also 68%
above the 10-year average of 2,801 net new
units.
» Affordable units made up 30% of new units
built in 2019. The number of affordable units
built in 2019 is more than twice the number of
affordable units built in 2018.
» In 2019, the Department of Building Inspec-
tion (DBI) authorized 2,944 units for construc-
tion. This represents a 52% decrease from the
number of units authorized in 2018 (6,097).
Table 2 and the figure on page six show housing
production trends over the past 20 years. The
table and figure account for net new units gained
– which is the number of units newly constructed
and adjusted for alterations, which can add or
subtract units, and demolitions.
18 SAN FRANCI SCO PL AN N IN G DE PAR T M E N TS a n Fr a n ci s co H ou s i n g I n vento ry | 2019
TABLE 2.
San Francisco Housing Trends, 2000–2019
Units Completed Units Gained Net Change
Units Authorized Units
Year from New or Lost from In Number
for Construction Demolished
Construction Alterations of Units
2000 2,897 1,859 61 (1) 1,797
2001 2,380 1,619 99 259 1,779
2002 1,478 2,260 73 221 2,408
2003 1,845 2,730 286 52 2,496
2004 2,318 1,780 355 62 1,487
2005 5,571 1,872 174 157 1,855
2006 2,332 1,675 41 280 1,914
2007 3,281 2,197 81 451 2,567
2008 2,346 3,019 29 273 3,263
2009 752 3,366 29 117 3,454
2010 1,209 1,082 170 318 1,230
2011 2,033 348 84 5 269
2012 3,888 794 127 650 1,317
2013 3,168 2,330 429 59 1,960
2014 3,834 3,454 95 155 3,514
2015 2,982 2,472 25 507 2,954
2016 4,059 4,895 30 181 5,046
2017 6,731 4,270 18 189 4,441
2018 6,097 2,309 53 323 2,579
2019 2,944 4,461 139 376 4,698
TOTAL 62,145 48,792 2,398 4,634 51,028
Source: Planning Department
Note: Net Change equals Units Completed less Units Demolished plus Units Gained or (Lost) from Alterations.
19Projects Approved and Under Review » The Planning Department approved and fully
by Planning entitled 521 projects in 2019. These projects
propose a total of 2,799 units. Two of the
Depending on the type of project, there are vari- larger projects filed in 2019 include: 655 4th
ous approvals by the Planning Department that a Street (957 total units) and 1064 Mission
project needs to be fully entitled. Full entitlement Street (254 total units).
of a project means that the project sponsor can
proceed with the next step in the development Table 3 shows the number of housing projects
process: securing approval and issuance of a filed with the Planning Department over the last
building permit. five years. Units filed at the Planning Department
is defined as the number of units associated with
» In 2019, 535 projects with 3,924 total units applications that have been fully completed and
were filed with the Planning Department. This accepted for review. It is important to note that
is a 24% decrease from the number of projects Planning may not approve all projects under
filed in 2018 and is about 25% below the review or may not approve projects at the unit lev-
five-year average of 5,274 units. els requested. Project sponsors may also change
or withdraw the project proposals. Some projects
TABLE 3. listed in Table 3 as undergoing Planning Depart-
Projects and Units Filed at Planning Department for ment review may have reached their approval
Review, 2015–2019 stage, been authorized for construction, or may
have been completed. Lastly, many of the housing
Year Projects Filed Units Filed projects under development by the Office of Com-
2015 409 5,099
munity Investment and Infrastructure (OCII) or
other agencies with their own entitlement process
2016 562 6,783 do not show up in Table 3 because those agencies
2017 591 5,149
are responsible for the review of those projects.
2018 708 5,416 Appendix A-3 records major projects (10 units
or more) that received Planning entitlements in
2019 535 3,924
2019. Appendix A-4 contains a list of the major
TOTAL 2,805 26,371 projects filed at the Planning Department for
review during 2019.
Source: Planning Department
TABLE 4.
Units and Projects Authorized for Construction by DBI by Building Type, 2015–2019
Units by Building Type
Year Total Projects
Single Family 2 Units 3 to 4 Units 5 to 19 Units 20+ Units
2015 39 142 68 127 2,606 2,982 276
2016 52 151 105 192 3,559 4,059 386
2017 45 82 100 256 6,248 6,731 331
2018 31 219 93 393 5,361 6,097 504
2019 17 183 137 72 2,535 2,944 556
TOTAL 216 738 436 1,043 21,270 23,703 1,737
Source: Planning Department
20 SAN FRANCI SCO PL AN N IN G DE PAR T M E N TS a n Fr a n ci s co H ou s i n g I n vento ry | 2019
Units Authorized for Construction Alterations and Conversions
» In 2019, DBI authorized 2,944 units for con- The majority of building permits issued by DBI are
struction, 52% less than in 2018. This number for residential alterations. These alteration permits
is also about 35% below the five-year average are for improvements within existing buildings
(4,563). or dwelling units. Some alterations expand the
building envelope without increasing the number
» There were more projects authorized in 2019: of units in the building. The Housing Inventory is
556 compared to 504 projects in 2018. In primarily concerned with alterations which result
2019, the average project size was 5 units, in a net loss or gain in the total number of units in
which below the the average project size for the the housing stock.
five years between 2015 and 2019 (11).
Dwelling units are gained by additions to existing
Table 4 summarizes the number of projects and housing structures, conversions to residential use,
units by building type authorized for construction and legalization of illegal units. Dwelling units are
by the Department of Building Inspection (DBI). lost by merging separate units into larger units, by
conversion to commercial use, or by the removal
» Majority of the units authorized for construction of illegal units.
in 2019 (86%) are in projects with 20 units
or more. The net gain of 376 units from alterations in 2019
is comprised of 397 units added and 21 units
» Major projects authorized for construction eliminated.
during the reporting year include: 434 Minna
Street (302 units); 1270 Mission Street (299 » Units gained through alterations increased 4%
units); and 1068 Mission Street (254 units). from the previous year – 397 units in 2019
compared to 381 units in 2018.
Appendix A-5 lists all projects with ten or more
units authorized for construction in 2019. » 284 units of alterations in 2019 are new
accessory dwelling units or legalized secondary
units.
Demolitions
» Of the 21 units lost through alteration in 2019,
» A total of 139 units were demolished in 2019. 18 were illegal units removed and three units
were lost due to mergers. This represents a
» The demolition of the 139 units in 2019 is 64% decrease in units lost through alterations
162% above the five-year demolition average from 2018 (58).
of 53 units. This increase is the result of
demolition permits pulled for rehabilitation of Table 7 shows the number of units added or
public housing. eliminated through alteration permits from 2015
to 2019. Table 8 profiles the type of alterations
Table 5 shows the units demolished between and demolitions that caused the loss of units dur-
2015 and 2019 by building type and Table 6 ing the same period.
shows the demolitions in 2019 by Zoning District.
» The net total of 160 units lost in 2019 due to
It should be noted that city policies require a demolition or alteration is 44% more than the
minimum of one to one replacement of demol- net total lost in 2018.
ished housing.
21TABLE 5.
Units Demolished by Building Type, 2015–2019
Units by Building Type
Year Buildings Total
Single 2 Units 3 to 4 Units 5+ Units
2015 17 15 2 - 8 25
2016 17 14 - 8 8 30
2017 14 11 4 3 - 18
2018 25 22 4 - 27 53
2019 27 9 - 12 118 139
TOTAL 100 71 10 23 161 265
Source: Planning Department
TABLE 6.
Units Demolished by Zoning District, 2019
Units
Zoning District Buildings Total Percent of Total
Single Family Multi-Family
RH-1 3 3 - 3 2%
RH-1(D) 1 1 - 1 1%
RH-2 3 3 - 3 2%
RM-1 17 - 130 130 94%
RTO-M 1 1 - 1 1%
UMU 1 1 - 1 1%
TOTAL 26 9 130 139
Source: Planning Department
22 SAN FRANCI SCO PL AN N IN G DE PAR T M E N TS a n Fr a n ci s co H ou s i n g I n vento ry | 2019
TABLE 7.
Units Added or Lost Through Alteration Permits, 2015–2019
Year Units Added Units Eliminated Net Change
2015 623 116 507
2016 359 178 181
2017 241 52 189
2018 381 58 323
2019 397 21 376
TOTAL 2,001 425 1,576
Source: Planning Department
TABLE 8.
Units Lost Through Alterations and Demolitions, 2015–2019
Alterations
Units Total Units
Year
Illegal Units Units Merged Correction to Units Total Demolished Lost
Removed into Larger Units Official Records Converted Alterations
2015 100 12 1 3 116 25 141
2016 72 16 12 78 178 30 208
2017 44 4 2 2 52 18 70
2018 31 5 21 1 58 53 111
2019 18 3 - - 21 139 160
TOTAL 265 40 36 84 425 265 690
Source: Planning Department
23Accessory Dwelling Units
Accessory Dwelling Units (ADUs), also known » In 2019, 177 ADUs were completed. One
as secondary units, in-law units, or cottages, hundred and twenty-one ADUs were added in
are independent dwelling units added to existing buildings with two to four units, and 149 ADUs
residential buildings. ADUs are subordinate to the were added in building with five or more units.
primary residential unit(s), generally due to the
location or size of the ADU. These units can either The legalization program also allows legalizations
be developed within the existing building, as an of existing ADUs without any prior evidence. This
extension to the existing building, or as an entirely voluntary program allows property owners to for-
separate structure. mally register and rent their unwarranted units in
San Francisco, and to ensure that each unit meets
As part of an effort to address growing housing
safety conditions.
demands, the ADU program offers homeowners
and contractors a way to add a unit to an exist- » In 2019, 93 illegal secondary units were
ing residential building. By legally adding a unit, a legalized through the legalization program.
homeowner potentially subsidizes their mortgage Approximately 83% of these legalized units
by creating a rental apartment, or enables the were in buildings with two to four units.
creation of a multi-generational household.
Table 9 shows the number of ADUs added and
A property owner or landlord can also turn under- Table 9A shows the number of ADUs legalized
utilized spaces within an existing apartment in 2019. Table 10 shows the number of ADUs
building into additional dwelling units, and as a added and legalized by building type in 2019.
result, increase housing options for residents.
TABLE 9. Table 9A.
Accessory Dwelling Units Added, 2019 Accessory Dwelling Units Legalized, 2019
ADUs Legalizations through
Year Year Legalizations
Completed Ordinance 43-14
2017 23 2017 11 76
2018 79 2018 22 62
2019 177 2019 14 93
TOTAL 279 TOTAL 47 231
TABLE 10.
Accessory Dwelling Units Added and Legalized through Ordinance by Building Type, 2019
Units by Building Type
Year Buildings Total
Detached Unit 2 to 4 Units 5 to 9 Units 10+ Units
2017 91 - 64 20 15 99
2018 110 5 61 24 51 141
2019 199 - 121 59 90 270
TOTAL 400 5 246 103 156 510
Source: Planning Department, Department of Building Inspection
Note: The building type is defined by the total number of units in the structure after net new units have been added.
24 SAN FRANCI SCO PL AN N IN G DE PAR T M E N TS a n Fr a n ci s co H ou s i n g I n vento ry | 2019
Additional Units Proposed Through Density
Bonus Programs
The California State Density Bonus Law offers » As of December 2019, 55 projects were in the
development incentives to projects that provide pipeline for the State Density Bonus Program.
on-site affordable housing. In 2017, the City These projects propose adding 6,113 units to
established the Individually Requested State the housing stock.
Density Bonus Program, which incorporates
additional requirements and standards for local » As of December 2019, 15 projects were in
implementation of the State Program. The housing the pipeline for the HOME-SF Density Bonus
project utilizing this program must comply with Program. These projects propose adding 686
the Inclusionary Affordable Housing Requirement, units to the housing stock.
but the project may only seek a bonus at a single
income level. The State Program offers projects Table 11 on the following page shows the number
the right to receive up to three incentives or of units associated with density bonus projects
concessions that are required to provide for afford- in the pipeline. Table 12 on the following page
able housing costs. A concession or incentive can shows the number of projects in different stages of
be a reduction in site development standards, application as of late 2019. Table A-6 in Appendix
or a modification of zoning code requirements, A lists the density bonus projects in the pipeline
approval of mixed-use zoning, or other regulatory and any associated waivers or incentives and
conessions or incentivies. concessions.
HOME-SF is an optional local density bonus
program that may be used by applicants in lieu
of the State Program to construct mixed-income
projects with a higher percentage of inclusionary
units in certain areas of San Francisco. Under
this program, 20 to 30 percent of the units in a
new housing project must be affordable to low,
middle, and moderate-income families. To provide
more family friendly housing, 40 percent of the
total units in the building must be two bedrooms
or larger. In return, density bonuses and zoning
modifications are provided, thus allowing project
sponsors to accommodate additional affordable
units.
As of December 2019, all density bonus projects
filed with the Planning Department are in stages
of Planning review or have had a building permit
issued. None of the projects have been completed
and do not count towards units added to the hous-
ing production in year 2019.
25TABLE 11.
Density Bonus Projects in the Pipeline by Total Units as of December 2019
Units
Percent of Total
Program Projects
Total Units Before Total Units With Units With Bonus
Affordable Units
Bonus Bonus
State Density Bonus 55 5.090 6,113 1,851 90%
HOME-SF Density Bonus 15 460 686 177 10%
TOTAL 70 5,550 6,799 2,028
Source: Planning Department, Department of Building Inspection
Note: Unit counts may change as the application moves through different stages in the process of entitlement. In addition, because some of these applications are in very early stages,
information such as affordable housing units or total number of units before or after bonus is not available.
TABLE 12.
Density Bonus Projects in the Pipeline by Status of Application as of December 2019
Status of Application
Program Projects
PPA Filed Under Review Entitled Building Permit Issued
State Density Bonus 55 8 37 - 10
HOME-SF Density Bonus 15 6 9 - -
TOTAL 70 14 46 - 10
Source: Planning Department, Department of Building Inspection
TABLE 13.
Housing Units Built by Building Type, 2015–2019
Year Single Family 2 Units 3 to 9 Units 10 to 19 Units 20+ Units Total
2015 48 149 90 45 2,763 3,095
2016 66 68 106 76 4,579 4,895
2017 48 138 214 68 4,043 4,511
2018 37 108 95 110 2,340 2,690
2019 93 171 196 87 4,311 4,585
TOTAL 292 634 701 386 18,036 20,049
Share of Total
Units Added, 1.5% 3.1% 3.5% 1.9% 90%
2015-2019
Source: Planning Department
26 SAN FRANCI SCO PL AN N IN G DE PAR T M E N TS a n Fr a n ci s co H ou s i n g I n vento ry | 2019
New Housing Unit Trends
New construction and residential conversions are New Housing Units Added by
the primary engine behind changes to the housing Zoning District
stock. This section examines units added to the
housing stock over the past five years by looking Approximately 56% of units added in 2019 were
at the types of buildings and the Zoning Districts in Mixed Use zoning districts. Residential, House
where they occurred. For 2019, this section and Mixed zoning districts contributed 40%, and
examines all units added to the housing stock Public zoning districts followed with 3% of total
including ADUs, not just those added through new units added.
construction.
Table 14 summarizes new units added in 2019
Types of Buildings by generalized Zoning Districts. Table 15 lists the
number of units constructed in various Zoning Dis-
» New housing units added over the past five tricts in the City. A complete list of San Francisco’s
years continues to be overwhelmingly (90%) Zoning Districts is included in Appendix C.
in buildings with 20 or more units.
» Ninety-three single-family units were added in
2019, 150% more than the previous year’s
addition. Single-family building construction
made up a very small proportion of new con-
struction in the past five years (1.5%).
» More units were added in the “Single Family”
and “2 Units” categories than in the previous
four years (93 and 171 units added respec-
tively in 2019).
» The share of units added in high-density build-
ings (20 or more units) —89%— is just below
than the five-year average of 90%.
Table 13 on the opposite page shows new
construction from 2015 through 2019 by building
type.
TABLE 14. General Zoning Districts Units Percent of Total Rank
New Housing Units
Added by Commercial (RC, C-3-G, C-3-O(SD)) 57 1% 4
Generalized
Zoning, 2019 Mixed Use (CMUO, CRNC, NC, NCT, RC, Etc.) 2,707 56% 1
Public 132 3% 3
Residential, House and Mixed (RED, RH, RM, RTO) 1,962 40% 2
TOTAL 4,858 100%
Source: Planning Department
27TABLE 15.
New Housing Units Added by Zoning District, 2019
Zoning Districts Units Percent of Total Rank
C-2 20 < 1% 22
C-3-G 35 1% 18
C-3-O(SD) 2 < 1% 29
CMUO 106 2% 12
CRNC 38 1% 17
HP-RA 382 8% 4
MB-RA 1 < 1% 32
MUG 2 < 1% 30
MUR 139 3% 8
NC-1 15 < 1% 23
NC-2 1 < 1% 33
NC-3 167 3% 6
NCD 161 3% 7
NCT 123 3% 10
NCT-3 10 < 1% 25
RC-3 467 10% 3
RC-4 5 < 1% 28
RED 55 1% 16
RED-MX 85 2% 15
RH-1 21 < 1% 21
RH-1(D) 2 < 1% 31
RH-2 125 3% 9
RH-3 90 2% 13
RM-1 111 2% 11
RM-2 89 2% 14
RM-3 9 < 1% 26
RM-4 33 1% 19
RTO 269 6% 5
RTO-M 30 1% 20
TB DTR 1,093 22% 2
TI-OS 9 < 1% 27
UMU 1,148 24% 1
WMUG 15 < 1% 24
TOTAL 4,858 100%
Source: Planning Department
28 SAN FRANCI SCO PL AN N IN G DE PAR T M E N TS a n Fr a n ci s co H ou s i n g I n vento ry | 2019
Condominiums
All condominium developments, whether new TABLE 16.
construction or conversions, are recorded with the New Condominiums Recorded by DPW, 2010–2019
Department of Public Works’s (DPW) Bureau of
Street-Use and Mapping (BSM). Annual condo- % Change from
Year Units
Previous Year
minium totals recorded by DPW do not directly
correlate with annual units completed and counted 2010 734 -12%
as part of the Housing Inventory because DPW’s 2011 1,625 121%
records may be for projects not yet completed or
2012 976 -40%
from projects completed in a previous year. Large
multi-unit developments also file for condominium 2013 2,586 165%
subdivision when they are first built even though 2014 1,977 -24%
the units may initially be offered for rent. Condo-
minium construction, like all real estate, is subject 2015 2,099 6%
to market forces and varies from year to year. 2016 2,019 -4%
2017 3,216 59%
New Condominiums Recorded
2018 3,123 -3%
» New condominiums recorded in 2019 2019 4,327 39%
increased to 4,327 units from 3,123 units in
2018 (an increase of 39%). TOTAL 22,682
» Approximately 96% of the condominiums Source: Department of Public Works, Bureau of Street-Use and Mapping
recorded were in buildings with 20 or more
units (4,139 units which represented a 39%
increase from 2018).
Table 16 shows construction of new condomini-
ums recorded by DPW over the past ten years and
Table 17 shows new condominium construction
by building type over the past five years.
TABLE 17.
New Condominiums Recorded by the DPW by Building Type, 2015–2019
Year 2 Units 3 to 4 Units 5 to 9 Units 10 to 19 Units 20+ Units Total
2015 18 16 40 16 2,009 2,099
2016 18 29 - 77 1,895 2,019
2017 22 12 38 28 3,116 3,216
2018 20 42 25 56 2,980 3,123
2019 40 47 53 48 4,139 4,327
TOTAL 118 146 156 225 14,139 14,784
Source: Department of Public Works, Bureau of Street-Use and Mapping
29Condominium Conversions
The San Francisco Subdivision Code regulates TABLE 18.
condominium conversions. Since 1983, conver- Condominium Conversions Recorded by DPW, 2010–2019
sions of units from rental to condominium have
been limited to 200 units per year and to build- Year Units
% Change from
Previous Year
ings with six or fewer units. More than 200 units
may be recorded in a given year because units 2010 537 -33%
approved in a previous year may be recorded in 2011 472 -12%
a subsequent year. The 200-unit cap on conver-
sions can also be bypassed for two-unit buildings 2012 488 3%
with owners occupying both units. 2013 369 -24%
2014 730 98%
» Condominium conversions increased by 103%
in 2019 (387 from 191 conversions in 2018). 2015 661 -9%
This number is 15% lower than the 10-year 2016 417 -37%
average of 455 units.
2017 296 -29%
» About 61% of units converted in 2019 2018 191 -35%
occurred in two-unit buildings, followed by
2019 387 103%
18% occurring in three-unit buildings.
TOTAL 4,548
» Eighty percent of the condominium conversions
in 2019 (307) were in buildings with two Source: Department of Public Works, Bureau of Street-Use and Mapping
or three units, a trend repeated from 2014
through 2018.
Table 18 shows the number of conversions
recorded by DPW from 2010-2019. Table 19
shows condominium conversions by building type
over the past five years.
TABLE 19.
Condominium Conversions Recorded by DPW by Building Type, 2015–2019
Year 2 Units 3 Units 4 Units 5 to 6 Units Total
2015 154 267 200 40 661
2016 118 120 80 99 417
2017 118 72 48 58 296
2018 86 48 12 45 191
2019 238 69 40 40 387
TOTAL 714 576 380 282 1,952
Source: Department of Public Works, Bureau of Street-Use and Mapping
30 SAN FRANCI SCO PL AN N IN G DE PAR T M E N TS a n Fr a n ci s co H ou s i n g I n vento ry | 2019
Residential Hotels
Residential hotels in San Francisco are regulated » As of 2019, 19,199 residential hotel rooms
by Administrative Code Chapter 41 – the Residen- are registered in San Francisco; 65% are resi-
tial Hotel Conversion and Demolition Ordinance dential rooms in for-profit residential hotels and
(HCO), enacted in 1981. The Department of 35% are residential in non-profit hotels.
Building Inspection (DBI) Housing Inspection
Services Division administers the HCO. This
ordinance preserves the stock of residential hotels
and regulates the conversion and demolition of
residential hotel units.
Table 20 reports the number of residential hotel
buildings and units for both for-profit and nonprofit
residential hotels from 2015 through 2019.
TABLE 20.
Changes in Residential Hotel Stock, 2015–2019
For Profit Residential Hotels Non-Profit Residential Hotels Total
Year
Buildings Resid. Rooms Tourist Rooms Buildings Resid. Rooms Buildings Resid. Rooms
2015 412 13,742 2,922 90 5,424 502 19,166
2016 403 13,247 2,732 95 5,781 498 19,028
2017 392 12,498 2,526 109 6,541 501 19,039
2018 397 12,710 2,674 106 6,489 503 19,199
2019 394 12,490 2,555 110 6,709 504 19,199
Source: Department of Building Inspection
31Affordable Housing
Standards and Definitions of Affordability
Affordable housing by definition is housing that Affordable ownership unit: A unit for which the
is either rented or owned at prices affordable to mortgage payments, PMI (principal mortgage
households with low to moderate incomes. The insurance), property taxes, homeowners dues,
United States Department of Housing and Urban and insurance equal 33% of the gross monthly
Development (HUD) determines the thresholds income of a household earning between 80% and
by household size for these incomes for the San 120% of the San Francisco HFMA median income
Francisco HUD Metro Fair Market Rent Area (assuming a 10% down payment and a 30-year
(HMFA). The HMFA includes San Francisco, 8% fixed rate loan).
Marin, and San Mateo counties. The standard
definitions for housing affordability by income level Inclusionary Affordable Housing Program —
are as follows: Ownership Units: These are units for which the
mortgage payments, PITI (principal, interest, taxes
Extremely low income: Units affordable to house- and insurance), and homeowners association
holds with incomes at or below 30% of the HUD dues equal less than 38% of the gross monthly
median income for the San Francisco HFMA; income of a household earning between 80% and
120% of the San Francisco HFMA median income
Very low income: Units affordable to households (assuming a 5% down payment and a 30-year
with incomes at or below 50% of the HUD fixed mortgage at the current market interest rate).
median income for the San Francisco HFMA;
Inclusionary Affordable Housing Program —
Lower income: Units affordable to households Rental Units: These units are rental units for
with incomes at or below 60% of the HUD households earning between 28% and 60% of
median income for the San Francisco HFMA; Area Median Income.
Low income: Units affordable to households with
incomes at or below 80% of the HUD median Tables 21 and 22 show the incomes and prices
income for the San Francisco HFMA, for affordable rental and ownership units based on
2019 HUD income limits.
Moderate income: Units affordable to households
with incomes at or below 120% of the HUD
median income for the San Francisco HFMA; and
Market rate: Units at prevailing prices without
any affordability requirements. Market rate units
generally exceed rental or ownership affordability
levels, although some small market rate units may
be priced at levels that are affordable to moderate
income households.
Housing affordability for units is calculated as
follows:
Affordable rental unit: A unit for which rent
equals 30% of the income of a household with
an income at or below 80% of the HUD median
income for the San Francisco HFMA, utilities
included.
32 SAN FRANCI SCO PL AN N IN G DE PAR T M E N TS a n Fr a n ci s co H ou s i n g I n vento ry | 2019
TABLE 21.
2019 Rental Affordable Housing Guidelines
Maximum
Income Levels Household Size Average Unit Size Monthly Rent
Annual Income
Extremely Low Income 1 Studio $25,850 $594
(30% of HUD Median Income) 2 1 Bedroom $29,550 $677
3 2 Bedroom $33,250 $747
4 3 Bedroom $36,950 $815
5 4 Bedroom $39,900 $864
6 5 Bedroom $42,850 $913
Very Low Income 1 Studio $43,100 $1,026
(50% of HUD Median Income) 2 1 Bedroom $49,250 $1,169
3 2 Bedroom $55,450 $1,302
4 3 Bedroom $61,600 $1,431
5 4 Bedroom $66,500 $1,529
6 5 Bedroom $71,450 $1,628
Lower Income 1 Studio $51,700 $1,241
(60% of HUD Median Income) 2 1 Bedroom $59,100 $1,416
3 2 Bedroom $66,500 $1,579
4 3 Bedroom $73,900 $1,739
5 4 Bedroom $79,800 $1,861
6 5 Bedroom $85,700 $1,985
Low Income 1 Studio $68,950 $1,672
(80% of HUD Median Income) 2 1 Bedroom $78,800 $1,908
3 2 Bedroom $88,700 $2,134
4 3 Bedroom $98,500 $2,354
5 4 Bedroom $106,400 $2,526
6 5 Bedroom $114,300 $2,700
Source: U.S. Department of Housing and Urban Development (HUD)
Note: Incomes are based on the 2019 Area Median Income (AMI) limits for the San Francisco HUD Metro FMR Area (HMFA). Rents are calculated based on 30% of gross monthly income.
(FMR = Fair Market Rents)
33TABLE 22.
2019 Homeownership Affordable Housing Guidelines
Household Average Maximum Monthly Maximum
Income Levels
Size Unit Size Annual Income Housing Expense Purchase Price
Low Income 1 Studio $60,350 $1,660 $200,525
(70% of HUD Median Income) 2 1 Bedroom $68,950 $1,896 $231,494
3 2 Bedroom $77,600 $2,134 $262,907
4 3 Bedroom $86,200 $2,371 $288,449
5 4 Bedroom $93,100 $2,560 $304,869
Median Income 1 Studio $77,600 $2,134 $289,291
(90% of HUD Median Income) 2 1 Bedroom $88,650 $2,438 $332,867
3 2 Bedroom $99,750 $2,743 $376,888
4 3 Bedroom $110,850 $3,048 $415,295
5 4 Bedroom $119,700 $3,292 $441,749
Moderate Income 1 Studio $94,800 $2,607 $377,800
(110% of HUD Median Income) 2 1 Bedroom $108,350 $2,980 $434,241
3 2 Bedroom $121,950 $3,354 $491,126
4 3 Bedroom $135,450 $3,725 $541,883
5 4 Bedroom $146,300 $4,023 $578,629
Source: U.S. Department of Housing and Urban Development (HUD)
Note: Incomes are based on the 2019 Area Median Income (AMI) limits for the San Francisco HUD Metro FMR Area (HMFA). Monthly housing expenses are calculated based on 33% of
gross monthly income. (FMR = Fair Market Rents). Maximum purchase price is the affordable price from San Francisco’s Inclusionary Housing Program and incorporates monthly fees
and taxes into sales price.
34 SAN FRANCI SCO PL AN N IN G DE PAR T M E N TS a n Fr a n ci s co H ou s i n g I n vento ry | 2019
New Affordable Housing Construction
» About 1,456 affordable units were completed Major affordable housing projects completed
in 2019, representing 30% of the new housing in 2019 include: 2500 Arelious Walker Drive
units added in 2019. Of these, 405 are new development (121 very low-income units and one
inclusionary units, and 177 are new accessory manager’s unit) and 1150 3rd Street (118 low-
dwelling units (ADUs). income units and one manager’s unit), 210 Taylor
Street (112 low-income units and one manager’s
» The number of affordable units built in 2019 unit), and 455 Fell Street (107 low-income units
(1,456) is 49% higher than the five year aver- and one manager’s unit).
age of affordable units built (980 units).
All major (10 or more units) new affordable
» Very low-income units represented 60% of the housing projects completed in 2019 are detailed
new affordable units that were constructed in in Appendix A-2. On-site affordable inclusionary
2019; low-income units made up 23%, and units are listed under major market rate projects in
moderate income units made up about 17%. Appendix A-1. Affordable housing projects under
construction, or in pre-construction or preliminary
Table 23 shows the production of affordable hous- planning with either the Mayor’s Office of Housing
ing by levels of affordability and Table 24 shows or the Office of Community Investment and Infra-
new affordable housing by type. These numbers structure are presented in Appendix A-7.
do not include affordable units that result from
acquiring and rehabilitating residential buildings
by nonprofit housing organizations. Those units
are covered later in the report.
» The number of new affordable units (1,456)
produced in 2019 was 125% higher than in
2018 (645).
» A total of 177 Accessory Dwelling Units
(ADUs) were added to existing residential build-
ings. Typically, these are smaller units and are
sometimes referred to as secondary or “granny”
units. These are also usually affordable to
households with moderate incomes, however,
these units are not income-restricted.
35TABLE 23.
New Affordable Housing Construction by Income Level, 2015–2019
Total
Extremely Low Very Low Low Moderate Total All % of All New
Year Affordable
(30% AMI) (50% AMI) (80% AMI) (120% AMI) New Units Units
Units
2015 - 213 66 250 529 3,095 17%
2016 120 128 364 190 802 4,895 16%
2017 - 686 558 222 1,466 4,511 32%
2018 - 40 401 204 645 2,690 24%
2019 - 880 335 241 1,456 4,858 30%
TOTAL 120 1,947 1,724 1,107 4,898 23,703 21%
Source: Planning Department, Mayor’s Office of Housing
*From 2015, 53 of these units, from 2016, 65 of these units, from 2017, 99 of these units, and from 2018, 141 of these units, and from 2019, 177 of these units are considered
“secondary units” or ADUs and are not income-restricted
TABLE 24.
New Affordable Housing Construction by Housing Type, 2015–2019
Year Family Senior Individual/SRO Homeowner Other Total
2015 282 - - 194 53 529
2016 452 147 20 118 65 802
2017 1,116 39 55 157 99 1,466
2018 434 - 19 51 141 645
2019 1,122 93 - 64 177 1,456
2019 Percent of
77% 6.4% - 4.4% 12.2%
Total
Source: Planning Department, Mayor’s Office of Housing
Note: Family units include projects with a majority of two or more bedroom units. Individual / SRO includes projects with a majority of or one bedroom, residential care facilities, shelters, and
transitional housing.
The category “Other” signifies the units that are considered “secondary units” or ADUs and are not income-restricted.
36 SAN FRANCI SCO PL AN N IN G DE PAR T M E N TYou can also read