SA PGM operations - Investor day (session 3) - 23 September 2021 - The Vault

Page created by Sergio Contreras
 
CONTINUE READING
SA PGM operations - Investor day (session 3) - 23 September 2021 - The Vault
SA PGM operations – Investor day (session 3)
23 September 2021
SA PGM operations - Investor day (session 3) - 23 September 2021 - The Vault
SA PGM
operations
Investor day
(session 3)
Long life, high
value assets
23 September 2021
SA PGM operations - Investor day (session 3) - 23 September 2021 - The Vault
Disclaimer
The information in this announcement may contain forward-looking statements within the meaning of the “safe harbour” provisions of the United States Private Securities Litigation
Reform Act of 1995. These forward-looking statements, including, among others, those relating to Sibanye Stillwater Limited’s (“Sibanye-Stillwater” or the “Group”) financial
positions, business strategies, plans and objectives of management for future operations, are necessarily estimates reflecting the best judgment of the senior management and
directors of Sibanye-Stillwater.
All statements other than statements of historical facts included in this announcement may be forward-looking statements. Forward-looking statements also often use words such
as “will”, “forecast”, “potential”, “estimate”, “expect” and words of similar meaning. By their nature, forward-looking statements involve risk and uncertainty because they relate to
future events and circumstances and should be considered in light of various important factors, including those set forth in this disclaimer. Readers are cautioned not to place
undue reliance on such statements.
The important factors that could cause Sibanye-Stillwater’s actual results, performance or achievements to differ materially from those in the forward-looking statements include,
among others, our future business prospects; financial positions; debt position and our ability to reduce debt leverage; business, political and social conditions in the United States,
South Africa, Zimbabwe and elsewhere; plans and objectives of management for future operations; our ability to obtain the benefits of any streaming arrangements or pipeline
financing; our ability to service our bond instruments; changes in assumptions underlying Sibanye-Stillwater’s estimation of their current mineral reserves and resources; the ability to
achieve anticipated efficiencies and other cost savings in connection with past, ongoing and future acquisitions, as well as at existing operations; our ability to achieve steady
state production at the Blitz project; the success of Sibanye-Stillwater’s business strategy; exploration and development activities; the ability of Sibanye-Stillwater to comply with
requirements that they operate in a sustainable manner; changes in the market price of gold, PGMs and/or uranium; the occurrence of hazards associated with underground and
surface gold, PGMs and uranium mining; the occurrence of labour disruptions and industrial action; the availability, terms and deployment of capital or credit; changes in relevant
government regulations, particularly environmental, tax, health and safety regulations and new legislation affecting water, mining, mineral rights and business ownership, including
any interpretations thereof which may be subject to dispute; the outcome and consequence of any potential or pending litigation or regulatory proceedings or other
environmental, health and safety issues; power disruptions, constraints and cost increases; supply chain shortages and increases in the price of production inputs; fluctuations in
exchange rates, currency devaluations, inflation and other macro-economic monetary policies; the occurrence of temporary stoppages of mines for safety incidents and
unplanned maintenance; the ability to hire and retain senior management or sufficient technically skilled employees, as well as their ability to achieve sufficient representation of
historically disadvantaged South Africans in management positions; failure of information technology and communications systems; the adequacy of insurance coverage;
any social unrest, sickness or natural or man-made disaster at informal settlements in the vicinity of some of Sibanye-Stillwater’s operations; and the impact of HIV, tuberculosis
and the spread of other contagious diseases, such as coronavirus (“COVID-19”). Further details of potential risks and uncertainties affecting Sibanye-Stillwater are described in
Sibanye-Stillwater’s filings with the Johannesburg Stock Exchange and the United States Securities and Exchange Commission, including the Integrated Annual Report and the
Annual Report on Form 20-F.
These forward-looking statements speak only as of the date of the content. Sibanye-Stillwater expressly disclaims any obligation or undertaking to update or revise any forward-
looking statement (except to the extent legally required).

                                                                                                                                                                                       2
SA PGM operations - Investor day (session 3) - 23 September 2021 - The Vault
Introduction
Richard Stewart, Chief Operating Officer
SA PGM operations - Investor day (session 3) - 23 September 2021 - The Vault
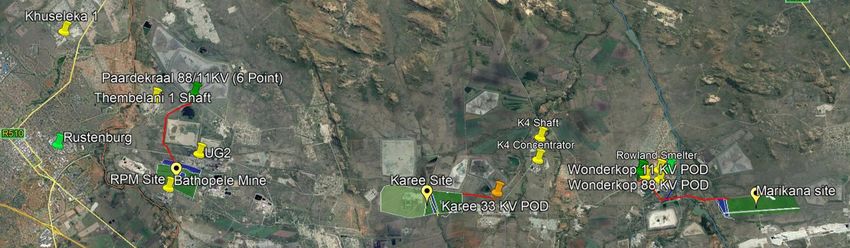
Location of SA PGM operations
                                  Four distinct ore bodies
                                   A. WESTERN LIMB OPERATIONS     B. EASTERN LIMB PROJECTS

                                   Rustenburg 100% (managed)      Blue Ridge 50% (managed)
                                   Kroondal 50% (managed)         Zondernaam 74% (managed)
                                   Marikana 95.3% (managed)       Limpopo (attributable portions of
                                   Platinum Mile 100% (managed)   Baobab, 95.3%
                                   Hoedspruit 74% (managed)       Dwaalkop JV, 45.3%
                                                                  Doornvlei 95.3% (managed)

                                   C. NORTHERN LIMB PROJECTS      D. GREAT DYKE
                                                                  (ZIMBABWE) OPERATION
                                   Akanani 93.1% (managed)
                                                                  Mimosa 50% (non-managed)

                                 Far
                                South
                                 Hill

                                                                                                      4
SA PGM operations - Investor day (session 3) - 23 September 2021 - The Vault
Overview of Sibanye-Stillwater's SA PGM Western Limb operations

Extensive mineralised strike length with down dip potential

                                                                  5
SA PGM operations - Investor day (session 3) - 23 September 2021 - The Vault
Acquisition synergies realised to date

                        PGM Integration savings to date

                3,500
                                                                                                                        • Shared overhead cost between
                                                                                                                          Group and other operations
                3,000                                                                                                   • Footprint reduction
                                                                                                                        • Optimisation of surface infrastructure
                2,500
                                                                                                                        • Contract management and
                                                                                                                          procurement synergies
                2,000
   R millions

                                                                                                                        • Closure of Marikana head offices and
                                                                                                                          end of life Generation 1 shafts
                1,500
                                                                                                                        • Streamlining processes and
                                                                                               180              1,830     procedures
                1,000
                                                                                                                        • System alignment and enhancement
                                                                                                                        • Preserved 12,500 jobs at Rustenburg
                 500
                                                                                                                        • Preserved 2,863* jobs at Marikana
                                 1,034                       1,034                           1,034              1,034     (excluding K4 project)
                   0
                                 2017                        2018                             2019              2020

                                                    Aquarius & Rustenburg           Marikana

R2.9 billion in annual synergies realised from the acquisition of Aquarius (Kroondal and Mimosa), Rustenburg and Marikana

Include 2,252 jobs saved at 4B Shaft but excluded 4.380 jobs created when the K4 project reaches steady state                                                 6
SA PGM operations - Investor day (session 3) - 23 September 2021 - The Vault
Successful completion of the Marikana integration - synergies delivered

                                 Production and operating cost (excl third party processing and by-product credits)                                                       Integration synergy benefits
                       250,000                                                 COVID Lockdown                                           35,000                            visible in Marikana operating
                                            227,466    Acquired                    impact
                                                                                                                                                                          costs
                                                                                                                              194,689   30,000
                       200,000                                                                                                                                            • Q2 2021 vs Q2 2019

                                                                                                                                                 Operating cost R/4E oz
4E production ounces

                                                                                                                                        25,000
                                                                                                                                                                            - 12% nominal improvement
                       150,000                                                                                                                                                in operating unit cost
                                                                                                                                        20,000
                                            20,021
                                                                                                                               18,039                                         despite 14% less ounces
                                                                                                                                        15,000
                       100,000                                                                                                                                                produced (post Generation
                                                                                                                                        10,000                                1 shaft closures in 2019)
                        50,000
                                                                                                                                        5,000

                            0                                                                                                           0
                                  Q1 2019   Q2 2019    Q3 2019    Q4 2019   Q1 2020   Q2 2020   Q3 2020   Q4 2020   Q1 2021   Q2 2021

                                                      PGM 4E ounces                   Operating cost

              Annual synergies of R1.8bn (excluding potential processing synergies)

                                                                                                                                                                                                    7
SA PGM operations - Investor day (session 3) - 23 September 2021 - The Vault
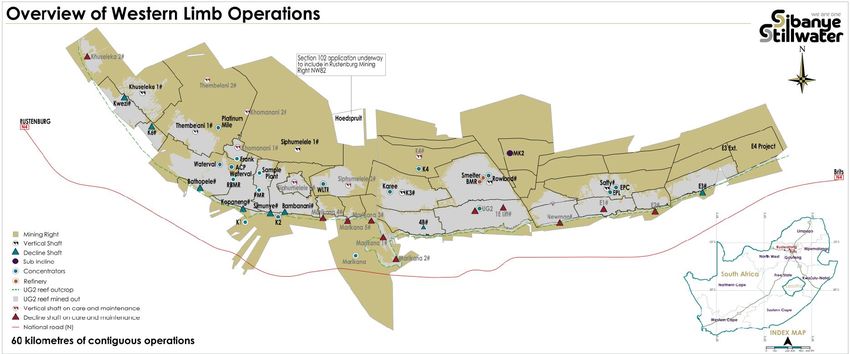
SA PGM operations moving down the industry cost curve

                                                                                                                                                                                                Global PGM Cash cost curve (CY21E- At Spot)
                                                                                                                                                                                                                                 Cumulative Annual Production (4E Koz)

                                               0   500                  1,000                  1,500                    2,000                 2,500                 3,000                          3,500                         4,000                4,500             5,000                           5,500         6,000               6,500          7,000                   7,500                 8,000                  8,500   9,000
                                      60,000                                                                                                                                                                                                                                                                                                                                                                                                               60,000
                                                                                                                                                                                                                                                                                                                                         Spot PGM basket price received
  Cash Cost and Basket Price (R/oz)

                                      50,000                                                                                                                                                                                                                                                                                                                                                                                                               50,000

                                      40,000                                                                                                                                                                                                                                                                                                                                                                                                               40,000

                                      30,000                                                                                                                                                                                                                                                                                                                                                                                                               30,000

                                      20,000                                                                                                                                                                                                                                                                                                                                                                                                               20,000

                                      10,000                                                                                                                                                                                                                                                                                                                                                                                                               10,000

                                           -                                                                                                                                                                                                                                                                                                                                                                                                               0
                                                                                Sylvania Dumps (SLP)

                                                                                                                                                                                       Two Rivers (ARM/IMP)

                                                                                                                                                                                                                                                                                                                                                             Modikwa (ARM/AMS)

                                                                                                                                                                                                                                                                                                                                                                                                          Zondereinde (NHM)
                                                    Mogalakwena (AMS)

                                                                                                                        Booysendal (NHM)

                                                                                                                                                                                                                                                                                                                                                                                   Amandelbult (AMS)
                                                                                                                                                                                                                                 Kroondal (SSW/AMS)

                                                                                                                                                                                                                                                                                                                                                                                                                                       Impala Mine (IMP)
                                                                                                                                           Stillwater (SSW)

                                                                                                                                                              Unki (AMS)
                                                                                                                                                                           LDI (IMP)

                                                                                                                                                                                                                                                                         Mototolo (AMS)

                                                                                                                                                                                                                                                                                                         BRPM (RBP)

                                                                                                                                                                                                                                                                                                                                           Marula (IMP)
                                                                                                                                                                                                                                                                                                                                           Tharisa (THA)
                                                                                                       Zimplats (IMP)

                                                                                                                                                                                                              Mimosa (IMP/SSW)

                                                                                                                                                                                                                                                                                                                                           Styldrift (RBP)
                                                                                                                                                                                                                                                       Marikana (SSW)

                                                                                                                                                                                                                                                                                          Union (SIY)

                                                                                                                                                                                                                                                                                                                      Rustenburg (SSW)
Successful integration and realisation of synergies has moved Rustenburg and Marikana significantly down the cost curve

Source: Nedbank                                                                                                                                                                                                                                                                                                                                                                                                                                                     8
SA PGM operations - Investor day (session 3) - 23 September 2021 - The Vault
Extensive resources and reserves*
     • Reserve estimate are based on a three-year trailing average price assumption

 SA PGM OPERATIONS                                                       6E PGM Mineral Resources (%)                   6E PGM Mineral Reserves (%)

Current life of mine (LOM) (at 31 Dec 2020)                                              27%                                              3%   3%
• Kroondal 11 years                                                                                                                                   6%

• Mimosa 11 years
                                                                         1%
• Marikana over 40 years                                                2%                                             34%
                                                                       1%
• Rustenburg 32 years
                                                                                   6E PGM mineral                               6E PGM mineral
• Surface sources
                                                                                    resources (%)                                 reserves (%)
     - Rustenburg 7 years
     - Marikana (Bulk Tailing Treatment) 5 years                                        Total                                         Total
                                                                                      350.8 Moz                                    46.36 Moz
 SA PGM operations                              % of 6E contribution
                                                                       27%
                                                                 50%                                          42%
Platinum
Palladium                                                        25%
                                                                                                                                                       54%
Rhodium                                                          7%

Gold                                                             2%
                                                                              Marikana         Rustenburg   Kroondal
Ruthenium                                                        13%
                                                                              Mimosa           Tailings     Projects
Iridium                                                          3%

 Reserves support long operational lives with extensive resources providing significant optionality

 •    PGM resources are inclusive of reserves
 •    Represents attributable figures from Mimosa and Kroondal
                                                                                                                                                             9
SA PGM operations production profile

                            Underground (attributable) and surface production

          2,000,000
                                                               Forecast

          1,600,000
4E PGM ounces

          1,200,000

                800,000

                400,000

                     0
                          2016   2017   2018   2019   2020   2021   2022    2023   2024    2025     2026   2027   2028   2029   2030   2031   2032   2033   2034   2035    2036   2037   2038   2039   2040

                             Mimosa       Kroondal      Rustenburg         Marikana       Surface      Projects (K4 and Klipfontein)

 Long life PGM profile – delivering significant, sustainable benefits for all stakeholders

 Note: Graph based on Reserves declared as at 31 December 2020. Current life of mine include K4 and Klipfontein. Price assumptions are available for reference in the appendix                         10
Significant development potential from extensive PGM Mineral Resources
                                                                                                                                                      Reserve
       SA project pipeline                                                                                      Area Name                             /Resource Est
                                                                                                                                                      (Moz)
                                                                                                           1    Marikana K4 (Both) Execution              13,43
       17                                                                                                  2    Marikana E3D (UG2) FS Complete             2,75
                      13           15                                                                      3    KDL Klipfontein (UG2) Waiting              0,13
                                                     11                                          3
                                                                 10          6       5
                                          12
                                                                                                     1      4   Siphumelele 1 (UG2) Upper                  4,89
            18
                                                   19                                    4       2          5   Siphumelele 1 (UG2) Lower                  4,35
                                                                                 7
                                                                 9       8                                  6   Marikana E4 (UG2)                          6,03
                                        16                20                                                7   Thembelani extension (MER)                 5,23
                                                                                                            8   Kroondal 5# (UG2) MK5                      2,16
                 14
                                                                        Project Status                      9   KDL Tailings (3 dams) Meccano              2,37
                                                                                                           10   Kwezi/K6 shallows                       0,27 - 1,06
                                                                       Feasibility complete

                                                                       Pre-Feasibility phase               11   Saffy Deeps (UG2)                         12,89
                                                                                                           12   Boschfontein (UG2)                         0,95
                                                                       Concept phase
                                                                                                           13   Pandora Deeps (UG2)                        7,69
                                                                                                           14   MK2 Decline (Both)                         5,26
                                                                                                           15   Baobab                                     5,04
         5-10 years                     2-5 years                    To complete 2021          Completed   16   Akanani                                    27,6
                                                                                                           17   Blue Ridge                                  1,8
                                                                                                           18   Marikana Tailings                          0,75
                       INCREASING CONFIDENCE / LESS RISK                                                   19   Retreatment of Paardekraal Tailings    In progress
                                                                                                           20   Retreatment of ETD2 Tailings           In progress

Potential for ongoing metal supply through project development in supportive environment

*   Note: Refer to full project pipeline slide in the appendix                                                                                                    11
Potential SA PGM production profile assuming development of key projects

                             Underground (attributable) and surface production(plus projects)

                2,000,000

                1,600,000
4E PGM ounces

                1,200,000

                 800,000

                 400,000

                       0
                            2021     2022    2023    2024     2025     2026   2027      2028     2029      2030      2031      2032      2033      2034      2035      2036      2037       2038   2039   2040

                                   Current LOM      Kroondal - Klipfontein    Marikana - E3 Deeps            E4        Saffy Deeps         Them Mer Ext           Sip UG2

      Long life assets with significant optionaility- flexibility to meet future demand requirements in supportive environment

      Note: Graph based on Reserves declared as at 31 December 2020. Current life of mine (LOM) include K4 and Klipfontein. Price assumptions are available for reference in the appendix                 12
Overview of the SA PGM operations
Dawie van Aswegen, EVP SA PGM operations
SA PGM operations leadership

                                                            EVP SA PGM Operations
                                                             Dawie van Aswegen

     Act SVP & Head           SVP & Head             SVP & Head                SVP & Head           SVP & Head             SVP & Head
        of Human               of Finance           of Technical         of Mining Rustenburg    of Mining Kroondal    of Mining Marikana
        Resources                                   & Integration              Operations            Operations
     Norman Nxumalo       Roderick Mugovhani       Kevin Robertson          Floyd Masemula      Bonginkosi Nqgulunga     Johann Kleyn

Experienced leadership and succession plan ensures continuity and consistency

                                                                                                                                            14
Safety performance
                                • ISO 45001 accreditation to be achieved during 2021 (Marikana already accredited)
                                • ICMM reporting adopted and added total recordable injury frequency rate (TRIFR) as a new KPI since the start of 2021

                                                                                                                              Achievements
                                 Fatal injury frequency rate - SA PGM1
                                                                                                                                  Kroondal operation              • 2,000,000 FFS2

                                                                                                                                  Rustenburg operation            • 1,000,000 FFS
Rate per million hours worked

                                                                                                                                  Marikana operation              • 3,000,000 FFS

                                                                                                                                  SA PGM Surface operation        • 5,000,000 FFS

                                                                                                                                  SA PGM plants & concentrators   • 13,000,000 FFS

                                                                                                                                  Total SA PGM operations         • 4,000,000 FFS
                                   0.11           0.04          0.04           0.05          0.06           0.02

                                   2016          2017           2018          2019           2020        YTD 2021

               Working towards zero harm with initiatives aligned to Group Zero harm framework
               1.                SA PGM operations had a workforce of 46,385 (including contractors) people at end Dec 2020
               2.                Fatal free shifts (FFS)                                                                                                                             15
Planned ounces and costs

                                     Underground operations
                                                                                                                                                            • Lower cost K4 and Klipfontein projects
                         2,000,000                                                                                                        21,000
                                                                                                                                                              approved in Q1 2021 - maintain
                                                                                                                                                              consistent profile
                                                                                                                                          18,000
                         1,600,000                                                                                                                          • AISC influenced by
                                                                                                                                                              royalty assumptions and basket price
Production (4E ounces)

                                                                                                                                          15,000
                                                                                                                                                              movement
                         1,200,000                                                                                                                          • Marikana integration savings
                                                                                                                                          12,000

                                                                                                                                                   R/4Eoz
                                                                                                                                                              fully embedded
                                                                                                                                          9,000             • Fit for growth procurement
                          800,000
                                                                                                                                                              savings included in contracts and
                                                                                                                                          6,000               stores. Labour costs are estimated as per
                                                                                                                                                              2019 wage agreements
                          400,000
                                                                                                                                          3,000             • 3-year trailing metal prices used to
                                                                                                                                                              estimate the by-product credits and
                                0                                                                                                         0                   royalties in line with the SARS regulations
                                       2021     2022    2023     2024     2025    2026       2027       2028        2029        2030
                                                                                                                                                            • NERSA guidance followed for
                                                                                                                                                              future electricity tariffs

                                       Mimosa      Marikana    Kroondal    Rustenburg      Operating cost R/4Eoz           AISC R/4Eoz

      AISC and operating cost are consistent
      Note:
      • Production profiles based on the 2020 LOM reserve and resources plan. Assumes attributable (50%) production from Mimosa and Kroondal
      • Costs are represented at 2021 real terms
      • Assumed exchange rate for conversion of Mimosa costs: R15.00/US$                                                                                                                            16
Surface sources – planned ounces and cost

                       Surface operations
                                                                                                                                       • Includes Marikana Bulk tailings
             160,000                                                                                                 25,000              treatment plant (BTT), Rustenburg
                                                                                                                                         Western limb tailings retreatment
                                                                                                                                         plant and Platinum Mile
                                                                                                                     20,000
             120,000                                                                                                                   • Platinum Mile holding increased from
                                                                                                                                         91.7% to 100% in H1 2021

                                                                                                                     15,000            • Current surface processing forecast
 4E ounces

                                                                                                                              R/4Eoz
                                                                                                                                         to end in 2027
              80,000

                                                                                                                     10,000
                                                                                                                                       • Assessment of BTT opportunity and
                                                                                                                                         WLTRP treatment of Marikana tailings
                                                                                                                                         could extend LOM up to 20 years
              40,000
                                                                                                                     5,000             • AISC benefit from by-product credits

                  0                                                                                                  0
                           2021        2022       2023            2024            2025           2026         2027

                         Rustenburg    Marikana   Platinum Mile          Operating cost R/4Eoz      AISC R/4Eoz

Option to increase LOM by up to 20 years being assessed

Note: Costs are represented at 2021 real terms                                                                                                                               17
Planned underground average head grade and recoveries

                  Underground operations
                  5.0                                                                                                                                 90%

                                                                                                                                                      85%
                  4.0

                                                                                                                                                      80%
 Head grade g/t

                                                                                                                                                            Recovery %
                  3.0
                                                                                                                                                      75%
                  2.0
                                                                                                                                                      70%

                  1.0
                                                                                                                                                      65%

                  0.0                                                                                                                                 60%
                         2021           2022    2023       2024              2025   2026           2027              2028   2029          2030

                        Kroondal - head grade          Mimosa - head grade                 Rustenburg - head grade            Marikana - head grade
                        Kroondal - recoveries          Mimosa - recoveries                 Rustenburg - recoveries            Marikana - recoveries

Consistent LOM grade and recoveries ensures stable production

                                                                                                                                                                         18
Planned capital expenditure (base)

             4,000                                                                                                                    •   Sufficient estimation of SIB Capital
                                                                                                                                          at 10% to 12% of operating cost,
             3,500                                                                                                                        and ending capital spend 4 years
                                                                                                                                          prior to closing an assets as to
             3,000                                                                                                                        eliminate over capitalising

             2,500                                                                                                                    •   Marikana smelting and refining
                                                                                                                                          compliance capital
 R million

             2,000
                                                                                                                                      •   Continuous Ore Reserve
             1,500                                                                                                                        Development (ORD) at the
                                                                                                                                          conventional shafts
             1,000

              500

                0
                         2021         2022        2023      2024        2025          2026         2027      2028   2029       2030

                     Kroondal - SIB          Rustenburg - ORD        Rustenburg - SIB            Marikana - ORD*    Marikana - SIB

Long-life assets with potential to mining through boundaries

Note:
• Capital expenditure in 2021 real terms. SIB: Stay-in-business capital, ORD: Ore reserve development
• Assumed exchange rate for conversion of Mimosa capital expenditure: R15.00/US$
• Represents attributable capital from Kroondal                                                                                                                              19
Base metals in concentrate profile
                Total operations – base metals profile
              12,000

              10,000

               8,000
     Tonnes

               6,000

               4,000

               2,000

                  0
                         2021         2022         2023   2024            2025       2026   2027        2028        2029         2030

                                                                 Nickel     Copper

Significant base metal produced as by-product from base metals refinery – existing hydrometallurgical processing expertise and knowledge
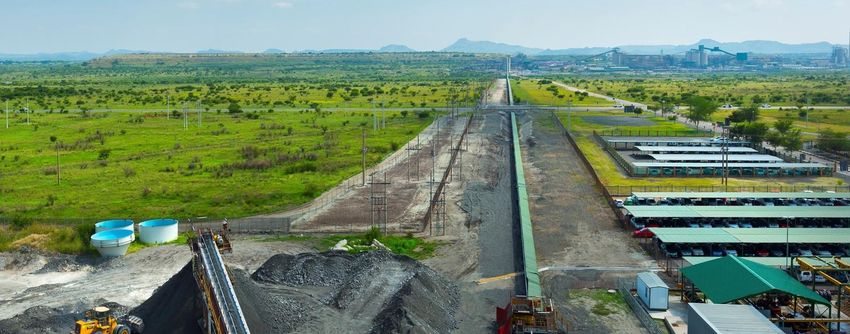
                                                                                                                                           20
Processing assets – competitive exposure to full value chain, from mine-to-market

Concentrators                                                                                                                                       Furnace reliability
• Adequate capacity and flexibility to treat both underground and surface

                                                                                     Tonnes Smelted Between Failures
  material

Smelting and refining
• Continued optimisation of furnaces through innovation and implementation of
  industry best practice standards ensuring ongoing reliability
  - Multiple design improvements
  - Stricter adherence to operating parameters
                                                                                                                       Jan-03   Nov-04   Mar-06   Dec-06   May-09    Mar-10   Nov-14   Oct-17   Current
  - Improved monitoring of furnaces
                                                                                                                                                   Furnace 1    Furnace 2
• Optimally utilise our smelter capacity taking into account the required ore
  blend
• Potential creation of additional value through utilization of available Base
  Metal Refinery (~50%) and Precious Metal Refinery (~50%) capacity
• Aligning processing strategy with future opportunities
Embedding ESG
• Currently meeting legislative limits. Future ESG projects will focus on reducing
  SO2 further

A competitive advantage and strategic differentiator - available capacity throughout processing stream provides significant optionality

                                                                                                                                                                                                    21
Chrome
David Kovarsky, SVP Chrome
Chrome production profile

                                                                                                                                              • Chrome produced as a by-product of PGM
                    Underground operations – chrome production profile                                                                          production –
    2,000,000                                                                                                               800
                                                                                                                                                - Primarily derived from UG2 reef
                                                                                                                                               - Grade of approximately 40.5% chrome.
    1,600,000                                                                                                                                  - Produced by standalone chrome recovery plants
                                                                                                                            600
                                                                                                                                               - Included in gross revenue and as a credit to AISC

    1,200,000                                                                                                                                  - Direct mining costs not allocated to chrome
                                                                                                                                                 production

                                                                                                                                  R million
Tonnes

                                                                                                                            400
                                                                                                                                              • 2021 full economic benefit on ~800,000 tonnes, an
         800,000                                                                                                                                increase in 2021 of 90,000 tonnes when the contract
                                                                                                                                                to supply Samancor expired in 2020
                                                                                                                            200               • Legacy agreements yield varying amounts received
         400,000                                                                                                                                for chrome , some below market prices
                                                                                                                                              • Since acquisition, chrome plants achieved
                                                                                                                                                production growth
              0                                                                                                             0
                   2021       2022      2023       2024      2025       2026      2027       2028      2029       2030                        • The South African ferrochrome industry has proposed
                   Marikana - below market                                            Kroondal - below market                                   a chrome export tax. This proposal is being opposed
                   Kroondal - market related                                          Marikana - market related
                                                                                                                                                strongly by primary chrome ore and UG2 producers
                                                                                                                                                as it could lead to lower sales and job losses
                   Rustenburg - market related                                        Kroondal -Contribution to revenue
                   Rustenburg - Contribution to revenue                               Marikana - Contribution to revenue

    Chrome is a significant contributor to profitability of SA PGM operations
    Note: Beneficial tonnes are sold at market related prices with little or no value realised from non-beneficial tonnes
    Gross revenue assumes a chrome price of R2,600 per tonne                                                                                                                                         23
Financial aspects
Roderick Mugovhani, SVP: Finance
SA PGM operating cost breakdown

              Operating costs classification (%)
                                                                         • Labour cost includes salaries, incentives, overtime and company
                                3%                                         contributions
                           7%
                                                                         • Stores and material includes higher than inflation rates of steel,
                                                                           explosives and underground support
                                                                         • Overheads incorporate Group and services charges
                                          43%
               25%
                                                                         • Fit for growth ( FFG) initiatives focus on the reduction of contract
                                                                           expenditure (c. R800m for the SA Region)
                                                                         • Some contractor's expenses are driven by exchange rate pressures

                     5%
                                                                         • Continuous footprint reduction as a result of further integration initiatives
                          4%                                             • Excludes ORD and SIB capital
                               4%    9%
                                                                         • Compliance to ESG requirements, in particular to Marikana smelting and
        Salaries and wages                 Utilities                       refining complex
        Chrome transport etc cost          Rustenburg toll charges
        Overheads                          Consumables
        Contractors                        Other

Consolidation of cost from the total segment that is made up of Conventional and Mechanised shafts

Based on HY1-2021 Operating
Additional COVID-19 cost included
Excludes the 3rd party purchases                                                                                                                      25
SA PGM operating cost breakdown by operation

                                    0%                                                                                                                1%

                            9%                                                                       6%
                                                                                                3%                                             10%

                                                                                                                                                                               37%
            20%                                          40%
                          Rustenburg –                                               28%          Marikana –              48%                   Kroondal –
                         operating costs                                                        operating costs                               operating costs
                                                                                                                                    31%
                          classification                                                         classification                                classification
            5%

                   11%                                                                     6%
                                                                                                                                                                         8%
                                          10%                                                   2%
                               5%                                                                     8%                                         6%         7%

    Salaries and wages                   Utilities                              Salaries and wages          Utilities           Salaries and wages               Utilities
    Chrome transport etc cost            Rustenburg toll charges                Chrome transport etc cost   Overheads           Chrome transport etc cost        Overheads
    Overheads                            Consumables                            Consumables                 Contractors         Consumables                      Contractors
    Contractors                          Other                                  Other                                           Other

 Conventional shafts at Rustenburg and Marikana are more labour intensive resulting in higher proportion of salaries and wages
Marikana includes the Smelting and refining operations
Rustenburg operations labour cost incorporates the Bathopele Mechanized shaft cost
                                                                                                                                                                                     26
SA PGM fixed and variable cost breakdown per operation (operating cost)

                70%
                                                                                                            • Based on steady state
                                               59.4%                                                          operations, normalised for COVID-
                60%                                               57.5%
                              56.1%                                                          55.1%            19 lockdowns

                50%                                                                                         • Combination of all the operations
                      43.9%                                                          44.9%                    on a 100% basis
                                                                          42.5%
                                       40.6%
 % Allocation

                40%                                                                                         • Fixed costs consist mainly of labour
                                                                                                              costs, electricity, overheads
                30%                                                                                           and contractors

                                                                                                            • Mechanised operations have less
                20%
                                                                                                              fixed to variable cost ratio

                                                                                                            • Variable costs are linked
                10%
                                                                                                              to production output, i.e. stores,
                                                                                                              incentives and overtime shifts
                0%
                      Rustenburg        Marikana                   Kroondal       SA PGM operations

                                               Variable   Fixed

Lower proportion of fixed cost at the mechanised operations, i.e. Bathopele Shaft at Rustenburg and Kroondal operations

                                                                                                                                                   27
H1 2021 reconciliation of AISC (R/4Eoz) – excluding 3rd party purchases at Marikana

          25,000
                                                                                                                                    • All-in sustaining cost (AISC) was
                                                                                                                                      developed and generally
          20,000                                                                                                                      adopted by the global gold
                                                                                                                                      industry to ensure consistent and
                                                                                                                                      comparable reporting of costs
          15,000
                                                                                                                                    • Includes by-product revenue that
 R/4Eoz

                                                                                                                                      is offset as a credit against costs

          10,000                                                                                                                    • 3rd party purchases of
                                                                                                                                      concentrate accounted for
                                                                                                                                      additional R1,914/4Eoz AISC
           5,000
                                                                                                                                      for H1 2021

                                                                                                                                      - Significant revenue benefit from
              0                                                                                                                        third party processing and
                   Operating     SIB Capital     ORD Capital Controllable -    Sundry    Royalty tax   By-product   AISC excl POC
                                                                                                                                       improved capacity utilisation
                     cost                                       AISC          expenses                   credits

Impact of by-product credits in the AISC influenced by price movement of Ir, Ru, Cr, Cu, Ni and other by-products

 SIB: Stay-in-business capital, ORD: Ore reserve development
                                                                                                                                                                            28
Significant value in "by-product" PGMs
 % Price increases of iridium and ruthenium                                                                                                                                                                                                                                                             Positive impact of by-
2,000
1,800
                                                                                                                                                                                                                                                                                                           product credits              •   By-product revenues offset cost
1,600                                                                                                                                                                                                                                                                                                                                       in the AISC calculation (credit
1,400
1,200                                                                                                                                                                                                                                                                                                                                       against costs)
1,000                                                                                                                                                                                                                                                                                             H1 2021
  800
  600                                                                                                                                                                                                                                                                                                                                   •   Growth in by-product credits
  400
  200                                                                                                                                                                                                                                                                                               2020
                                                                                                                                                                                                                                                                                                                                            from other PGM metals Iridium –
    0                                                                                                                                                                                                                                                                                                                                       731%, Ruthenium - 1680%
            Oct-16
                     Dec-16

                                                                  Oct-17
                                                                           Dec-17

                                                                                                                        Oct-18
                                                                                                                                 Dec-18

                                                                                                                                                                                  Oct-19
                                                                                                                                                                                            Dec-19

                                                                                                                                                                                                                                            Oct-20
                                                                                                                                                                                                                                                     Dec-20
                              Feb-17
                                       Apr-17

                                                                                    Feb-18
                                                                                             Apr-18

                                                                                                                                          Feb-19
                                                                                                                                                    Apr-19

                                                                                                                                                                                                      Feb-20
                                                                                                                                                                                                                Apr-20

                                                                                                                                                                                                                                                              Feb-21
                                                                                                                                                                                                                                                                       Apr-21
                                                Jun-17
                                                         Aug-17

                                                                                                      Jun-18
                                                                                                               Aug-18

                                                                                                                                                              Jun-19
                                                                                                                                                                        Aug-19

                                                                                                                                                                                                                          Jun-20
                                                                                                                                                                                                                                   Aug-20

                                                                                                                                                                                                                                                                                Jun-21
                                                                                                                                                                                                                                                                                         Aug-21
                                                                                                                                                                                                                                                                                                    2019                                •   Base metal by-product credit
                                                                                                                Iridium                               Ruthenium                                                                                                                                                                             growth Copper – 198% and
% Price increases of nickel and copper                                                                                                                                                                                                                                                                                                      Nickel - 187%
250                                                                                                                                                                                                                                                                                                 2018

                                                                                                                                                                                                                                                                                                                                        •   Increase in by-product credit
200
                                                                                                                                                                                                                                                                                                                                            prices during 2021 contributing
150                                                                                                                                                                                                                                                                                                 2017
                                                                                                                                                                                                                                                                                                                                            to significant increase in
100                                                                                                                                                                                                                                                                                                                                         operating profit
 50                                                                                                                                                                                                                                                                                                 2016                                     − By-products accounted for
  0
                                                                                                                                                                                                                                                                                                                                               R4,139/4Eoz reduction in AISC for
                                                                                                                                                                                                                                                                                                                                               H1 2021
        Oct-16
                 Dec-16

                                                              Oct-17
                                                                       Dec-17

                                                                                                                    Oct-18
                                                                                                                             Dec-18

                                                                                                                                                                                 Oct-19
                                                                                                                                                                                           Dec-19

                                                                                                                                                                                                                                            Oct-20
                                                                                                                                                                                                                                                     Dec-20                                                 0   2,000   4,000   6,000
                          Feb-17
                                   Apr-17

                                                                                Feb-18
                                                                                         Apr-18

                                                                                                                                      Feb-19
                                                                                                                                                   Apr-19

                                                                                                                                                                                                     Feb-20
                                                                                                                                                                                                               Apr-20

                                                                                                                                                                                                                                                              Feb-21
                                                                                                                                                                                                                                                                       Apr-21
                                            Jun-17

                                                                                                  Jun-18

                                                                                                                                                             Jun-19

                                                                                                                                                                                                                         Jun-20

                                                                                                                                                                                                                                                                                Jun-21
                                                     Aug-17

                                                                                                           Aug-18

                                                                                                                                                                       Aug-19

                                                                                                                                                                                                                                   Aug-20

                                                                                                                                                                                                                                                                                         Aug-21
                                                                                                                                                                                                                                                                                                                   R/4Eoz

                                                                                                                    Nickel                                  Copper

  By-product benefits realised in increased revenue and lower AISC

                                                                                                                                                                                                                                                                                                                                                                          29
SA PGM projects
Ralph Lombard, SVP Projects (Group Technical)
K4 project – unrivalled PGM brownfields project
 • Mining both Merensky and UG2 reefs to a depth of 1,287m
 • Project significantly predeveloped by Lonmin – most infrastructure already
   in place:
   - equipped and functional vertical shaft to a depth of 1,332m
   - equipped and functional ventilation shaft to a depth of 1,078m
   - functional 130,000 tpm concentrator
   - existing surface infrastructure such as offices, change houses,
     refrigeration plants, grout plants, etc.
   - stations and station crosscuts
 • Project progress
   - Key project personnel sourced & EPCM contractor in place
   - Infrastructure & mining early works commenced – major focus areas for
     next 9 months
   - Mining activities on track to commence Q2, 2022
   - Design on track with a focus on ESG friendly solutions

Regional social and economic benefits
 • Ensures sustainability of Marikana operations for over 50 years
 • Significant investment in local economy
 • Will provide ~4,380 jobs at steady state
 • Meaningful opportunities for local procurement,
   SMME development and skills transfer

                                                                                31
K4 project – unrivalled tier 1 PGM project

Key statistics (2021 terms)                                  LoM capital expenditure profile (R million)
    • Project capex* of ~R4.0bn over                 1,200

      8 years - majority during first 3              1,000
      years                                           800
    • Steady state (2030-2063)                        600
      ~250koz per annum                               400
    • Average operating cost ~                        200
      R16,051/4Eoz (R16,000/oz at
                                                        0
      steady state)

                                                             2021
                                                             2022
                                                             2023
                                                             2024
                                                             2025
                                                             2026
                                                             2027
                                                             2028
                                                             2029
                                                             2030
                                                             2031
                                                             2032
                                                             2033
                                                             2034
                                                             2035
                                                             2036
                                                             2037
                                                             2038
                                                             2039
                                                             2040
                                                             2041
                                                             2042
                                                             2043
                                                             2044
                                                             2045
                                                             2046
                                                             2047
                                                             2048
                                                             2049
                                                             2050
                                                             2051
                                                             2052
                                                             2053
                                                             2054
                                                             2055
                                                             2056
                                                             2057
                                                             2058
                                                             2059
                                                             2060
                                                             2061
                                                             2062
                                                             2063
                                                             2064
                                                             2065
                                                             2066
                                                             2067
                                                             2068
                                                             2069
                                                             2070
                                                             2071
    • Six years payback
    • ~11.5m 4Eoz produced
      over 50 year life of mine                                 ORD     SIB   TSF    Infrastructure

    • NPV (15% real discount rate
      – R3bn at assumed project                          Commodity price and exchange rate assumptions
      prices                                             Metal price                                     Unit   2021    Thereafter
    • IRR 33% at assumed prices                          Platinum                                      US$/oz    900          880
                                                         Palladium                                     US$/oz   1,900       1,600
                                                         Rhodium                                       US$/oz   8,500       5,650
                                                         Gold                                          US$/oz   1,605       1,500
                                                         ZAR/USD                                      ZAR/US$   15.50       15.00

Low capital intensity, short lead time, superior return on investment

*    Inclusive of TSF, excluding ORD and SIB capex                                                                                   32
Klipfontein PGM project – shallow, open pit

  • Open pit operation adjacent to Kroondal East Bambanani shaft                          Klipfontein – expected 4E PGM oz production
  • UG2 reef will be mined to depth of ~45m
  • 50/50 JV with Anglo American Platinum (under the current PSA)
  • Key statistics (2021 terms) – 100%#
    - R66m project capital*
    - S102 approved by DMRE
    - Ore will be transported and treated at the K2 Concentrator
    - Average steady state production (2022-2024) ~37,000 4Eoz per year
    - Average operating cost of R8,754/4Eoz (R8,622/oz at steady state)
    - 118,250oz produced over 3 year life
    - NPV (15% real) ~ R740m at assumed prices
    - IRR 70% at assumed prices
    - 4-month payback
                                                                                                                     UG crown pillar
  • Initiated project ‘kick off’ on 11 August 2021

Regional social and economic benefits
 • Providing 124 jobs - contractor to source local labour
                                                                                                   Open pit
 • Creating opportunities for local procurement and SMME development                              Mining limit

 • Rehabilitation to agricultural farm-land status, at the end of the project

* Excluding SIB capex                                                                                                     Surface topography
# Numbers quoted as 100% for the project. Sibanye-Stillwater will have 50% attributable                                                        33
Value creation through sustainability
Jevon Martin, Head of Energy & Decarbonisation
Grant Stuart, SVP Environment
Thabisile Phumo, SVP Stakeholder Relations
SA PGM operations' role in the Group journey to carbon neutrality
                                Our path to carbon neutral by 2040
                                 • Long-term GHG emissions reduce naturally with declining PGM
                                   production profile
                                 • Benefits from National renewable energy plan towards 2040
     SA PGM operations           • Various proactive initiatives underway to further accelerate our
    currently account for          decarbonisation plan
       310MW or 39%             Demand side energy management
 of Group energy demand
                                 • Advance energy management – 60,201 tCO2e of GHG emissions
               82                  reduced in 2020 through:
               3%                  - Integrated and dynamic digital twin simulations
                                   - Compressed air optimization
         Total CO2e                - Pumping system improvements
      emissions (2020):            - Ventilation system enhancement
       Scope 1 & 2                 - Energy culture and awareness campaigns
        (000t CO2e)             Strategic energy sourcing
                                 • 175MW solar projects (overleaf) at SA PGM operations                  Remotely-operated battery LHD to be trialed
              2,472              • Allocation of wind energy benefits through wheeling
              97%                • Investigation of coal input alternatives for the Marikana smelter
                                Technology adoption
                                 • Investigation of battery electric vehicle opportunities, including
    Scope 1           Scope 2
                                   trialing of remotely-operated, battery electric vehicles and Li-ion
                                   battery locomotives at K4
                                Scope 3 and carbon offsets
 97% of current operational      • Development of Scope 3 targets and a carbon offset strategy to
 emissions from Eskom coal         address remnant hard-to-abate emissions
        fired power

Electricity will remain the focus as the primary contributor to operational emissions
                                                                                                                                                       35
SA PGM operations' role in the Group journey to carbon neutrality

                               80MW
                                          RPM 4                       65MW                BMR 2                                30MW

 • Feasibility study for three on-site Solar PV projects completed:          • Total capital cost of R2.5-2.8bn to be finance through three separate
   − Plant sizing based on comprehensive study, including life of              PPA arrangements
     mine analysis, allowing for up 175MWp                                     − Minimal capital outlay with access to renewable electricity at a
   − Available land at RPM and Marikana with scope for future                    30-50% (solar) discount to grid electricity, escalating at CPI
     expansion                                                                 − Reduction of GHG emissions and future carbon tax liabilities
   − No fatal flaws to process                                               • Target financial close H1 2023, with commercial operation early 2025
   − Viable technical solutions for electrical connections into the            − Critical lead items include permitting processes and have been
     corresponding substations                                                   initiated
Recent regulatory reforms and less obstructive approach have catalysed progress
                                                                                                                                               36
Rehabilitation obligations

Planning and execution for sustainable post-mining socio-economic closure within local communities
                 ACHIEVEMENTS                                          CLOSURE LIABILITY                             CONCURRENT REHABILITATION
 • Development of regional closure strategy and         • 2020 liability assessment independently             • Rehabilitation of the Klipfontein Concentrator
   plans that include fit for purpose post-mining         assessed in accordance with closure plans             (before)
   land uses                                            • Externally assessed and audited closure
 • Advanced concurrent rehabilitation initiatives in      liabilities in accordance with GN R. 1147
   collaboration with local small medium                • Closure liabilities funded through funds in trust
   enterprises                                          Toandachieve
                                                                guarantee an insurance
                                                                              agreed safe,    stable, non-
                                                                                       policies
 • Potentially leverage 50.1% stake in DRDGOLD to      polluting and aesthetically aligned regional
   exploit surface rehabilitation opportunities            post-mining
                                                                    2% solution, supporting the
 • Footprint reduction initiatives (Klipfontein           creation of sustainable communities,
   Concentrator)                                                                 26%
   − 100% local and black owned company                 conservation areas that will deliver clean
                                                                   40% and regional catchments,
                                                        water to local
   − Skills development and employment from
      local community                                      and enable sustainable post mining
   − Total liability reduction – R40.6m                        economies and ecosystems.
                                                                               30%
• Deposition into pits in accordance with                                                                     • Rehabilitation of the
                                                                       2%
   environmental authorisations (R1bn)                                                                          Klipfontein Concentrator
                                                                       Rustenburg
                                                                       Blue Ridge
                                                                                    Kroondal
                                                                                    Marikana
                                                                                                                (after)

                                                        • R4.7bn estimated closure liability – 9% over
                                                          funded through cash in trust and guarantees

Planning for long term economic sustainability over the 20 year + life of mine: integrated post mining economy

                                                                                                                                                                 37
Tailings management

We commit to zero harm at all stages of tailings lifecycle

   EMPOWERED & ENABLED ACCOUNTABILITY                                     GOVERNANCE STRUCTURE                                                                      IN DEVELOPMENT
 • Accountable Executive responsible to the CEO                                                                                                     • International Council of Mines and Metals (ICMM)
 • Appointed VP Tailings Engineer for the Group
                                                                                                  Board
                                                                                                                                                      commitments:
 • Internationally recognised Independent Tailings                            Tailings Policy                  Policy Assurance
                                                                                                                                                          • Tailings Management System – Done
   Review Board established                                                                                                                               • Compliance for “Very High” or “Extreme” TSFs
 • Tailings Working Group established across SA PGM
                                                                                                 Executive                                                  – August 2023
         • Consolidated risk management                                                                                                                   • Compliance for TSF balance – Aug 2025
                                                                              Governance                        Governance Assurance

         • Increased awareness and elevation of risk
                                                                               Framework
                                                                                                                                                    • Re-classification to GISTM consequence matrix
 • Engineering consulting companies and Engineers of
                                                            Independent Tailings
                                                               Review Board
                                                                                           Tailings Engineering                                            • 16% complete with 74% end 2022
   Record appointed                                                                                                                                       Hazard classification as per SANS 10286*
                                                                                   Standards                      Standards Assurance
 • Appointment of Concentrator Managers as the
                                                                                                                                                                        1 1
   Responsible Tailings Facility Engineer                                                       Operations
                                                                                                Owner, RTFE
        • Support provided by VP Tailings and Engineers
           of Record                                                       KPI’s, TARPs and
                                                                                    Systems
                                                                                                               Conformance Assurance                               5
 • Digital platform developed on PIVOT application for                                   Tailings Storage Facility           Engineer of Record

   consolidated GISTM conformance audits with action                                     Operator and Support              Engineering Consultant

   tracking for monthly audits and consolidated
   reporting of progress                                                                                                                                                                16
                                                          • Group Tailings Management System framework
 • Group representation on ICMM Tailings Working            drafted
   Group
                                                          • Terms of References for internal and external                                                     Active High        Dormant High
 • Internal competence training to ensure ownership
                                                            appointees drafted                                                                                Active Med         Dormant Med
   and reduce external reliance

Group Tailings Management System (GTMS) aligned to the Global Industry Standard for Tailings Management (GISTM)

*SANS 10286 (1998) using Empirical Methodology
                                                                                                                                                                                                         38
Optimising a critical resource- water use management strategy

  Water security strategy supporting climate change resilience and sustainable economies

                WATER SECURITY STRATEGY                                          OBJECTIVE AND COMMITTMENT                                          WATER CONSERVATION SUCCESS
    • Collaborative engagement                                          Responsible and collaborative water                                 • Reduction of more than 1,400 Ml (11%) in
    • Actively participate in regional catchment                        management by driving water security and                              potable water purchases 2020 compared to
      management forums                                                 independence strategies with compliance                               2019
                                                                        to regulatory requirements, building a climate                      • 18% reduction in potable water purchases since
    • Marikana integration
                                                                        resilient business in anticipation of responsible                     2018*
    • Water harvesting and storage opportunities                         To achieve an agreed safe, stable, non-
                                                                        closure
    • Water conservation and water demand                             polluting and aesthetically aligned regional                                            SA PGM Consumption (Ml)
      management plans                                                    post-mining solution, supporting the                                      1,400
    • Predictive water balance management                                creation of sustainable communities,                                       1,200
                                                                       conservation areas that will deliver clean                                   1,000
                                                                       water to local and    regional
                                                                                       Platinum    (%)  catchments,                                  800

                                                                                                                                               ML
                                                                          and enable
                                                                               65%    sustainable post mining
                                                                                          0.9kl/ton                                                  600
                                                                                       (excluding rain)
                                                                              economies and ecosystems.                                              400
                                                                                                                                                     200
                                                                        • Stringent monitoring and transparent reporting
                                                                                                                                                       -
                                                                          − Smart water management through online
                                                                             monitoring through the Zednet platform
                                                                          − Group water CDP disclosure submitted July                                       Rustenburg (Ml)       Kroondal (Ml)
                                                                             2021                                                                           Marikana (Ml)         Target Consumption

The SA PGM operations are well placed to realise ISO 14001: 2015 accreditation by end 2021 with the accreditation for Kroondal processing (Boabab K1, K2), Kroondal and RPM mining received in September 2021

  Water consumption reduced by 15%, 22% and 21% across Marikana, Kroondal and Rustenburg respectively from 2018 - 2020

   * Including Marikana operations for 2018 pre-ownership
                                                                                                                                                                                                         39
Making real changes to transform and create value for all stakeholders
      Restructuring of the Marikana empowerment structure
       • Previous structure non-beneficial with substantial debt burden                                    Investing in projects results in job security and opportunities
       • New sustainable B-BBEE financing structure with immediate access to
                                                                                                            • K4 and Klipfontein will employ > 4,500 jobs at steady state
         distributable cash flow and the ongoing transfer of tangible value
                                                                                                           Contributing to the fiscus and social imperatives
       • Securing the licence to operate for these operations
                                                                                                            •   Sibanye-Stillwater royalties and taxes* of R10.3bn for H1 2021 alone
      Social relief via BEE structures & employee profit share schemes
                                                                                                            •   Delivering on Social and labour plans for each mining licence
       • R145m paid to Rustenburg BEE structures & R64m to
                                                                                                            •   Employee voluntary contribution scheme
         employees via profit share scheme (ESOP) since acquisition
                                                                                                            •   Sponsorships to universities, bursaries and learnerships
       • R91m paid to Marikana empowerment structures & R521m paid to
         Marikana employees trust (ESOP) for 2020 year

                    Marikana Renewal
                                                                                                           Our contribution to the community has been through 80# Social and
                                                              District Development
                Programme – Towards 2022                               Model
                                                                                                           labour plan projects at SA PGM operations
                  LETSEMA ENGAGEMENT                            STAKEHOLDER
                                                                                                           Health sector
                        PROCESS                            COLLABORATIVE PROCESS                           ✓ We partnered with the North West province Department of Health to improve
                                                                                                             health services in the region through construction of clinics & forensic mortuary
      Our focus on honour, engage and create is delivered in partnership with                              ✓ Mobile clinics
      stakeholders to ensure:
      • Honor the legacy of Marikana and facilitate healing for families and the injured                   Education sector
      • Pursue justice and restitution for the affected and impacted                                       ✓ In partnership with NW Department of Basic Education we have rolled out our
      • Social redress though the delivery of social infrastructure that benefits                            Early Childhood Development Programme comprising upgrade of facilities,
         communities                                                                                         teacher training and learning infrastructure and material
      • Contribute to the District Development Model and promote the development                           ✓ We have constructed new schools and extensions of several schools
         of alternative economic streams in the region

Our mining
  Our      improves
      mining improveslives
                       lives
  •    As per Group Cash flow statement
  •    # Of which 55 project have been completed and 25 are in progress. Includes projects from Rustenburg, Kroondal and Marikana (various mining licences)                                  40
Conclusion
Richard Stewart, Chief Operating Officer
Key highlights |SA PGM operations

                                                    • Aligned to Group zero harm safety framework – notable safety milestones achieved
     Highest safety standards                       • ISO 45001 accreditation to be achieved during 2021 (Marikana already accredited)

                                                    • Significant cost and operational synergies realised through consolidation and integration – delivering
     Integrated, contiguous operations                sustainable value
                                                    • Potential for ongoing synergies – delivering real cost benefits (cross boundary mining, projects)

                                                    • Sizeable reserves and resources to support long operating long life >40 years and provide significant
     Long life assets with sizeable resources         optionality

     Processing capacity and optionality            • Competitive advantage from existing processing capability and capacity provides significant optionality

                                                    • Proactive stakeholder engagement with specific programmes to address regional legacy
     Extensive community and ESG programmes         • Path to carbon neutral
                                                    • Pragmatic approach to Environmental water management

                                                    • K4 project best project in industry with most of the upfront capital sunk
     World class, low risk Brownfields projects     • Klipfontein, low capital intensity with near term production – high return

                                                    • Leading position in PGM industry established through rapid execution of M&A
     Decisively executed growth strategy            • Payback on investment within 4 years ensures significant future value for all stakeholders

A sizeable, long life PGM mining and processing business, well positioned for ongoing creation of superior value for all stakeholders

                                                                                                                                                                42
Questions?

Contacts
James Wellsted/
Henrika Ninham/
Chris Law
ir@sibanyestillwater.com
Tel:
+27(0)83 453 4014/
+27(0)72 448 5910/
+44 (0)7923126200
Website: www.sibanyestillwater.com

Tickers: JSE: SSW and NYSE: SBSW

                                     43
SA PGM operations Investor day
Appendix
Competent persons’ declaration | SA PGM operations
Sibanye-Stillwater reports its Mineral Resources and Mineral Reserves in accordance with the SAMREC Code, the updated Section 12 of the JSE Listings Requirements; and
in consideration of the SEC Industry Guide 7, which is aligned with the guiding principles of SOX. Recent amendments adopted by the SEC to modernise the property
disclosure requirements for mining registrations, which has not come into effect fully yet, aligns closely with the requirements under the JSE and SAMREC, and any non-
compliance to SEC Industry Guide 7 is therefore considered immaterial. The Altar, Marathon and Rio Grande Mineral Resources were originally compiled under NI 43-101
guidelines but are deemed to be SAMREC compliant.

This Mineral Reserve and Mineral Resource declaration represents a condensed and consolidated summary of the full Sibanye-Stillwater Mineral Resource and Mineral
Reserve declaration available in the Group Mineral Resource and Mineral Reserve Report, which was published on 22 April 2021 and are available at
www.sibanyestillwater.com/news-investors/reports/annual/.

Guided by a commitment to best practice corporate governance, the statement has been reviewed and confirmed by each segment’s Technical Services.

The Mineral Resources and Mineral Reserves are estimates at a particular date, and are affected by fluctuations in mineral prices, the ZAR/US$ exchange rate, operating
costs, mining permits, changes in legislation and operating factors. Although all permits may not be finalised and in place at the time of reporting, there is no reason to
expect that these will not be granted.

All statement figures are operations managed by Sibanye-Stillwater with the exception of those for Mimosa, the attributable portion for DRDGOLD and the US Projects.
Mineral Resources are reported inclusive of Mineral Reserves, and production volumes are reported in metric tonnes (t).

The Southern African(SA) PGM operations statement are reported as 3E PGM + gold, which consists of platinum, palladium, rhodium and gold. The US operations are
reported as 2E PGM, which consist of platinum and palladium.

All financial models used to determine Mineral Reserves are based on current tax regulations at 31 December 2020. Rounding of figures may result in minor computational
discrepancies. Where this happens, it is not deemed significant.

For the Southern African PGM operations, the lead competent person designated in terms of the SAMREC Code, who takes responsibility for the consolidation and
reporting of the SA Platinum Operations Mineral Resources and Mineral Reserves, and for the overall regulatory compliance of these figures, is Andrew Brown, who gave
his consent for the disclosure of the 2020 Mineral Resources and Mineral Reserves Statement. Andrew [M.Sc Mining Eng] is registered with SAIMM (705060) and has 37 years’
experience relative to the type and style of mineral deposit under consideration. Andrew is a full-time, permanent employee of Sibanye-Stillwater.

                                                                                      https://www.sibanyestillwater.com/news-investors/reports/annual/2020/

                                                                                                                                                                          46
Price assumptions on reserves and resources
The Group complies with both the JSE and the US Securities and Exchange Commission (SEC) guidelines on commodity prices
used in the estimation of Mineral Reserves at all managed operations and projects. An average exchange rate of R15.00/US$
(2019: R14.50/US$) and the commodity prices illustrated below were used in the estimation process:

                                                                                     31 December 2020
Precious metals                                                          US$/oz                    R/oz                       R/kg
Gold                                                                      1,500                  22,500                     720,000
Platinum                                                                   880                   13,200                     424,389
Palladium                                                                 1,600                  24,000                     771,617
Rhodium                                                                   5,650                  84,750                2,724,772
Iridium                                                                   1,450                  21,750                     699,278
Ruthenium                                                                  260                    3,900                     125,388
Base metals                                                              US$/lb               US$/tonne                 R/tonne
Nickel                                                                     5.90                  13,000                     195,000
Copper                                                                     2.72                   6,000                      90,000
Cobalt                                                                    15.00                  33,069                     496,040
Uranium oxide (U3O8)¹                                                     32.00                  70,548                     960,000
Chromium oxide (Cr2O3)² ³                                                  0.07                     160                       2,400

1,2. Long term contract price
3.   42% concentrate                                                                                                                  47
Planned capital expenditure (including K4 and Mimosa)

                5,000

                4,500

                4,000

                3,500

                3,000
    R million

                2,500

                2,000

                1,500

                1,000

                  500

                     0
                                 2021          2022              2023              2024                 2025          2026            2027          2028           2029           2030

                Kroondal - SIB      Rustenburg - ORD       Rustenburg - SIB       Marikana - ORD          Marikana - SIB     Mimosa - SIB    K4 - ORD   K4 - SIB   K4 - TSF   K4 - Project

Long-life assets with potential to mining through boundaries

Note:
• Capital expenditure in 2021 real terms. SIB: Stay-in-business capital, ORD: Ore reserve development
• Assumed exchange rate for conversion of Mimosa capital expenditure: R15.00/US$
• Represents attributable capital from Mimosa and Kroondal
• Capital exclude unapproved projects under studies                                                                                                                                          48
Planned mining tonnes and costs

                             Mined production                                                                                                       Assumptions
                25,000,000                                                                                                        1,800             • Production profiles are based on
                                                                                                                                                      the 2020 LOM reserve and
                                                                                                                                                      resources strategic plan
                                                                                                                                  1,500
                20,000,000                                                                                                                          • K4 and Klipfontein projects
                                                                                                                                                      inclusion maintains lower cost
                                                                                                                                  1,200               profile
Tonnes milled

                15,000,000
                                                                                                                                                    • Labour cost estimated as per

                                                                                                                                          R/Tonne
                                                                                                                                  900                 wage agreement
                10,000,000                                                                                                                          • 3-year trailing prices are used to
                                                                                                                                  600                 estimate the by-product credits as
                                                                                                                                                      well as the royalty tax estimation
                 5,000,000
                                                                                                                                  300               • Above inflation NERSA guidance
                                                                                                                                                      are included for electricity

                        0                                                                                                         0                 • Marikana integration savings fully
                               2021      2022    2023        2024       2025       2026      2027      2028     2029     2030                         embedded
                                Mimosa      Marikana       Kroondal       Rustenburg        Operating Cost R/Tonne     AISC R/Tonne                 • Fit for growth procurement savings
                                                                                                                                                      included in contracts and stores

         Note:
         • Assumes 50% of Mimosa and Kroondal tonnes milled
         • Costs are represented at 2021 real terms
         • Assumed exchange rate for conversion of Mimosa capital expenditure: R15.00/US$                                                                                                49
Surface sources – planned tonnes and cost

                             Surface operations                                                                                               •   Including Marikana BTT,
                                                                                                                                                  Rustenburg WLTR and Platinum
                25,000,000                                                                                                    140
                                                                                                                                                  Mile

                                                                                                                              120             •   Surface Tailings retreatment
                20,000,000                                                                                                                        reserves running out in 2027
                                                                                                                              100
                                                                                                                                              •   Platinum Mile (holding
                15,000,000                                                                                                                        increased from 97.1% to 100%
Tonnes milled

                                                                                                                              80
                                                                                                                                                  in H1 2021)fully integrated into

                                                                                                                                    R/Tonne
                                                                                                                                                  Sibanye Group
                                                                                                                              60
                10,000,000
                                                                                                                                              •   Assessment of BTT
                                                                                                                              40
                                                                                                                                                  opportunity and WLTRP
                                                                                                                                                  treatment of Marikana tailings
                 5,000,000                                                                                                                        could extend LOM up to 20
                                                                                                                              20
                                                                                                                                                  years

                        0                                                                                                     0               •   Average operating cost of
                                 2021           2022          2023          2024        2025            2026           2027                       about R110/tonne milled
                                Rustenburg         Marikana      Platmile      Operating Cost R/Tonne          AISC R/Tonne

         Note: Costs are represented at 2021 real terms                                                                                                                          50
Kroondal – planned ounces and cost

                    Kroondal operations                                                                                                    •   Opportunity to extend life
                                                                                                                                               beyond current plan by mining
          250,000                                                                                                      20,000
                                                                                                                                               a cross boundary into
                                                                                                                                               Rustenburg Resource

          200,000                                                                                                      16,000              •   Kroondal low-cost mechanised
                                                                                                                                               operation and would
                                                                                                                                               significantly bring forward
          150,000                                                                                                      12,000                  value of Rustenburg resources

                                                                                                                                R/ ounce
 Ounces

          100,000                                                                                                      8,000

           50,000                                                                                                      4,000

               0                                                                                                       0
                      2021       2022      2023        2024        2025        2026    2027   2028     2029     2030

                       Simunye          Kopaneng         K6         Kwezi         Bambanani   Operating Cost R/4Eoz    AISC R/4Eoz

Efficient low cost operations, with consolidation upside

Note: Represent attributable ounces (50%). Costs are represented at 2021 real terms                                                                                       51
Kroondal – planned tonnes and cost

                            Kroondal operations
                4,000,000                                                                                              1,200

                3,500,000
                                                                                                                       1,000

                3,000,000

                                                                                                                       800
                2,500,000
Tonnes milled

                                                                                                                               R/tonne
                2,000,000                                                                                              600

                1,500,000
                                                                                                                       400

                1,000,000

                                                                                                                       200
                 500,000

                       0                                                                                               0
                              2021       2022   2023   2024      2025     2026      2027    2028      2029     2030

                               Simunye      Kopaneng   K6     Kwezi     Bambanani     Operating Cost R/Tonne    AISC R/Tonne

   Efficient low cost operations, with consolidation upside

   Note: Costs are represented at 2021 real terms                                                                                        52
Rustenburg – planned ounces and cost

                    Rustenburg operations                                                                                                                         •   Long life operation- stable
          800,000                                                                                                                             18,000
                                                                                                                                                                      production to 2026

                                                                                                                                              15,000

          600,000

                                                                                                                                              12,000

                                                                                                                                                       R/ ounce
 Ounces

          400,000                                                                                                                             9,000

                                                                                                                                              6,000

          200,000

                                                                                                                                              3,000

               0                                                                                                                              0
                      2021      2022        2023        2024         2025        2026         2027        2028         2029        2030

                       Siphumelele       Bathopele          Khuseleka         Thembelani          Operating Cost R/4Eoz             AISC R/4Eoz

Long-life assets

Note: Costs are represented at 2021 real terms, LOM cost profile remain stable as the expensive operations are mine out. In line with the right sizing strategy, unit cost are expected to remain constant   53
Rustenburg – planned tonnes and cost

                            Rustenburg operations
                8,000,000                                                                                                 1,800

                                                                                                                          1,500

                6,000,000

                                                                                                                          1,200
Tonnes milled

                                                                                                                                  R/tonne
                4,000,000                                                                                                 900

                                                                                                                          600

                2,000,000

                                                                                                                          300

                       0                                                                                                  0
                              2021     2022     2023      2024    2025     2026       2027    2028      2029      2030

                               Siphumelele    Bathopele     Khuseleka    Thembelani      Operating Cost R/Tonne     AISC R/Tonne

   Long-life assets

   Note: Costs are represented at 2021 real terms                                                                                           54
Marikana – planned ounces and cost

                       Marikana operations                                                                                                   •   High quality operations with
                                                                                                                                                 significant optionality
             900,000                                                                                                     25,000

                                                                                                                                             •   K4 adding to production profile
                                                                                                                                                 until 2026
                                                                                                                         20,000
                                                                                                                                             •   Lower cost K4 to benefit
             600,000                                                                                                                             operating cost and AISC
                                                                                                                         15,000
 4E ounces

                                                                                                                                  R/ ounce
                                                                                                                         10,000
             300,000

                                                                                                                         5,000

                  0                                                                                                      0
                         2021    2022       2023        2024    2025     2026     2027      2028        2029    2030

                          K4    4B      East 3     K3      Rowland     Saffy    Operating Cost R/4Eoz      AISC R/4Eoz

High quality mine-to-market operation

Note: Costs are represented at 2021 real terms                                                                                                                                  55
Marikana – planned tonnes and cost

                            Marikana operations
                8,000,000                                                                                           2,100

                                                                                                                    1,800

                6,000,000
                                                                                                                    1,500
Tonnes milled

                                                                                                                    1,200

                                                                                                                            R/tonne
                4,000,000
                                                                                                                    900

                                                                                                                    600
                2,000,000

                                                                                                                    300

                       0                                                                                            0
                              2021    2022    2023    2024    2025     2026      2027    2028     2029       2030

                               K4    4B      East 3   K3     Rowland     Saffy      Operating Cost R/Tonne      AISC R/Tonne

   High quality mine-to-market operation

   Note: Costs are represented at 2021 real terms                                                                                     56
Mimosa – planned ounces and cost

                       Mimosa operations                                                                                           Steady, consistent production and
                                                                                                                                   cost forecast
             140,000                                                                                             16,000

             120,000

                                                                                                                 12,000
             100,000

              80,000
 4E ounces

                                                                                                                          R/4Eoz
                                                                                                                 8,000
              60,000

              40,000
                                                                                                                 4,000

              20,000

                  0                                                                                              0
                         2021     2022     2023        2024     2025      2026    2027      2028   2029   2030

                          Tons Processed         Operating Cost R/Tonne      AISC R/Tonne

Consistent delivery

Note: Costs are represented at 2021 real terms                                                                                                                    57
Mimosa – planned tonnes and cost

                            Mimosa operations
                1,600,000                                                                                       1,400

                                                                                                                1,200

                1,200,000
                                                                                                                1,000
Tonnes milled

                                                                                                                800

                                                                                                                        R/Tonne
                 800,000
                                                                                                                600

                                                                                                                400
                 400,000

                                                                                                                200

                       0                                                                                        0
                              2021     2022     2023     2024     2025       2026   2027   2028   2029   2030

                               Tons Processed       Operating Cost R/Tonne

   Consistent delivery

   Note: Costs are represented at 2021 real terms                                                                                 58
Surface operations – from mine-to-market

• Enhance and optimise surface operations
  - Augment future life of surface operations (WLTR / PlatMile / BTT / ETTP, etc.)1,
    beyond 2025
  - Innovate and implement new technologies where required
  - Testing flotation technology to recover the ultrafine chrome in current tailings
    horizons and dormant tailings dams.

  - Tailings deposition
  - Strategic review of the tailing deposition across SA PGM segment,
    incorporating K4 and surface retreatment opportunities has been                                 • 12 active tailings dams and 8 dormant tailings dams
    completed,
  - Marikana tailings deposition constraints have been eradicated

• Embed ESG excellence
  - Footprint reduction by depositing current tailings into a mega in-pit tailings
    facility
  - Land available for agriculture / business usage / housing post rehabilitation
  - Reducing future environmental liabilities

A competitive advantage and strategic differentiator - provides significant optionality
 1. WLTR: Western Limb Tailings Retreatment; Platinum Mile; Bulk Tailings Treatment, Eastern Tailings Treatment Plant
                                                                                                                                                            59
Other by-products we mine | SA PGM operations

                              Copper           Nickel       Iridium   Ruthenium         Cobalt          Cr2O3
            Mine           % per tonne   % per tonne    % of 6E g/t   % of 6E g/t   % per tonne   % per tonne
UG2         Bathopele            0.008         0.089         3.773        19.041          0.062        19.851
            Khuseleka            0.008         0.112         4.054        14.525          0.059        24.420
            Thembelani           0.009         0.114         3.336        15.609          0.072        23.472
            Kwezi                0.014         0.109         4.317        14.695          0.064        15.100
            K6                   0.014         0.083         3.212        14.638          0.061        14.265
            Kopaneng             0.012         0.071         3.311        14.664          0.040        14.943
            Simunye              0.004         0.093         3.837        13.644          0.054        15.314
            Bambanani            0.006         0.070         3.463        10.957          0.042        15.002
            4B                   0.008         0.030         3.640        15.410                       18.239
            K3                   0.009         0.033         3.366        14.426                       16.828
            K4                   0.011         0.039         3.553        14.863                       19.302
            Rowland              0.009         0.028         3.628        15.675                       20.069
            Saffy                0.008         0.031         3.627        16.069                       21.367
            E3                   0.007         0.031         3.752        15.670                       21.025

                                                                                                            60
Other by-products we mine | SA PGM operations

                              Copper           Nickel       Iridium   Ruthenium         Cobalt          Cr2O3
            Mine           % per tonne   % per tonne    % of 6E g/t   % of 6E g/t   % per tonne   % per tonne
Merensky    Khuseleka            0.089         0.194         1.529         7.902                        0.686
            Thembelani           0.089         0.219         1.620         7.772                        0.261
            Siphumelele          0.101         0.218         1.950         7.689                        0.421
            4B                   0.076         0.140         1.048         6.034                        0.364
            K3                   0.089         0.175         1.240         6.899                        0.502
            K4                   0.086         0.157         1.358         7.305                        0.551
            Rowland              0.076         0.135         1.034         5.774                        0.381

                                                                                                            61
Prill splits by reef type

                                                             Marikana                      Rustenburg              Kroondal              Mimosa

                                              Merensky reef             UG2 reef   Merensky reef        UG2 reef       UG2 reef      Main sulphide zone

4E g/t                                                      4,16            4,02            4,83            3,68              2,57                 3,45

Pt %                                                       61,85           59,38           63,80           54,53          54,94                   49,35

Pd %                                                       27,81           28,87           27,30           34,31          33,95                   38,47

Rh %                                                        3,31           11,18            3,99           10,43          10,38                    4,20

Au %                                                        7,02            0,57            4,92            0,72              0,72                 7,97

Chrome %                                                       –           19,45               -           21,88          13,95                       -

Basket prices spot (R/4E oz)*                             30,895         51,440           32,360          50,761         50,541                  35,934

MR grades higher but UG2 currently benefitting from high Pd and Rh prices and Cr credits
Source: Company information
Prices as at 9am on 11 August, exchange rate US$/R14.81                                                                                               62
Kroondal costs are well controlled

                       AISC excluding By-product credits R/4E ounce                                                                                                               • Trackless mining – on reef
                                                                                                                                                                                    development expensed
              18,000                                                                                                                            50,000
                                                                                                                                                                                  • Three-year wage contract in
                                                                                                                                                                                    place until June 2020
              15,000
                                                                                                                                                40,000

                                                                                                                                                         Average month 4E ounce
              12,000
                                                                                                                                                30,000
 R/4E ounce

               9,000

                                                                                                                                                20,000
               6,000

                                                                                                                                                10,000
               3,000

                  0                                                                                                                             0
                          FY2015       FY2016            FY2017            FY2018            FY2019            FY2020        FY2021 - HY1

                          Operating Cost         SIB Capital           Other Cost            Royalty Tax            PGM 4E Ounce

Cost awareness culture entrenched
* 50% pool and share agreement with Anglo American Platinum
** All-in sustaining cost (AISC) is calculated by including cost of sales before amortisation and depreciation, royalties, community costs, share-based payments,
   rehabilitation interest and amortisation, ore reserve development, sustaining capital expenditure and less by-product credits                                                                                  63
Rustenburg benefits from integration synergies

                          AISC excluding By-product credits R/4E ounce                                                                                                                • Integration synergies and
                                                                                                                                                                                        savings have made Rustenburg
                 25,000                                                                                                                               80,000
                                                                                                                                                                                        operations sustainable
                                                                                                                                                                                      • Ore reserve development
                                                                                                                                                                                        capital aimed at maintaining
                 20,000
                                                                                                                                                                                        the current level of production
                                                                                                                                                      60,000
                                                                                                                                                                                        at the conventional shafts

                                                                                                                                                               Average monthly 4Eoz
                                                                                                                                                                                      • Change from POC To toll
                 15,000                                                                                                                                                                 processing in 2019 resulted in
    R/4E ounce

                                                                                                                                                                                        increase in costs, but delivered
                                                                                                                                                      40,000
                                                                                                                                                                                        significant profitability gains
                 10,000

                                                                                                                                                      20,000
                  5,000

                     0                                                                                                                                0
                              FY2016             FY2017               FY2018               FY2019               FY2020            FY2021 - HY1

                             Operating Cost       Toll Charges         ORD        Sustaining        Royalty Tax        Other Cost         PGM 4E Ounce

Profitable long life operations
*        All-in sustaining cost (AISC) is calculated by including cost of sales before amortisation and depreciation, royalties, community costs, share-based payments,
         rehabilitation interest and amortisation, ore reserve development, sustaining capital expenditure and less by-product credits                                                                                64
Mimosa is a consistent cost performer

                       AISC excluding By-product credits R/4E ounce                                                                                                            • Stay-in-business capital is
                                                                                                                                                                                 inclusive of on-reef
              21,000                                                                                                                           25,000
                                                                                                                                                                                 development

              18,000
                                                                                                                                               20,000

              15,000

                                                                                                                                                        Average monthly 4Eoz
                                                                                                                                               15,000
 R/4E ounce

              12,000

               9,000
                                                                                                                                               10,000

               6,000

                                                                                                                                               5,000
               3,000

                  0                                                                                                                            0
                          FY2015       FY2016           FY2017            FY2018            FY2019            FY2020         FY2021 - HY1

                          Operating Cost        SIB Capital          Other Cost            Royalty Tax           PGM 4E Ounce

Regularly contributing dividends
Note: Mimosa is a 50:50 joint venture with Implats
* All-in sustaining cost (AISC) is calculated by including cost of sales before amortisation and depreciation, royalties, community costs, share-based payments,
  rehabilitation interest and amortisation, ore reserve development, sustaining capital expenditure and less by-product credits                                                                                65
You can also read