Russia-Ukraine War Report Card - Graham Allison Kate Davidson - DISCUSSION PAPER - Belfer Center
←
→
Page content transcription
If your browser does not render page correctly, please read the page content below

AV O I D I N G G R E AT P O W E R WA R P R O J E C T

Russia-Ukraine
War Report Card
Graham Allison
Kate Davidson

                                                       D I S C U S S I O N PA P E R
                                                           FEBRUARY 2023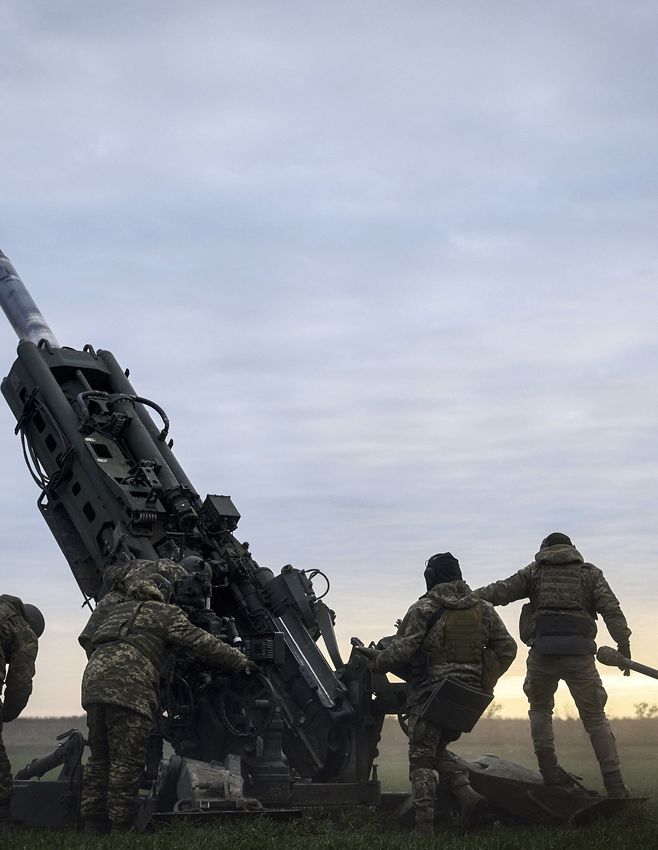
Avoiding Great Power War Project
Belfer Center for Science and International Affairs
Harvard Kennedy School
79 JFK Street
Cambridge, MA 02138

www.belfercenter.org

Statements and views expressed in this report are solely those of the author(s) and do not imply

endorsement by Harvard University, Harvard Kennedy School, or the Belfer Center for Science and

International Affairs.

Copyright 2023, President and Fellows of Harvard College
AV O I D I N G G R E AT P O W E R WA R P R O J E C T

Russia-Ukraine
War Report Card
Graham Allison
Kate Davidson

                                                       D I S C U S S I O N PA P E R
                                                           FEBRUARY 2023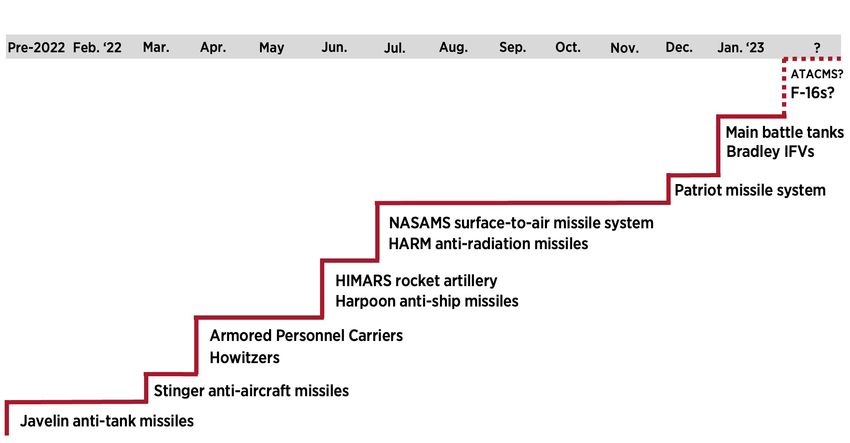
The Avoiding Great Power
     War Project
     The Avoiding Great Power War Project is an interdisciplinary effort to investigate,
     analyze, and produce policy-relevant research on great power relations. Directed
     by Graham Allison, the Douglas Dillon Professor of Government at the Harvard
     Kennedy School, the project builds upon a basic premise: the historical record of
     great power conflict can serve as an aid to understanding the dynamics between
     today’s great powers, namely the United States, Russia, and China.

ii   Russia-Ukraine War Report Card
About the Authors
Graham Allison is the Douglas Dillon Professor of Government at the Harvard
Kennedy School, where he was the founding dean. He is a former U.S. assistant
defense secretary, former director of Harvard’s Belfer Center for Science and
International Affairs, and the author most recently of the international bestseller
Destined for War: Can America and China Escape Thucydides’s Trap?
Kate Davidson is a Research Assistant at the Belfer Center for Science and
International Affairs, where she works on the Avoiding Great Power War Project.
Her work focuses on Russia and the Russia-Ukraine War, and she is the Principal
RA on the Belfer Russia-Ukraine War Task Force.
Acknowledgments
We would like to thank the members of the Harvard Russia Small Group, includ-
ing Amos Yadlin and Evan Sankey, each of whose comments substantially
improved the Report Card. None of them is responsible for the final product, and
any errors or misjudgments are the responsibility of the authors.
Belfer Center for Science and International Affairs | Harvard Kennedy School iiiTable of Contents
Introduction …………………………………………………………………………………… 1
Report Card ……………………………………………………………………………………. 4
The Russia-Ukraine War in Historical Perspective………………………………13
Conclusion ……………………………………………………………………………………. 16
Appendix .................................................................................................... 18
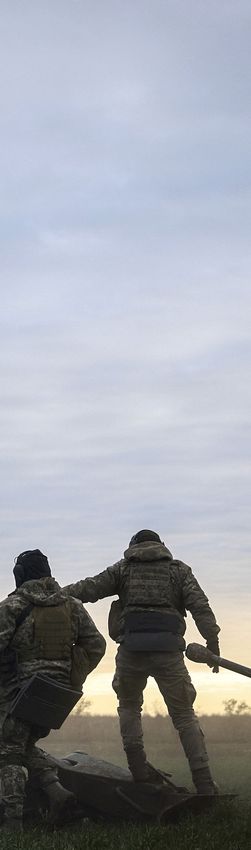
Belfer Center for Science and International Affairs | Harvard Kennedy School vFILE - Ukrainian soldiers prepare a U.S.-supplied M777 howitzer to fire at Russian
positions in Kherson region, Ukraine, Jan. 9, 2023. (AP Photo/Libkos, File)
vi Russia-Ukraine War Report CardIntroduction One year into the Russia-Ukraine War, it remains difficult to get an accurate picture of what is actually happening. In part, this is the fog of war. In part, it is a reminder of Churchill’s observation that truth is the first casualty of war. In part, it reflects the extraordinary success of President Zelenskyy and his team in taking information warfare to the next level—crafting compelling daily narratives and controlling the flow of information: for example, withholding data about Ukrainian casualties. And finally, because most reporting on the war is done by journalists working at a distance rather than on the battlefield, news reports reflect prevailing narratives more than numbers. Belfer Center for Science and International Affairs | Harvard Kennedy School 1
On February 24, 2022, Russia began a multi-pronged invasion of Ukraine aimed
    at seizing Kyiv, capturing or killing Zelenskyy, and seizing eastern Ukraine in time
    for a May Day victory celebration. Remarkably, Zelenskyy courageously rallied his
    fellow Ukrainian citizens and soldiers to resist the invaders and remind the world
    what leadership under fire looks like. After Russia’s initial invasion of Ukraine
    stalled, its forces pivoted to the battleground in the Donbas. In September, Russian
    President Vladimir Putin annexed four eastern provinces of Ukraine and declared
    that Russia would use its nuclear arsenal if necessary to defend this territory along
    with the rest of Mother Russia. Ukraine’s September counteroffensive pushed
    Russian forces back in the north and retook a regional capital, Kherson, but it has
    stalled since mid-November.

    As professional analysts trying to make sense of what we are seeing, we begin by
    reciting what we most confidently know: namely, the fundamental truths about
    war that have been learned over centuries of experience. In the past year, it has
    been vital to keep in mind one axiom that has become a cliché: the fog of war is
    dense and thickened by disinformation and propaganda.1 To ensure we have our
    feet on a solid foundation as we try to interpret the latest news from Ukraine, we
    created a weekly Report Card.

    The bottom line in our inaugural Report Card is that the war has now bogged
    down in what we have labeled a “snailmate.” Since early November, neither side
    has made significant advances. But at the end of the first year of war, Russia con-
    trols 18% of Ukraine, and intense fighting for advances of a few miles continues to
    claim hundreds of lives a day.

    1   See Graham Allison and Amos Yadlin, “Piercing the Fog of War: What Is Really Happening in Ukraine?”
        The National Interest, March 24, 2022.

2   Russia-Ukraine War Report Card
In addition, our report provides graphics that answer four frequently
asked questions.
• How long is war? One year on, the Russia-Ukraine War remains much
shorter than major historical conflicts, but it is already longer than its
predecessor conflict in the Donbas and Crimea in 2014, which entered
a lower intensity phase at the beginning of 2015 after Minsk II and the
fall of Debaltseve.
• How deadly is war? The death toll in the first year of this war numbers over
100,000–making it far deadlier than other post-Cold War conflicts but still
much less lethal than the World Wars.
• How expensive is war? As a percentage of its GDP, Ukraine’s expenditure
is about equivalent to the US war effort during World War II, essentially
mobilizing all of society, and with unprecedented levels of foreign
assistance.
• How has the lethality of Western supply of arms risen? The US and its
NATO partners have steadily stepped up the escalation ladder in sending
more advanced weapons to Ukraine, expressing concern at each step about
the possibility of provoking a Russian response that would widen the war,
but nonetheless repeatedly crossing previously-announced red lines.
Belfer Center for Science and International Affairs | Harvard Kennedy School 3Report Card
To help clarify the situation on the ground, the Belfer Russia-Ukraine War Task
Force created a Report Card of key indicators drawn from the best public sources.
It will be updated weekly and posted on the Russia Matters website. We are acutely
aware that this is at best a work in progress that has many limitations. Nonetheless,
we are publishing it at this point in the hope of soliciting—or even provoking—
suggestions for improvement.
The Report Card tracks eight indicators: territorial change (including maps),
military casualties, civilian fatalities, military equipment losses, civilian displace-
ment, economic disruption, infrastructure damage, and popular support. For each
of these we have been able to find quantifiable indicators that, despite their limits,
provide insight into the impact of the war on Russia and Ukraine. We have also
listed a number of valuable indicators that we would like to include if we could
find reliable public data.
This Report Card does not include multiple factors that are essential in assessing
the state of the war, but about which we have been unable to find reliable data.
Many of Ukraine’s advantages are evident but more difficult to quantify, including
morale, military leadership, and dominance in the information war. Moreover,
the fact that Russia’s tactical success on the battlefield now leaves it in control of
11% more of Ukrainian territory should not obscure the fact that on the larger
international chessboard, Putin’s invasion of Ukraine has been a colossal strategic
blunder. Putin’s greatest successes have come in achieving the opposite of what he
intended. Rather than erasing Ukraine from the map he has strengthened Ukrai-
nians’ sense of their own identity and made Ukraine an inspiration to the world.
Rather than undermine NATO, he has revitalized its sense of mission and deter-
mination to build military capabilities to deter or defeat any future threats from
Russia. Rather than undermining the Transatlantic Alliance, he provoked a US-led
Western response that has made it stronger than it had been since the high Cold
War. Europe’s choice to end its dependence on Russian oil and gas has not only
forced Russia to search for new markets where they have had to sell their products
at a discount, but has eliminated Russia’s geopolitical leverage that European de-
pendence once provided. The Russian government has managed to cope with the
shorter-term impact of unprecedented sanctions, but over the long run, Russia will
4 Russia-Ukraine War Report Cardbe poorer than it would have been. And rather than commanding the respect
he personally craves, Putin has made himself a pariah in the West—the face of
evil that he really is.
Sources for the data reported here include Russia Matters, the Institute for the
Study of War, Oryx, the United Nations, the International Monetary Fund,
official statements from the US, UK, Ukrainian, and Russian governments,
and other public reporting (see appendix for full list). The Report Card maps
of territorial change, updated weekly, provide a snapshot of the battlefield. A
color-coded dashboard allows easy side-by-side comparison of the indicators.
Green represents relative strength, red represents weakness, and yellow
represents a tie or inability to accurately assess.
Tracking these key indicators helps illuminate incandescent facts about
developments in the war on the ground in the past year. Five numbers in
particular shed light on the outcomes and cost of one year of war in Ukraine.
1. 11% more of Ukraine’s sovereign territory has been seized by Russia since
the invasion (7% of Ukraine was under Russian control before 2022, in
Crimea and Donbas)
2. More than 200,000 combatant and 19,000 civilian casualties (killed or
severely wounded)
3. 31% of Ukrainians have been displaced from their homes
4. 35% is the amount Ukraine’s GDP has fallen since the invasion
5. 40% of Ukraine’s electricity infrastructure has been destroyed or occupied
Belfer Center for Science and International Affairs | Harvard Kennedy School 5Russia-Ukraine War Report Card:
Who’s Winning and Who’s Losing What?
2/13/2023
Territorial Control
Control today: February 13, 2023
Belarus
Belgorod Russia
Kyiv
Dnipro River
Bakhmut
Zaporizhzhia
Rostov
Ukraine on Don
Kherson Mariupol
Melitopol
Azov Sea
Moldova Odesa
Krasnodar
Black Sea
Russian advance since 2/2022
Ukrainian recapture 2/24-8/29
Ukrainian recapture post 8/29
0 60 miles 120 miles Russian control before
February 2022
Border of Donetsk Oblast
Source: adapted from Institute for the Study of War Intense fighting
6 Russia-Ukraine War Report CardFront line in Donbas 2/13
Russia
Kharkiv
Luhansk
Slovyansk
Kramatorsk
Bakhmut
Ukraine
Donetsk
Rostov on
Don
Mariupol
Russian advance since 2/2022
Ukrainian recapture 2/24-8/29
Ukrainian recapture post 8/29
Russian control before
0 30 miles 60 miles
February 2022
Border of Donetsk Oblast
Source: adapted from Institute for the Study of War Intense fighting
Snailmate since November 11
Russia
Kharkiv
Ukraine
Slovyansk
Kramatorsk
Bakhmut
Russian control before 11/11/22
Russian advance since 11/11//22
0 15 miles 30 miles Ukrainian control before 11/11/22
Ukrainian advance since 11/11/22
Source: adapted from Institute for the Study of War Intense fighting
Belfer Center for Science and International Affairs | Harvard Kennedy School 7Report Card*
Change in control of Ukrainian territory
Since February 24:
• Russia: +25,000 square miles. 11% of Ukraine. Area equivalent to
Massachusetts, New Hampshire, and Connecticut combined.
• Ukraine: 0. Ukraine has not taken any territory controlled by
Russia before the 2022 invasion.
Since August 29 Ukrainian counteroffensive: Ukraine +6,850 square miles. 3% of Ukraine.
Area equivalent to Connecticut and Rhode Island combined.
• Russia: +150 square miles.
• Ukraine: +7,000 square miles.
In past month: Russia +74 square miles.
• Russia: +82 square miles.
• Ukraine: +8 square miles.
In past week: Russia +12 square miles.
• Russia: +16 square miles.
• Ukraine: +4 square miles.
Total territory occupied by Russia at some point
since February 24: 54,000 square miles.
Total territory reclaimed by Ukraine since February 24: 29,000 square miles. 54% of total
territory occupied by Russia.
Currently occupied by Russia: 25,000 square miles.
8 Russia-Ukraine War Report CardMilitary casualties
Russia: 130,000+ killed and severely wounded.
Ukraine: 130,000+ killed and severely wounded.
Civilian fatalities
Russia: 25 killed.
Ukraine: 7,199 killed.
• 2/1-2/12: 59 killed.
Military vehicles and equipment
Russia: 9,224 lost.
• Tanks and armored vehicles: 4,914.
• Military aircraft: 148.
• Naval vessels: 12.
Ukraine: 2,887 lost.
• Tanks and armored vehicles: 1,485.
• Military aircraft: 86.
• Naval vessels: 25.
Belfer Center for Science and International Affairs | Harvard Kennedy School 9Citizens displaced
Russia: 8
00,000 emigrated for economic or political reasons, 0.6% of Russian population.
Ukraine: 1 3.4 million displaced Ukrainians, 31% of Ukrainian pre-invasion population
of 44 million.
• Internally displaced: 5.4 million.
• International refugees: 8 million.
Economic impact
Russia: -2.3% GDP growth for 2022
• 0.3% GDP growth forecast for 2023.
• Russian Ruble: 0.014 US dollars. +14% since invasion.
• 3-year bond yield: 8.8%
Ukraine: -35% GDP growth for 2022
• 1% GDP growth forecast for 2023.
• Ukrainian Hryvnia: 0.027 US dollars. -18% since invasion.
• 3-year bond yield: 27%.
Infrastructure
Russia: No significant damage except Kerch Strait Bridge, under repair but open to
two-way traffic.
Ukraine: 40%, or 22.5 out of 56 GW electricity generating capacity destroyed or occupied.
10 Russia-Ukraine War Report CardPopular support
Russia: 41% support continued fighting over negotiations.
Ukraine: 70% support continued fighting over negotiations.
Other criteria which may be even more important (about
which we continue to search for reliable indicators)
Ammunition supply
Foreign military aid
Force generation
Military leadership
Training
Morale
Control of strategic locations
Information war: with US/Europe; with world
* Due to a lack of reliable indicators, our report card does not include multiple factors which may be
more important to assessing success and offensive potential. Several ways in which Ukraine likely
has an advantage are difficult to quantify, such as foreign military aid, morale, military leadership,
and information war, while Russian strengths like concrete territorial control are easier. The available
quantitative data paints a picture more favorable to Russia than the reality. It is therefore important to
keep in mind what is not included when interpreting the numbers that are.
Belfer Center for Science and International Affairs | Harvard Kennedy School 11R u ssia- Ukrain e W ar R eport C ard R u ssia Ukrain e
T erritory % %
Change since February 24 Russian invasion 25,000 sq. mi. 11% 0 sq. mi. 0%
Change since August 29 Ukrainian counteroffensive 150 sq. mi. 0% 7,000 sq. mi. 3%
Change in past month 82 sq. mi. 0% 8 sq. mi. 0%
Change in past week 16 sq. mi. 0% 4 sq. mi. 0%
Control of all territory disputed since February 24* 25,000 sq. mi. 46% 29,000 sq. mi. 54%
Military
Military killed and severely wounded** 130,000 0.3% 130,000 1.0%
Military equipment losses 9,224 2,887
Tanks and armored vehicles 4,914 28% 1,485 39%
Military Aircraft 148 7% 86 39%
Naval Vessels 12 5% 25 63%
E c o n o mi c
GDP decline since February 24 -2.3% -35%
2023 projected GDP growth 0.3% 1%
Exchange rate to USD since February 24*** 0.014 14% 0.027 -18%
3-year bond yield 8.8% 27%
Electrical grid damage**** 40%
C ivilian
Civilian fatalities 25 7,199
Civilian displacement***** 800,000 0.6% 13,406,000 31%
Popular support for continuing war 41% 70%
* Current status of all territory occupied by Russia at some point since February 24
** % out of male population 20-64.
*** Ukrainian Hryvnia using fixed exchange rate.
**** For Russia, no significant infrastructure damage other than Kerch Strait Bridge, under repair but
open to two-way traffic.
***** In Russia, largely political refugees, economic emigres, and men fleeing draft.
Popu lar su pport for R u ssia- Ukrain e W ar R u ssia Ukrain e US German y UK Polan d In dia
Support continuing war 41% 70%
Support maintaining or increasing Western aid 60% 62% 68% 72% 53%
12 Russia-Ukraine War Report CardThe Russia-Ukraine War in
Historical Perspective
Four Charts Ask:
1. How long is war?
2. How deadly is war?
3. How expensive is war?
4. And how rapidly does the supply of arms go up the escalation ladder?
At the one-year mark, this war is already one of the most consequential conflicts
of the 21st century on a number of metrics including loss of lives and expenditure
of resources. The following charts illustrate how the Russia-Ukraine War compares
to previous wars.
How Long Is War?
Average Interstate War (1816-2007)
2022 Russia-Ukraine War
2014 Invasion of Donbas/Crimea
2003 US Invasion of Iraq
2001 US War in Afghanistan
Soviet-Afghan War
WWII
WWI
0 1,000 2,000 3,000 4,000 5,000 6,000 7,000 8,000
Days
Source: Correlates of War Project and press reports
While the average interstate war lasts less than two years, major Russian and US
wars since WWII have lasted over a decade, suggesting that the Russia-Ukraine
War could last for many more years.2
2 “ Of 88 wars between states since 1816, nearly a quarter lasted less than two months and 38% between two and six
months. Of the remaining 35, 12 were over within a further six months, seven lasted up to two years, 12 two to five years,
and four more than five years. In other words, a war that continues for six months has a roughly one-in-three chance of
lasting no longer than a year in total, but an equal chance of lasting between two and five years. We should not forget
the Korean War, the first “hot” war of Cold War I, which lasted three years and did not end with a conclusive peace
agreement—merely an armistice.” Niall Ferguson, “War and Economics in Ukraine,” Stanford Hoover Institution, 9/21/22.
Belfer Center for Science and International Affairs | Harvard Kennedy School 13How Deadly Is War?
Wars by Average Annual Battle Deaths Compared to the World Wars
120,000 3,500,000
100,000 3,000,000
2,500,000
80,000
2,000,000
60,000
1,500,000
40,000
1,000,000
20,000
500,000
0
2022 Russia- 2014 Invasion 2003 US 2001 US War Soviet-Afghan 0
Ukraine War of Donbas Invasion of in Afghanistan War 2022 Russia- WWII WWI
Iraq Ukraine War
Source: Belfer Center estimate and press reports
The Russia-Ukraine War is the deadliest conflict of the 21st century. Thankfully,
however, the Russia-Ukraine War is far less deadly on an annualized basis than ei-
ther World War I or World War II. Our estimate of battle deaths in Ukraine draws
on many sources, including official statements from the US, Ukrainian, and Rus-
sian governments, as well as UN counts of civilian fatalities and expert estimates of
killed-to-wounded ratios in Ukraine.
How Expensive Is War?
Defense Spending as % of GDP
45.0%
40.0%
35.0%
30.0%
25.0%
20.0%
15.0%
10.0%
5.0%
0.0%
2022 Russia-Ukraine 2014 Invasion of 2003 US Invasion of 2001 US War in Soviet-Afghan War WWII WWI
War Donbas/Crimea Iraq Afghanistan
US Russia/USSR Ukraine
Source: Congressional Research Services and press reports
14 Russia-Ukraine War Report CardAs a proxy for an itemization of specific costs of the Russia-Ukraine War,
comparing defense budgets as a percentage of GDP provides some perspective.
Ukrainian defense spending as a percentage of GDP is eight times higher than
it was during the 2014 annexation of Crimea and invasion of the Donbas, and
much higher than US and Russian spending in wars since WWII.
Western Arms – Escalation Ladder
Source: press reports
The US, UK, and other Western allies of Ukraine have steadily climbed the
escalation ladder by sending ever more powerful weapons systems to Ukraine.
Before taking each step up the ladder, Western suppliers have worried about
the risk of provoking a Russian escalatory response. Nonetheless, as the war
has ground on, steps up the escalator continue.
Belfer Center for Science and International Affairs | Harvard Kennedy School 15Conclusion
Our Report Card is intended to provide concrete indicators to anchor interpretation
of news reports and leaders’ statements. For example, multiple media outlets
have claimed that a retreat from Bakhmut would signal that Ukraine is losing
the initiative after four months of steady advances. Looking at the numbers, it is
clear that Ukraine’s counteroffensive lost momentum following the November 11
liberation of Kherson.
As we approach February 24, it is valuable to take a step back to see the big pic-
ture. Russia now controls 18% of Ukraine’s internationally-recognized territory,
including Crimea. Brave Ukrainian resistance against Russian aggression stopped
the Russian advance on Kyiv and drove Russia out of another 12% of Ukraine, but
Ukraine’s counteroffensive slowed as Russian positions became more entrenched.
One third of Ukrainians have been displaced by war, many thousands have died,
and the economy has shrunk by 35% in 2022.
The outcome of the Russia-Ukraine War remains uncertain and there is no clear
path to peace. Ukraine’s place on the map of Europe in 2030, however, will be
shaped by a score of factors more important than where the fighting stopped—
whether at the current line, or after Ukraine has liberated the territory Russia
seized since February 24, or after Putin’s troops have control of the remainder of
Donbas. Ukrainians will not give up their claim to liberate every inch of Ukrainian
territory—nor should they. No one can doubt that Ukraine has defeated Putin’s
attempt to erase it from the map, and that the costs of Putin’s misguided venture
greatly exceed any benefits that he may have achieved in extending Russian
controlled territory. We remain realistically hopeful that at the end of the war,
Ukraine will emerge as a free, independent, vibrant nation; NATO will be
stronger than it has been in many decades and better armed to deter future
Russian aggression; and most importantly, there will have been no nuclear war.
16 Russia-Ukraine War Report CardBelfer Center for Science and International Affairs | Harvard Kennedy School 17
Appendix
     Territorial Control
     Maps and territorial estimates are based on data from:
     “Russian Campaign Assessments,” Institute for the Study of War, https://www.understandingwar.org/;
     “Russia’s Invasion of Ukraine in Maps — Latest Updates,” Financial Times; “Ukraine Maps: Tracking the
     Russian Invasion,” The New York Times, https://www.nytimes.com/interactive/2022/world/europe/
     ukraine-maps.html; “Ukraine in Maps: Tracking the War with Russia,” BBC News, sec. Europe, https://
     www.bbc.com/news/world-europe-60506682.

     Military casualties
     Military casualty estimates are based on:
     US, UK, Ukrainian, Russian, and other public government estimates.

     Civilian fatalities
     United Nations, “Ukraine: Civilian Casualties,” https://ukraine.un.org/en/resources/publications;
     Central Intelligence Agency, “The World Factbook,” https://www.cia.gov/the-world-factbook/;

     Russian civilian fatality estimates are based on:
     Statement by Belgorod Region Governor Vyacheslav Gladkov, January 24, 2023, http://kremlin.ru/
     events/president/news/70389; Public reporting on civilian casualties in Russia.

     Military vehicles and equipment
     Oryx, “Attack On Europe: Documenting Equipment Losses During The 2022 Russian Invasion Of
     Ukraine,” Oryx (blog), https://www.oryxspioenkop.com/2022/02/attack-on-europe-documenting-
     equipment.html; “The Military Balance 2022,” IISS, https://www.iiss.org/publications/the-military-
     balance/the-military-balance-2022.

     Citizens displaced
     United Nations, “Ukraine Humanitarian Response,” https://reports.unocha.org/en/country/ukraine/;

     Russian civilian displacement estimates are based off public reporting, including:
     “About 700,000 citizens left Russia after September 21,” Forbes.ru, October 4, 2022, https://www.
     forbes.ru/society/478827-rossiu-posle-21-sentabra-pokinuli-okolo-700-000-grazdan; Mary Ilyushina,
     “Cyprus, a Haven for Russian Expats, Welcomes Techies Fleeing Ukraine War,” The Washington Post,
     October 24, 2022, https://www.washingtonpost.com/world/2022/10/23/cyprus-russian-expat-tech-
     workers/; “Nearly 4M Russians Left Russia in Early 2022 – FSB,” The Moscow Times, May 6, 2022,
     https://www.themoscowtimes.com/2022/05/06/nearly-4m-russians-left-russia-in-early-2022-
     fsb-a77603; “Twice as Many People Left Russia in the First Half of 2022 as in the First Half of 2021,”
     Kyiv Post, https://www.kyivpost.com/post/5278.

     Economic impact
     International Monetary Fund and World Bank estimates. Russia Matters. “Russia and Ukraine 3-Year
     Bond Yield,” Investing.com, https://www.investing.com/rates-bonds/russia-3-year-bond-yield.

18   Russia-Ukraine War Report Card
Infrastructure
Estimates of infrastructure damage based off public media reporting, including:
“Ukraine Real-Time Electricity Data Explorer – Data Tools,” IEA, https://www.iea.org/data-and-statistics/
data-tools/ukraine-real-time-electricity-data-explorer; Dara Massicot, “What Russia Got Wrong,”
Foreign Affairs, February 8, 2023, https://www.foreignaffairs.com/ukraine/what-russia-got-wrong-
moscow-failures-in-ukraine-dara-massicot; Aura Sabadus, “Power to Ukraine,” CEPA, February 17,
2023, https://cepa.org/article/ukraine-energy-grid-resilience-continues-despite-invasion/; Andrew
D’Anieri and Victoria Voytsitska, “How to Save Ukraine’s Energy Infrastructure,” The Hill, November 17,
2022, https://thehill.com/opinion/international/3729102-how-to-save-ukraines-energy-infrastructure/;
“Russian Air Attacks on Ukraine’s Power System,” Wilson Center, https://www.wilsoncenter.org/blog-
post/russian-air-attacks-ukraines-power-system.
Popular support
“Conflict with Ukraine: November 2022,” Levada Center, December 12, 2022, https://www.levada.ru/
en/2022/12/12/conflict-with-ukraine-november-2022/; “Ukrainians Support Fighting Until Victory,”
Gallup Inc, Gallup.com, October 18, 2022, https://news.gallup.com/poll/403133/ukrainians-support-
fighting-until-victory.aspx; “Globalism 2022 - Support for Countering Russia - All Markets,” YouGov-
Cambridge Centre, September 22, 2022, https://yougov.co.uk/topics/yougov-cambridge/survey-results.
Belfer Center for Science and International Affairs | Harvard Kennedy School 19Avoiding Great Power War Project Belfer Center for Science and International Affairs Harvard Kennedy School 79 JFK Street Cambridge, MA 02138 www.belfercenter.org Copyright 2023, President and Fellows of Harvard College Printed in the United States of America
You can also read