Results Presentation and Company Profile - on 30 June 2022 GREEN PROPERTY INVESTOR
←
→
Page content transcription
If your browser does not render page correctly, please read the page content below
Results Presentation and
                                   Company Profile
    GREEN PROPERTY INVESTOR           on 30 June 2022
IN CENTRAL AND EASTERN EUROPE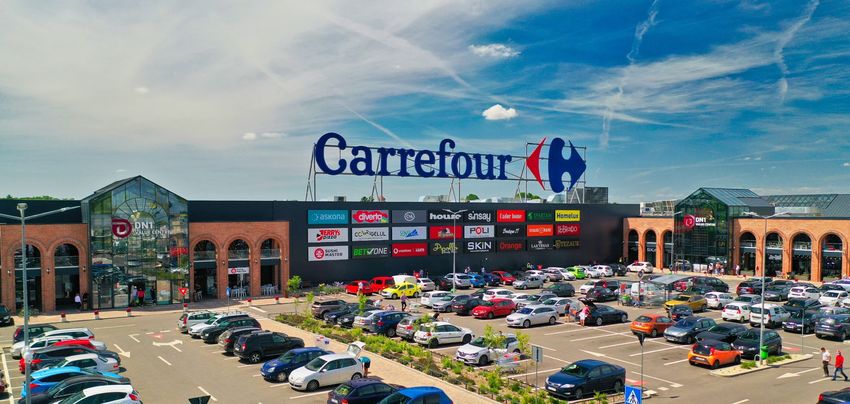
TABLE OF CONTENTS

                               3     RESULTS SUMMARY & HIGHLIGHTS
                               4     CEE GLA STATUS, FOOTFALL, TENANTS’ SALES, INVOICING & COLLECTION Jan — Jun 22
                               5     PROGRESS WITH STRATEGIC TARGETS Jun 22
                               6     EARNINGS GUIDANCE Jun 22
                               7     EARNINGS Jan — Jun 22 vs. Jul — Dec 21
                               8     NET ASSET VALUE Jun 22 vs. Dec 21
                               9     CEE PASSING NET RENTAL INCOME & FAIR VALUE MOVEMENTS Jan — Jun 22
                               10 DEBT CAPACITY AND REPAYMENT PROFILE Jun 22
                               11 INCOME PROPERTY SCHEDULE Jun 22
                               12 INCOME PROPERTY HELD FOR SALE SCHEDULE Jun 22
                               13 DEVELOPMENT PROPERTY SCHEDULE Jun 22
                               14 CEE DEVELOPMENT PROPERTY MOVEMENTS Jan — Jun 22
                               15 PROPERTY OVERVIEW
                               16 INCOME PROPERTY
                               30 DEVELOPMENT PROPERTY
                               44 COMPANY PROFILE
                               45 ENVIRONMENTAL
                               46 DEVELOPMENT JOINT VENTURE STRUCTURE
                               47    EARNINGS Jan — Jun 22
                               48 NET ASSET VALUE Jun 22
                               49 GROUP MANAGEMENT
                               51    NON-EXECUTIVE DIRECTORS
                               53 BENEFICIAL SHAREHOLDERS HOLDING OVER 5% Jun 22
                               54 GLOSSARY

                               Note: All figures in this document are based on segmental financial information (Note 3 in the consolidated annual financial
                               statements for year to 30 June 2022 — the ‘IFRS financial statements’), where the development joint venture (‘DJV’) is
                               consolidated under the proportionate method, instead of the equity method. This information is intended to be a complement to,
                               not a replacement of, MAS’ (hereafter referred to as the Group or the Company) IFRS financial statements.
                               Historical segmental analysis information in editable format may be downloaded here.
Photo: Galleria Stara Zagora                                                                                                                                    2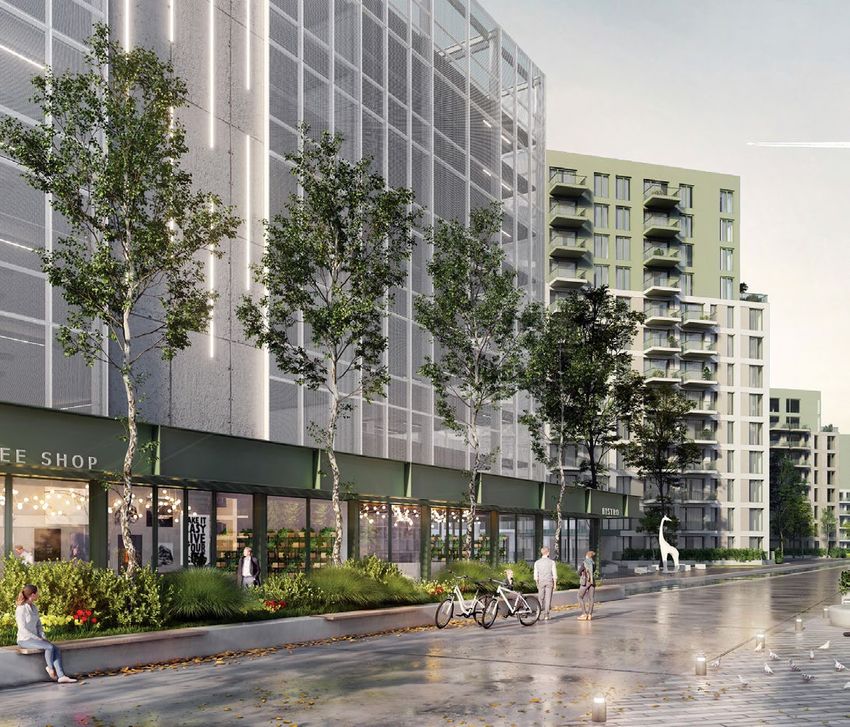
RESULTS SUMMARY HIGHLIGHTS
Six-month period to Six-month period to
30 Jun 2022 31 Dec 2021
Adjusted distributable EPS 30.8% in six months
FINANCIAL RESULTS PER SHARE (eurocents)
€3.0m net profit on first residential sales at Marmura
140 131 9 6.9%
Tangible NAV ( 12.9% y-o-y)
Residence (on a proportionate consolidation basis)
Earnings 11.38 13.52 (2.14)
Adjusted distributable earnings ( 15.2% y-o-y) 3.87 2.96 0.91 30.8% CEE valuation €66.8m ( 11.5% in six months)
Adjusted non-distributable earnings 7.51 10.56 (3.05)
Share buy-backs 0.61 – 99% pro forma CEE collection rate
Dividends paid during the period i
2.96 5.93
LFL CEE Passing NRI 4.7%
OPERATIONAL RESULTS
Footfall - LFL 12.9% 12.3% LFL CEE Occupancy 1.0% to 96.3%
Sales/m2 - LFL ii 13.4% 9.4%
Indexation 4.4% 4.2% Strong balance sheet with LTV of 28.4% *
Rent reversion iii
2.7% 0.9%
Pro forma collection rate 99.0% 98.0% Share repurchases of €20.0m
OCR iv
11.1% 11.3%
Occupancy 96.3% 95.3% Completed acquisition of six Romanian retail centres
PASSING INCOME (€ million) v 84.1 71.8 12.3
from the DJV at a price of €319.7m
Passing income on preferred equity 10.6 13.5 (2.9)
DJV relationship extension and increase in MAS’
Passing NRI - CEE properties 62.2 46.9 15.3
49.1 46.9 2.2 4.7%
investment commitments to the DJV
Passing NRI - LFL ( 13.6% y-o-y)
Strong liquidity profile and substantial debt capacity
Passing NRI - completed acquisitions 13.1 – 13.1
Passing NRI - WE properties 2.5 3.4 (0.9)
Passing NRI - LFL 2.5 2.5 – –
€30.9m of WE property disposals contracted
Passing NRI - sold properties – 0.9 (0.9)
Expected dividends - listed securities 8.8 8.0 0.8 €19.6m in DJV’s commercial development pipeline
Expected dividends - LFL listed securities 8.7 8.0 0.7 8.7%
Expected dividends - net purchases of listed securities 0.1 – 0.1 €261.0m in DJV’s residential development pipeline
i
Dividends paid during the period were in relation to six months to 31 Dec 2021 (twelve months to 30 June 2021).
ii
To improve comparison between properties and other market data, the following categories of tenants have been
excluded from calculations of sales/m2 - LFL and OCR: supermarkets, DIYs, entertainment and services.
iii
Rent reversion applicable to lease expiries of €3.5m in Jan-Jun 2022 and €3.8m in Jul-Dec 2021.
iv
OCR trailing twelve months. * Taking account of the cash settlement with respect to
v
Passing Income does not include residential sales. the acquisition of six assets from the DJV.
3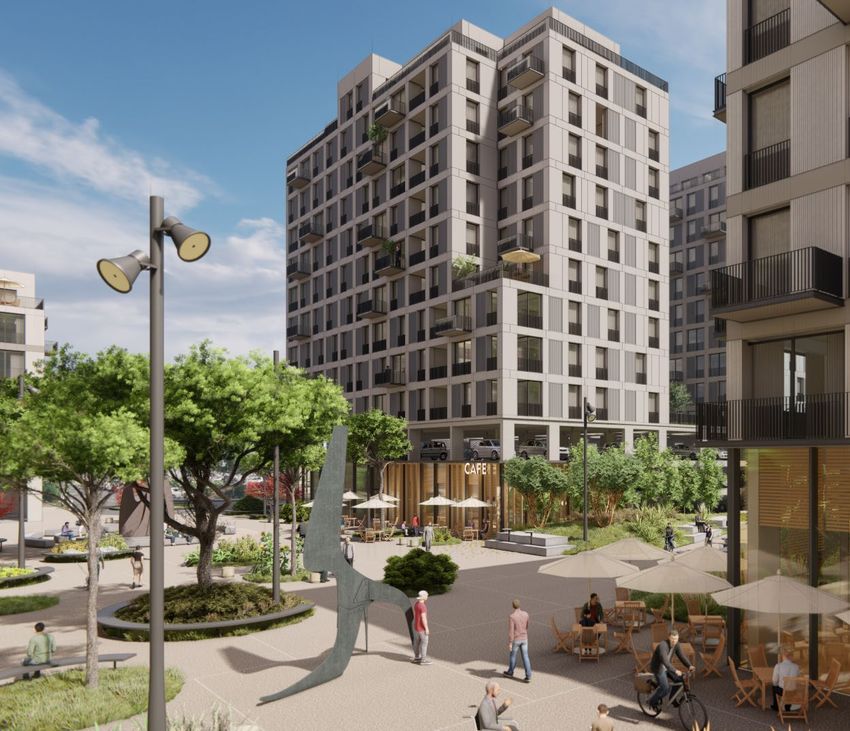
CEE GLA STATUS, FOOTFALL, TENANTS’ SALES, INVOICING & COLLECTION                                                                               Jan — Jun 22

                                                                                           Jan 22    Feb 22               Mar 22              Apr 22              May 22              Jun 22    Total

     Open GLA1                                                                               9%        24%                 85%                 100%                100%                100%      70%

     Restricted GLA2                                                                        91%        76%                 15%                  –                    –                      –    30%

     Closed GLA   3
                                                                                              –         –                   –                   –                    –                      –     –

     Footfall (LFL 2022 vs. 2019)                                                           78%        82%                 95%                 104%                105%                 97%      94%

          Open-air malls                                                                    89%        91%                 97%                 110%                109%                102%     100%

          Enclosed malls                                                                    68%        72%                 92%                 98%                 100%                 91%      87%

     Tenants’ sales per m2 (LFL 2022 vs. 2019)                                              103%      107%                111%                 125%                129%                113%     115%

          Open-air malls                                                                    109%      113%                113%                 126%                125%                115%     117%

          Enclosed malls                                                                    93%        97%                108%                 123%                133%                110%     112%

     Total pre-pandemic income expectation                                                 €4.5m      €4.5m               €4.6m               €4.6m               €4.6m                €4.6m    €27.4m

          Income waived, deferred or suspended                                             €0.1m      €0.1m                 –                   –                    –                      –   €0.2m

          Due income (invoiced)                                                            €4.4m      €4.4m               €4.6m               €4.6m               €4.6m                €4.6m    €27.2m

     Collection rate                                                                        100%      100%                 99%                 99%                 100%                 99%      99%

     Pro forma collection rate                                                              98%        98%                 99%                 99%                 100%                 99%      99%

     The table above presents Central and Eastern European GLA affected by restrictions, LFL footfall (compared to 2019), LFL tenants’ sales (compared to 2019), income entitlements
     (including invoicing, waivers and deferrals), collection rates (collections compared to invoicing) and pro forma collection rates (collections compared to the total expected income
     disregarding impact of Covid-19) (all figures were reported on 18 August 2022).

      1
        GLA open for trade without restrictions.
      2
        GLA open for trade subject to restrictions (pro-rated to reflect days with restrictions).
      3
        GLA closed for trade (pro-rated to reflect days closed).
                                                                                                                                                                                                         4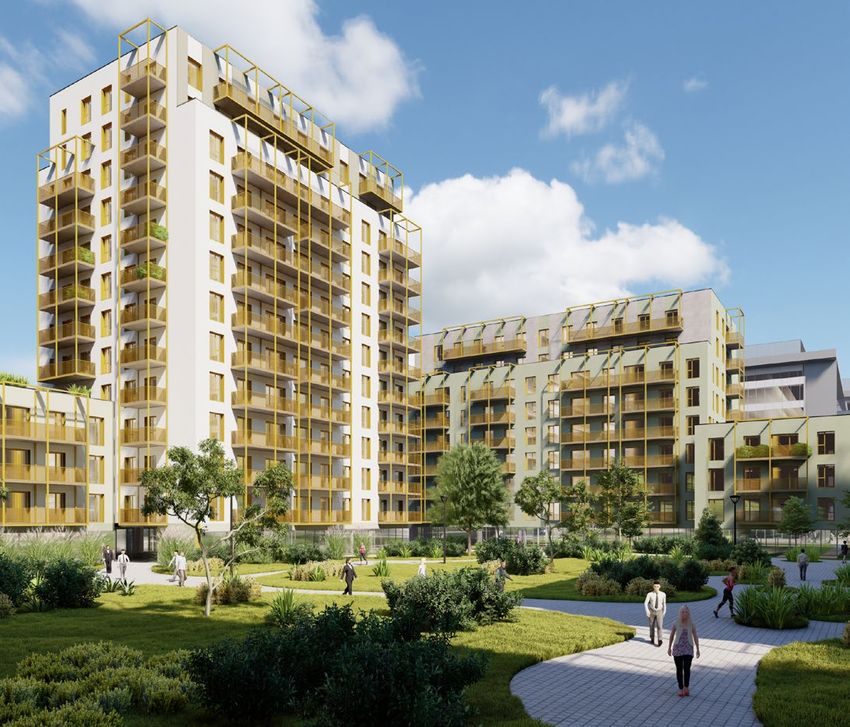
PROGRESS WITH STRATEGIC TARGETS                                                        Jun 22

              OPERATIONAL                                                       COMMERCIAL                             RESIDENTIAL                         ACQUISITIONS
                                                                               DEVELOPMENTS                               SALES
                         at least

                       4%                                                       €600m*                                €200m*                            €331.6m
   annualised LFL NRI growth to Jun 2026**                                completion of developments (at cost)      per annum, 20% net after tax               total acquisitions
                                                                          at a weighted initial net yield of more        margin to Jun 2026
            passing NRI LFL growth of 4.7%
                                                                           than 9% from Jun 2021 to Jun 2026
       (30 Jun 2022 compared to 31 Dec 2021)                                                                          net margin on residential     €139.8m
           passing NRI LFL growth of 13.6%                                                                          sales to 30 Jun 2022 of €3.0m   equivalent direct
                                                                                                                                                    property acquisition via
       (30 Jun 2022 compared to 30 Jun 2021)
                                                                                      €50.8m                                                        NRP shares purchases

                      99%
                                                                                  Completed developments
                                                                                       to Dec 2021

             Occupancy by June 2026

                                                                                                                                                                €200m
                         Jun 2021

                         93.2%
                         Dec 2021
                                                                                    €517.1m                                                                          Target
                         95.3%                                                     Secured commercial
                                                                                   pipeline by Jun 2026
                         Jun 2022

                         96.3%
                                                                                                                                                                                   €191.8m
                         Jun 2026
                                                                                                                    €200m/year                      acquisition of six retail centres from the DJV***

                   TARGET     99%
                                                                                     €466.3m
                                                                               Estimated secured pipeline to be
                                                                                                                           to Jun 2026
                                                                                                                     based on current secured                €131.6m
                                                                                    delivered to Jun 2026             pipeline of €1,194.3m                       above target

  *	Figures not proportionally consolidated.
 **	From a normalised post Covid-19 base.
*** Acquisition value calculated as 60% of the total transaction value.
                                                                                                                                                                                                        5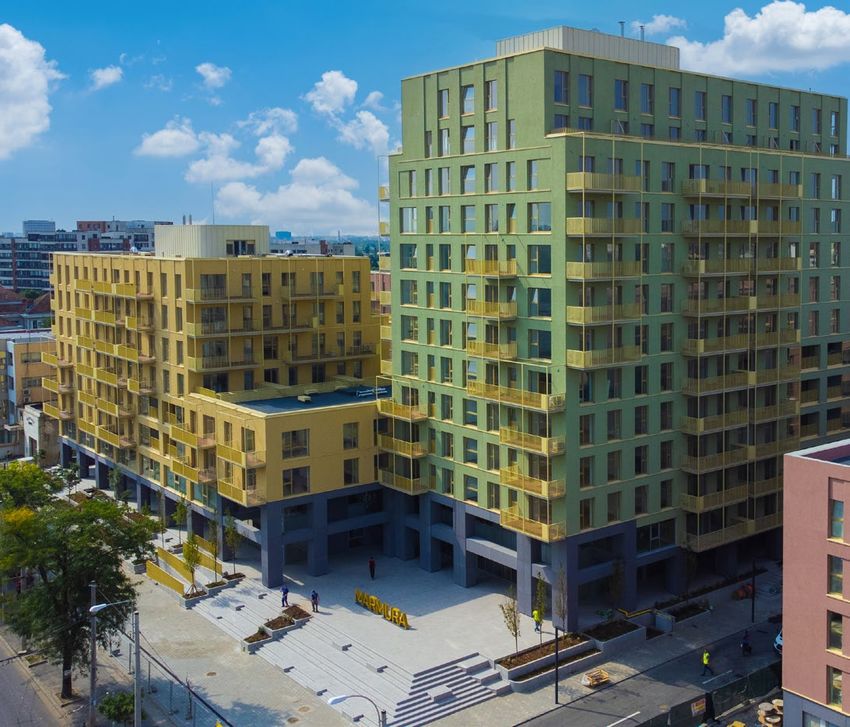
EARNINGS GUIDANCE                              Jun 22

                Assumptions

                         WE assets are sold as per management's estimates                                Listed securities investments perform as expected

                         Asset management targets achieved                                               No equity issues

                         Secured development pipeline is permitted and rolled out as planned             Predictable economic environment

                Adjusted distributable earnings per share
                Always remaining subject to optimising long-term risk-adjusted total returns.

 Guidance range                                                8.75                             0.65      9.40 ( 37.6% y-o-y)
       Jun 2023                                                9.00                               1.10       10.10 ( 47.9% y-o-y)

     Target range                                                                                                                                            14.50 ( 15.5% CAGR from Jun 23)
        Jun 2026                                                                                                                                               15.00 ( 14.1% CAGR from Jun 23)

                            Non-residential guidance    Residential guidance      Target

Note: all amounts per share (eurocents).
                                                                                                                                                                                                 6
EARNINGS                      Jan — Jun 22 vs. Jul — Dec 21

                                                                                              Adjusted proportionate accounts                            Adjusted proportionate accounts
                                                                                              Six-month period to 30 Jun 2022                            Six-month period to 31 Dec 2021
                                                                                    Total          CEE         DJV         WE            Co      Total        CEE         DJV         WE           Co       Total     CEE     DJV        WE           Co

EARNINGS                                                                          76,693        66,384      31,289       (164)      (20,816)   91,420      39,961      25,709      33,749      (7,999)   (14,727)   26,423   5,580   (33,913)    (12,817)

Distributable earnings                                                           26,084         15,890      14,309         162       (4,277)   20,022      15,075      10,336         953      (6,342)     6,062      815    3,973     (791)       2,065
Net rental income – income property                                              22,678         17,073       4,312       1,293             –   21,961      16,347       3,330       2,284            –       717      726      982     (991)           –
Net margin – residential sales                                                    2,959              –       2,959           –             –        –           –           –           –            –     2,959        –    2,959         –           –
Net income – preferred equity                                                      6,555             –       6,555           –             –     6,430          –       6,430           –            –        125        –     125           –          –
Net dividends – listed securities 1,7                                              4,339             –           –           –         4,339     1,719          –            –          –        1,719      2,620        –       –           –      2,620
Net corporate expenses                                                           (2,715)         (595)       (423)       (270)       (1,427)   (2,691)      (962)       (454)       (181)      (1,094)       (24)      367      31       (89)       (333)
Interest on debt financing                                                       (8,437)             –       (511)       (797)       (7,129)   (8,333)          –       (214)       (910)      (7,209)      (104)        –   (297)       113           80
Interest capitalised on developments                                               1,457             –       1,457           –             –     1,269          –       1,269           –            –        188        –     188           –          –
Other distributable net income/(cost) 9                                            (126)         (122)          25        (26)           (3)       161      (166)          (2)       (25)          354      (287)       44      27         (1)      (357)
Income tax                                                                         (626)         (466)        (65)        (38)          (57)     (494)      (144)        (23)       (215)        (112)      (132)    (322)    (42)        177          55

Non–distributable earnings                                                       50,609         50,494      16,980       (326)      (16,539)   71,398      24,886      15,373      32,796      (1,657)   (20,789)   25,608   1,607   (33,122)    (14,882)
Fair value adjustments – income property 5                                        63,777        50,567      16,233     (3,023)            –    35,565      24,886      15,295      (4,616)          –     28,212    25,681    938       1,593          –
Fair value adjustments – interest rate derivatives                                   829             –         829              –         –        88           –           –          88           –        741        –     829        (88)          –
Fair value adjustments – listed securities 1                                    (15,245)             –           –              –   (15,245)    (675)           –           –              –     (675)   (14,570)       –       –           –    (14,570)
Foreign currency exchange differences                                              (369)             –           –              –      (369)    2,214           –           –       2,625        (411)    (2,583)       –       –     (2,625)         42
Investment expenses 5                                                              (992)          (73)        (16)        (97)         (806)    (234)           –           –         (49)      (185)       (758)     (73)    (16)       (48)       (621)
Other non-distributable income/(cost)                                              (185)             –        (66)              –      (119)    (308)           –          78              –    (386)        123        –    (144)          –        267
Tax on sale of property                                                            1,802             –           –       1,802            –      (93)           –           –        (93)           –      1,895        –       –      1,895           –
Deferred tax 4                                                                       432             –           –         432            –    (1,092)          –           –     (1,092)           –       1,524       –       –       1,524          –
Estimation for WE disposal realisation costs and losses 5                            560             –           –         560            –    35,933           –           –      35,933           –    (35,373)       –       –    (35,373)          –

Weighted average adjusted number of shares (m) 6                                   673.9                                                        676.1
Diluted weighted average adjusted number of shares (m)                             683.5                                                        684.0

Adjusted distributable earnings per share (eurocents)                               3.87                                                         2.96
Diluted adjusted distributable earnings per share (eurocents)                       3.82                                                         2.93
Dividend per share (eurocents)                                                      3.82                                                         2.96

 1–9
       Please see Glossary.
       All amounts in € thousand unless otherwise stated.
       Historical segmental analysis information in editable format may be downloaded here.
                                                                                                                                                                                                                                                        7
NET ASSET VALUE                                  Jun 22 vs. Dec 21

                                                                                              Adjusted proportionate accounts                            Adjusted proportionate accounts
                                                                                                        30 Jun 2022                                                31 Dec 2021
                                                                                    Total          CEE         DJV         WE           Co       Total        CEE         DJV         WE            Co       Total      CEE         DJV        WE          Co

NET ASSET VALUE                                                                 923,636        757,609     243,332      64,556 (141,861)      888,060     496,440     338,693      75,435      (22,508)    35,576    261,169   (95,361)    (10,879) (119,353)

Assets                                                                        1,473,799        901,714     308,385     108,475      155,225 1,304,644     507,343     392,491     124,567      280,243     169,155   394,371    (84,106)   (16,092) (125,018)
Income property                                                                 952,822        859,816      14,536      78,470            –   700,034     486,855     124,456      88,723            –     252,788   372,961   (109,920)   (10,253)          –
Developments – income property                                                   41,573            720      40,853           –            –    27,522         713      26,809           –            –      14,051         7      14,044           –         –
Developments – residential property                                              50,293              –      50,293           –            –    48,306           –      48,306           –            –       1,987         –       1,987           –         –
Preferred equity                                                                141,640              –     141,640           –            –   180,005           –     180,005           –            –    (38,365)         –    (38,365)           –         –
Listed securities 6                                                              97,655              –           –           –       97,655   110,619           –           –           –      110,619    (12,964)         –           –           – (12,964)
Deferred tax asset                                                                3,824          2,419          23       1,382            –     2,505       1,428         129         948            –       1,319       991       (106)         434         –
Interest rate derivative financial liabilities                                    5,066          4,562         504           –            –         –           –           –           –            –       5,066     4,562         504           –         –
Other assets                                                                      2,545            158       1,860         135          392     1,009         154         717         132            6       1,536         4       1,143           3       386
VAT receivable                                                                    3,145            778       1,968         254          145     3,078         522       1,911         429          216          67       256          57       (175)      (71)
Trade and other receivables                                                      46,506         14,205      12,276      18,960        1,065    30,092       7,478       2,396      19,482          736      16,414     6,727       9,880       (522)       329
Cash and cash equivalents                                                       128,730         19,056      44,432       9,274       55,968   201,474      10,193       7,762      14,853      168,666    (72,744)     8,863      36,670     (5,579) (112,698)

Liabilities                                                                     550,163        144,105      65,053      43,919      297,086   416,584      10,903      53,798      49,132      302,751    133,579    133,202     11,255     (5,213)    (5,665)
Debt financing                                                                  463,537        123,544       9,828      34,126      296,039   363,056           –      23,893      37,395      301,768    100,481    123,544    (14,065)    (3,269)    (5,729)
Other liabilities                                                                    109             –         109              –        –      1,071           –       1,071              –         –      (962)         –       (962)          –          –
Trade and other payables 8                                                        82,353        20,561      55,116       5,629        1,047    48,555      10,903      28,834       7,835          983     33,798      9,658     26,282     (2,206)        64
Estimation for WE disposal realisation costs and losses 5                          4,164             –           –       4,164           –      3,902           –           –       3,902            –        262         –           –        262          –

Adjusted number of shares in issue (m) 6                                           659.5                                                        676.1
Diluted adjusted number of shares in issue (m)                                     669.7                                                        684.7

Tangible NAV per share (eurocents)                                                   140                                                          131
Diluted tangible NAV per share (eurocents)                                           138                                                          130

 1–9
       Please see Glossary.
       All amounts in € thousand unless otherwise stated.
       Historical segmental analysis information in editable format may be downloaded here.
                                                                                                                                                                                                                                                             8
CEE PASSING NET RENTAL INCOME & FAIR VALUE MOVEMENTS                                                                                        Jan — Jun 22

                                                            Zalau Value Centre              Sepsi Value Centre              Barlad Value Centre                Dambovita Mall               DN1 Value Centre              Prahova Value Centre

         Effective 30 June 2022,
     MAS acquired six operational
        properties from the DJV.

                 CEE Passing Net Rental Income movements

                                    Passing NRI on 31 Dec 2021         €46.9m
                           Passing NRI – completed acquisitions*       €13.1m                                                                                                  DCF VALUATION ASSUMPTIONS                              Range
                             Passing NRI – LFL income property*         €2.2m
                                                                                                                                                                               Discount rates (unlevered)                        9.5 — 11.0%
                                    Passing NRI on 30 Jun 2022         €62.2m
                                                                                                                                                                               ERV long-term growth rate                          2.5 — 3.3%

                                                                                                                                                                               Capex reserve (% of ERV)                              5 — 10%

                                                                                                                                                                               Vacancy (long-term)                                 0.5 — 7.5%
                CEE Income Property Fair Value movements
                                                                                                                                                                               Collection loss (long-term)                            0 — 1%
                               Income property on 31 Dec 2021        €611.3m
                                                                                                                                                                               Leasing fees on renewal (% 1st year ERV)                 8.3%
                                         Completed acquisitions      €192.8m
                                                Capitalised costs       €4.2m                                                                                                  Void at expiry                                   3 — 5 months

                               Valuation gains – income property       €66.0m                                                                                                  Reinstatement/fit-out cost on re-leasing        61 — 92 €/m2
                               Income property on 30 Jun 2022         €874.3m

* Passing NRI for properties acquired from the DJV as the 60% not previously owned by MAS, while MAS' 40% (previously indirect) ownership is reflected in Passing NRI - LFL.
Note: All amounts are calculated on a proportionate consolidated basis.
                                                                                                                                                                                                                                                 9
DEBT CAPACITY AND REPAYMENT PROFILE                                                                Jun 22

                                                                        21.5%*                                                  4.3      4.41%
                                                                                   LTV                                          ND/NRI    WACD

    Maximum net debt capacity (40% LTV; 7xNRI)          €521.0m

                             Net debt (debt-cash)       €288.2m

                                              Cash      €182.7m

                              Debt on 30 Jun 2022        €470.9m

                            Financing costs settled      €(7.4)m

                                  2023 repayment         €(7.9)m

                                              2024      €(40.9)m

                                              2025       €(7.3)m

                                              2026     €(331.1)m

                                              2027       €(6.0)m

                                              2028      €(77.7)m
                                                                                                                                                 LIQUIDITY SOURCES*

                                                                                                                                                 Cash                                          €84.3m
                                                                                                                                                 Listed securities                             €97.7m
                                                                                                                                                 Unsecured revolving facility**                €20.0m
                                                                                                                                                 Total                                        €202.0m
                                                                                                                                                 * Amounts not proportionally consolidated.
                                                                                                                                                 ** Commited €20m unsecured facility can be
                                                                                                                                                    increased up to €60m.

* 28.4% taking account of the cash settlement with respect to the acquisition of the six operational properties from the DJV.
Note: All amounts are calculated on a proportionate consolidated basis.
   Settled financing costs of €7.4m were capitalised against total debt in accordance with IFRS.
   €89.8m payable for the acquisition of the six operational properties from the DJV.
                                                                                                                                                                                                    10
INCOME PROPERTY SCHEDULE Jun 22
Destination Asset MAS’ share
Location Type Acq/ Stake Acquired GLA GLA Occupancy NI BV Cost NI BV Cost NI/BV NI/Cost
Dev
% year m2 m2 % €m €m €m €m €m €m % %
INCOME ASSETS 81.6 1,113.6 917.8 7.3% 8.9%
DJV preferred equity (60% of the notional) 10.6 141.6 141.6 7.5% 7.5%
Listed securities 8.8 97.7 106.5 9.0% 8.3%
Income Property 602,200 404,700 96.3% 64.0 896.1 688.2 62.2 874.3 669.7 7.1% 9.3%
Enclosed Malls 200,300 151,500 94.1% 25.9 355.8 276.6 25.9 355.8 276.6 7.3% 9.4%
EM-Galleria Burgas BG, Burgas Regional A 100% 2017 64,200 36,700 96.3% 6.5 87.7 46.6 6.5 87.7 46.6 7.4% 13.9%
EM-Nova Park PL, Gorzow Regional A 100% 2016 50,000 32,400 93.7% 6.5 84.5 90.7 6.5 84.5 90.7 7.7% 7.2%
EM-Dambovita Mall* RO, Targoviste Regional A/D 100% 2022 31,100 31,100 96.7% 5.7 85.0 70.6 5.7 85.0 70.6 6.7% 8.1%
EM-Atrium Mall RO, Arad Regional A 100% 2018 29,600 27,400 93.8% 5.5 74.3 45.6 5.5 74.3 45.6 7.4% 12.1%
EM-Galleria Stara Zagora BG, Stara Zagora Regional A 100% 2017 25,400 23,900 88.6% 1.7 24.3 23.1 1.7 24.3 23.1 7.0% 7.4%
Open-air Malls 335,100 225,400 97.2% 34.8 497.6 376.9 33.0 475.8 358.4 6.9% 9.2%
OM-Militari Shopping RO, Bucharest Regional A 100% 2018 67,900 54,000 97.4% 9.7 140.0 95.9 9.7 140.0 95.9 6.9% 10.1%
OM-DN1 Value Centre* RO, Balotesti Community A/D 100% 2022 46,700 27,400 97.3% 5.1 75.4 59.7 5.1 75.4 59.7 6.8% 8.5%
OM-Prahova Value Centre* RO, Ploiesti Community A/D 100% 2022 26,800 21,700 95.6% 3.4 50.5 43.7 3.4 50.5 43.7 6.7% 7.8%
OM-Zalau Value Centre* RO, Zalau Community A/D 100% 2022 26,300 19,300 97.8% 3.2 44.5 35.0 3.2 44.5 35.0 7.2% 9.1%
OM-Roman Value Centre RO, Roman Community A/D 100% 2019 18,800 18,800 99.4% 3.1 45.1 27.6 3.1 45.1 27.6 6.9% 11.2%
OM-Mall Moldova - phase I RO, Iasi Regional A 40% 2017 48,800 29,600 96.7% 3.0 36.3 30.8 1.2 14.5 12.3 8.3% 9.8%
OM-Baia Mare Value Centre RO, Baia Mare Community A/D 100% 2019 47,900 21,300 97.4% 2.8 41.6 29.3 2.8 41.6 29.3 6.7% 9.6%
OM-Sepsi Value Centre* RO, Sf. Gheorghe Community A/D 100% 2022 35,500 16,900 94.4% 2.4 34.1 28.8 2.4 34.1 28.8 7.0% 8.3%
OM-Barlad Value Centre* RO, Barlad Community A/D 100% 2022 16,400 16,400 99.5% 2.1 30.1 26.1 2.1 30.1 26.1 7.0% 8.0%
Strip Malls 66,800 27,800 100% 3.3 42.7 34.7 3.3 42.7 34.7 7.8% 9.6%
SM-Focsani RO, Focsani Convenience A/D 100% 2019 12,900 6,100 100% 0.9 11.9 9.1 0.9 11.9 9.1 7.8% 10.1%
SM-Slobozia RO, Slobozia Convenience A/D 100% 2019 14,600 6,700 100% 0.7 9.7 7.7 0.7 9.7 7.7 7.5% 9.5%
SM-Ramnicu Sarat RO, Ramnicu Sarat Convenience A/D 100% 2019 9,600 4,000 100% 0.5 5.7 4.7 0.5 5.7 4.7 7.9% 9.7%
SM-Sebes RO, Sebes Convenience A/D 100% 2019 7,900 3,200 100% 0.4 4.6 3.9 0.4 4.6 3.9 8.2% 9.6%
SM-Targu Secuiesc RO, Targu Secuiesc Convenience A/D 100% 2019 7,800 3,200 100% 0.4 4.5 3.9 0.4 4.5 3.9 7.8% 9.2%
SM-Fagaras RO, Fagaras Convenience A/D 100% 2019 8,200 3,200 100% 0.3 4.0 3.4 0.3 4.0 3.4 8.2% 9.8%
SM-Gheorgheni RO, Gheorgheni Convenience A/D 100% 2019 5,800 1,400 100% 0.2 2.3 2.0 0.2 2.3 2.0 8.0% 9.1%
Cost: acquisition costs, including transaction & transfer fees, plus all costs capitalised post acquisition, except for interest. A/D: partially acquired, partially developed.
Note: NI refers to passing NRI for Income properties, Fixed dividends for DJV preferred equity and Expected dividends for Listed securities.
* Income properties acquired from the DJV on 30 June 2022. The book value of these assets is reflected as the consideration price, including transaction costs at initial recognition, in accordance with IFRS.
11INCOME PROPERTY HELD FOR SALE SCHEDULE Jun 22
Owned Asset MAS’ share
Location Type Acq/ Stake Acquired GLA Occupancy NRI BV Agreed Cost NRI BV Agreed Cost NRI/BV NRI/Cost
Dev sale price sale price
% year m2 % €m €m €m €m €m €m €m €m % %
PROPERTY HELD FOR SALE 24,700 81.6% 2.5 78.5 23.5 91.0 2.5 78.5 23.5 91.0 3.2% 3.5%
Not contracted to be sold as of Jun 2022 24,700 81.6% 2.5 61.0 71.1 2.5 61.0 71.1 4.1% 4.9%
Flensburg Galerie DE, Flensburg Community A 100% 2019 24,200 81.5% 2.7 59.2 69.0 2.7 59.2 69.0 4.6% 3.9%
Arches UK, Edinburgh Mixed D 100% 2016 500 87.9% 0.2 1.8 2.1 0.2 1.8 2.1 11.1% 9.5%
Other property management costs 100% (0.4) (0.4)
Contracted to be sold as of Jun 2022 17.5 23.5 19.9 17.5 23.5 19.9
Langley Park* UK, Chippenham Land A 100% 2014 17.5 23.5 19.9 17.5 23.5 19.9
Photo: Flensburg Galerie
Cost: acquisition costs, including transaction & transfer fees, plus all costs capitalised post acquisition, except for interest.
* Sale expected to be completed by 31 December 2022.
12DEVELOPMENT PROPERTY SCHEDULE Jun 22
Destination Asset MAS’ share
Location Type Status Stake Completion GLA GLA/GSA Units ERV Budget Spent ERV Budget Spent Margin ERV/Budget
% year m 2
m 2
# €m €m €m €m €m €m % %
DEVELOPMENTS 930.8 95.9
DJV preferred equity outstanding commitment (60% of notional) 10.5 140.0 7.5%
Development Property 1,592,800 14,398 71.3 1,970.3 238.5 28.8 790.8 95.9
Enclosed Malls 319,000 207,700 34.9 412.1 56.7 14.2 167.3 22.6 8.4%
EM-Cluj Mall RO, Cluj-Napoca Super-regional Zoning 40% Oct 26 73,300 73,300 12.5 140.3 – 5.0 56.1 – 8.9%
EM-Mall Moldova - phase II RO, Iasi Super-regional Permitted 40% May 24 101,300 53,700 9.9 118.6 21.1 4.0 47.4 8.4 8.3%
EM-Arges Mall RO, Pitesti Regional Permitted 40% May 24 51,300 51,300 8.2 101.9 18.0 3.3 40.8 7.2 8.0%
EM-Alba Iulia Mall RO, Alba Iulia Regional WIP 40% Sep 23 28,900 28,900 4.0 47.2 17.6 1.6 18.9 7.0 8.5%
EM-Galleria Burgas - refurbishment BG, Burgas Regional Zoning 100% Apr 24 64,200 500 0.3 4.1 – 0.3 4.1 – 6.2%
Open-air Malls 202,300 74,000 9.4 109.9 13.0 3.8 44.0 5.7 8.4%
OM-IMGB Value Centre RO, Bucharest Community Zoning 40% Dec 24 60,600 28,000 3.9 47.0 – 1.6 18.8 – 8.2%
OM-Brasov Value Centre RO, Brasov Community Zoning 40% Apr 24 29,200 19,800 2.4 28.2 – 0.9 11.3 – 8.3%
OM-Giurgiu Value Centre RO, Giurgiu Community Zoning 40% Oct 24 18,600 14,200 1.7 19.6 – 0.7 7.8 – 8.7%
OM-Baia Mare Value Centre - extension RO, Baia Mare Community WIP 40% Oct 22 52,200 4,300 0.5 5.4 4.9 0.2 2.2 2.0 8.3%
OM-Slobozia Value Centre - extension RO, Slobozia Convenience Permitting 40% Sep 23 19,500 4,300 0.5 5.4 2.2 0.2 2.2 0.9 9.2%
OM-Roman Value Centre - extension RO, Roman Community WIP 40% Dec 22 22,200 3,400 0.4 4.3 1.1 0.2 1.7 0.5 9.4%
Land RO Land 40% 4.1 1.6
Land PL Land 100% 0.7 0.7
Office 380,200 153,600 27.0 254.0 27.9 10.8 101.6 11.2 10.6%
Office-Silk District RO, Iasi Office WIP 40% 2023/26 217,500 104,400 19.1 177.7 27.9 7.6 71.1 11.2 10.7%
Office-Cluj RO, Cluj-Napoca Office Zoning 40% 2026/28 162,700 49,200 7.9 76.3 – 3.2 30.5 – 10.3%
Residential 1,157,500 14,398 1,194.3 140.9 477.9 56.4 24.3%
RZ-Spumotim Residential RO, Timisoara Residential Zoning 40% 2026/28 181,700 2,287 193.5 – 77.4 – 22.3%
RZ-IMGB Residential RO, Bucharest Residential Zoning 40% 2025/27 242,400 3,149 188.0 – 75.2 – 24.5%
RZ-Roman Residential RO, Brasov Residential Zoning 40% 2024/27 166,000 2,137 156.7 0.2 62.7 0.1 24.9%
RZ-Silk District RO, Iasi Residential WIP 40% 2023/25 113,100 1,491 128.1 27.1 51.3 10.8 23.0%
RZ-Elba Residential RO, Timisoara Residential Zoning 40% 2025/26 104,900 1,251 127.6 – 51.1 – 25.7%
RZ-Avalon Estate RO, Bucharest Residential WIP 40% 2022/24 93,300 746 125.7 60.4 50.3 24.2 25.8%
RZ-Cluj Residential RO, Cluj-Napoca Residential Zoning 40% 2027/29 113,500 1,461 119.2 0.1 47.7 – 24.7%
RZ-Other Residential Pipeline RO Residential Zoning 40% 2025/27 65,500 920 67.5 – 27.0 – 23.8%
RZ-Marmura Residence* RO, Bucharest Residential WIP 40% 2022 36,100 458 49.9 49.4 20.0 19.8 24.0%
RZ-Pleiades Residence RO, Ploiesti Residential Permitting 40% 2023/25 41,000 498 38.1 3.7 15.2 1.5 25.5%
Spent: includes land, hard & soft costs.
Note: The planned extensions of directly-owned properties Militari Shopping and Nova Park remain on hold, with further updates to be provided in due course.
13
* At Marmura Residence 308 units have been handed over to clients by 30 June 2022.CEE DEVELOPMENT PROPERTY MOVEMENTS Jan — Jun 22
COMMERCIAL RESIDENTIAL
Development pipeline on 1 Jan 22 €286.7m Development pipeline on 1 Jan 22 €372.9m
Pipeline budget changes €15.5m Pipeline budget variances €0.6m
Planned extensions €2.9m Secured residential developments €104.4m
Secured commercial developments €7.8m Development pipeline on 30 Jun 2022 €477.9m
Development pipeline on 30 Jun 2022 €312.9m
Marmura Residence partially delivered (93% of units sold) by Jun 2022
Note: All amounts are calculated on a proportionate consolidated basis.
14PROPERTY OVERVIEW
1
1
Isle of Man Office
United
1
Kingdom
Gorzow Office
1 Poland
Income properties
Retail developments, extensions and land bank
Germany
Residential developments
Income properties held for sale
Land contracted to be sold
18 13 10
Romania
Bucharest Office
2
Sofia Office
Bulgaria
Malta Office
15INCOME PROPERTY
GALLERIA BURGAS
CO
LLECT
IVE
SKE
CHE
RS
visit www.galleriaburgas.bg
36,700m² Galleria Burgas is the dominant shopping
GLA
centre in Burgas, the regional urban and
€6.5m administrative centre of the most popular
NRI holiday destination on the Bulgarian Black Sea
€87.7m coast. The centre has a comprehensive fashion
BOOK VALUE offering as well as a significant leisure and
IL
T
S
E
96.3% food court area which caters to approximately
OCCUPANCY 479,000 inhabitants within a 60-minute drive.
TAV
EX
100%
BIJ IT
BR
O TE
IG
U
OO
YS
KE
OWNED BY MAS
CAL
LIOP
E
ZLA
TIN
AR
IBK
A
POS
T BA
NK
16INCOME PROPERTY
NOVA PARK
FASH
IO N
SZNU
SPOLROWK
KA A I
ARGA
ENM E
A
visit www.nova-park.pl
32,400m² Nova Park is the dominant regional shopping
GLA
centre in central Gorzow, western Poland,
€6.5m and has a diverse mix of high-quality tenants.
NRI
CAF
The centre benefits from a catchment area of
E
€84.5m approximately 371,000 inhabitants within a
E
R
O
T
S
P
BOOK VALUE 45-minute drive.
IM
L
O
93.7%
OCCUPANCY
100%
OWNED BY MAS
17INCOME PROPERTY
SP MB
M
DAMBOVITA MALL
D
C OV
IL
A
RP I
LI
C TA
O
IV
N
D
IN
IL
AN
D
SS
RE
XP PL
AY
T’S
LE
I
LU
SA U
CA AND
RM
GU
M
ES
O
PO
TA
M
IA
D
AB
O
D
O
N
ER
JU
BA
C
AF
FE
R
’O
ND
LE
SP
I
ST
U RE
RT
CA
M
R
U
www.dambovitamall.ro
OU
M
U
RT
SO
visit RA
NK
IN
E
MGO
LD
DE
17
UE
IQ
UT
BO
E
FIC
OE
S
OF
SH
31,100m² Located in a densely populated residential area, close
GLA
S IA
AS
OC
to Targoviste’s city centre and near the main train LG N
FO IO
ER SH
FA
€5.7m station, Dambovita Mall is the only regional retail RI
EL
NO
NRI destination in the county, having a catchment area of L IN
’S
CO
x
12
357,000 residents within a 60-minute drive. Focusing
80
€85.0m
BOOK VALUE on fashion and entertainment, it offers a modern
A
ETE
MUS
FRU
STE
LNE
ÎNTÂ
EA
ATAT
SAN
96.7% shopping experience, restaurants and playground. LE
NS
A
SS
RE
OCCUPANCY
XP
UTY
The property was developed in the DJV, became
BEA S
SA LAB OP
KO
R SH
VE
CO AY
Y D IA
PP
HA ER
IGIHAI
SIM M
100% operational on 20 August 2021 and was acquired by CA
DOR
OR
AN
GE
OWNED BY MAS MAS from the DJV on 30 June 2022. The property VIT
AM
IX
D
O
TS
can accommodate an additional extension of
approximately 12,200m2 GLA.
AV
AN
GA
RD
TO
TA
L
W
AS
H
18INCOME PROPERTY
ATRIUM MALL
IS
METROPOL
AND
CITY
FAIRYL
TABAC
CINEMA
XPRESS
1
BURGER
PAPA
BON
E
IA
N
M
O
TA
PO
SO
YM
IZIO
DEL
O
K
O
ES
G
W
M
N
KE
3F
O
AT
C
ER
M
STYLE
MEN’S
SHOP
GIFT
visit www.atriummall.ro
FANY
LUX
D
’S
SMARAG
ARIANA
SALON
BEAUTY
ND
HOUSE
ERIA
TH TRE
ONI
ANT N
ZEEMA
ITH
A
CASA
NOBIL
SMITH&SM
KERS
VLADY’S
LLO
SNEA
NOMASVE
E
GAD C&
MIZAR
SE
EX
SURPRI
MOND
RT
27,400m² Atrium Mall is Arad’s largest shopping centre,
O
SP
SH ARA
ES
AN
SH LEN
O
ES
X
M
IA
O
AR
EL
SS
SE
GLA
US
AL
M
located next to the main train and bus
XI
AX
TE
ET
M
IN
G
E
N
EL
CO
ZA
RI
€5.5m stations, five minutes walking distance from
CO
O
N
NRI the city centre, and easily accessible from any
€74.3m corner of the city, either by car, or by public
BOOK VALUE transport. The mall was recently refurbished
00
× 1,0
93.8% and reconfigured, improving the centre's retail
OCCUPANCY offering with 26 new retail concepts. Atrium
Mall benefits from an estimated catchment
KA
BERSH
100%
OWNED BY MAS area of approximately 364,000 inhabitants
LAZA
RIS
I
OPTIC
DIG
OPTIP
within a 60-minute drive.
IO
INMED
A
R
N
GATT
MAICO
CLEA
E
IN TIM
O
BE
’S
’OR
TEZY
COLIN
SPLEND
I
TIV
SOR
ORA MO
TRES
D PAND
AN
OL
DIN
LO
IL
DR
O
CC
CO
O E
EER
SH FIC
ES
F
SIZ
O
FF O
CO CAN
EE
TU
19INCOME PROPERTY
GALLERIA STARA ZAGORA
RA
SUB
R
ENO
TEL
SILY
SES
ND
GRAPTICS
O
DOR
M
TEO
ACO
VIV
EVELIN
FLAIR
ER
SILVOURT
C
I
RIN
LAZA
visit www.galleriasz.bg NA
ZLATRIBKA
ESTI
L
23,900m² Galleria Stara Zagora is the dominant retail
GLA
destination in Stara Zagora, Bulgaria’s sixth
€1.7m largest city. Located at the crossroads of two
NRI major boulevards, it is easily accessible by
€24.3m public transport. It benefits from a catchment
BOOK VALUE area of approximately 397,000 residents within
88.6% a 45-minute drive. The centre's tenant mix
OCCUPANCY favours fashion and entertainment, including
major international anchors.
100%
OWNED BY MAS
20INCOME PROPERTY
54,000m² Located in Militari, a densely populated and expanding residential area in
MILITARI SHOPPING GLA
Bucharest, this centre has excellent visibility and is located on Bucharest’s
€9.7m main western artery, which links directly into the E81/A1 highway. The
NRI open-air mall benefits from a catchment area of 1,042,000 residents within
€140.0m a 30-minute drive. The tenant mix includes a large hypermarket, DIY store,
BOOK VALUE gym and high concentration of fashion and service anchors.
97.4%
OCCUPANCY
100%
OWNED BY MAS
visit www.militari-shopping.ro
AI
IT U
A
L
IL
B IU
C
C
IB
A
E
S
F
O
N
R
A
T
IL
O
R
M
E
F
V
A
SS
IA
RO
D
E
LA
S
M
E
LI
E
IC
R
V
R
E
DINNER
S
EL
T
NORI
O
T
ATM
P
E
S
F
N
U
A
B
R
E
RAIMA
A
L
C
L
IUTE
MUMUSO
PIZZA ITA
PANCO
KARCHER
EVA BEAUTY
BON
RUSTIC
CU
TAVA TOATE
DE
P
HO
MY A
MELI O
ISH
IRS
GE
S MEL
IHA
KURTO
OF
S ESS
KALAC XPR
PR
TABAC
’OR
SPLEND
SMITH&SMITH
L
BACIUIAN
SIB
0
x 380
21INCOME PROPERTY
DN1 VALUE CENTRE
SUSHI
MASTER
ING
visit www.dn1valuecentre.ro
27,400m² DN1 Value Centre is located in Balotesti,
GLA
Romania, in a rapidly developing and affluent
€5.1m residential area, approximately 25km north
NRI of Bucharest. The centre has an excellent
€75.4m location on the DN1/E60, Romania’s busiest
BOOK VALUE national road. The open-air mall benefits from
97.3% a catchment area of approximately 137,000
OCCUPANCY inhabitants within a 30-minute drive, and is
integrated, as part of a wider retail node, with
100%
OWNED BY MAS a Hornbach DIY store and a Lidl supermarket
(both owner-occupied). The property was
developed in the DJV, became operational on
4 December 2019 and was acquired by MAS
from the DJV on 30 June 2022.
22INCOME PROPERTY
21,700m² Prahova Value Centre is located in Ploiesti, the capital of Prahova County,
PRAHOVA VALUE CENTRE GLA
near the main train, tram and bus stations. The centre has a catchment
€3.4m area consisting of 759,000 inhabitants within a 60-minute drive. The
NRI open-air mall hosts a mix of international and national tenants and
€50.5m includes a modern food court. The property was developed in the DJV,
BOOK VALUE became operational on 3 December 2021 and was acquired by MAS from
95.6% the DJV on 30 June 2022. The property can accomodate an extension of
OCCUPANCY approximately 5,700 m2 GLA.
100%
OWNED BY MAS
visit www.prahova-valuecentre.ro
AL 1
D
R
PRIM
A
G
N
A
V
A
FET
LA BU
R
MESO
POTA
MIA
CADO
LET’SAY
PL
OLAND
GYMB
O
IN
S
A
C
K
C
A
J
SSA
LILA RO
IA
E I
R
IG A
H
IM I
VISTA
S M
L
OPTO
IE
x 720
R
Y
ND
E
L
M O
O
O
G
N
IA
R
E
D
S
N
E
N S
D
A
O PE
V
IS E
A
A R
L
M C
23INCOME PROPERTY
ZALAU VALUE CENTRE
LET’S
PLAY
AVANGARD
DONUTERIE
NEOTTIA
visit www.zalauvaluecentre.ro
19,300m² Located on the city’s main boulevard, next to a
GLA
densely populated residential area, and within
€3.2m 2.5km of the city centre, Zalau Value Centre’s
NRI prominent position is accessible by car and
BIJUTEERIA
public transport. The open-air mall is close to
ONIX
€44.5m
BOOK VALUE the regional bus terminal and has excellent
97.8% access via the E81 European road. The centre
OCCUPANCY benefits from a catchment area of approximately
170,000 residents within a 60-minute drive. The
100%
OWNED BY MAS property was developed in the DJV, became
operational on 6 November 2019 and was
acquired by MAS from the DJV on 30 June 2022.
24INCOME PROPERTY
ROMAN VALUE CENTRE
COCO
RINOO
LET’S
PLAY
MONEYGRAM
BUJITERIA
LE PREMIER
DRAGON
XMAS
ROYAL
WOK
ROBEST
MESOPOTAMIA
NORIEL
EXPRESS
JUNGLE
KRISTALL
KIDDY
CREDIT OPTIC
RAINBOW
MARCO
BOUTIQUE 17 FASHION
SUPERSTAR
DOPO POCO JUBA CAFE
3D X-RAY
IQOS
POSETTE
MINIER
GRAZIE MILLE
AND
CADOR
MOBICELL
HOCO
CEASORNICARIE
LA CIMPOIESU
SANATATEA ÎNTÂLNESTE FRUMUSETEA
FLORARIE
VITAMIX
× 810
LA CIMPOIESU
www.romanvaluecentre.ro
FLORIADI
visit HAIR
PETRU
STUDIO
INFINITE
LOVE
ESENTE SI
AROME
18,800m² Roman Value Centre, located within walking distance BONCAFE
BESTLINE
DON
CASH
GLA
from the city centre and next to the train station
€3.1m and regional bus station, is the city’s largest retail
NRI destination. Its catchment area consists of 207,000
€45.1m inhabitants within a 60-minute drive. The centre
BOOK VALUE integrates a Carrefour hypermarket with fashion
99.4% and home decoration anchors. The property was
OCCUPANCY developed in the DJV, became operational in
November 2018 and was acquired by MAS from the
100%
OWNED BY MAS DJV in February 2019. An extension of approximately
3,400m2 is under development, planned to be
operational by December 2022.
25INCOME PROPERTY
BAIA MARE VALUE CENTRE
BURGER
PRIME
KARAFFE
visit www.baiamarevaluecentre.ro
21,300m² Baia Mare Value Centre has good accessibility,
GLA
with a variety of public transport hubs in close
€2.8m proximity, is located on the E58 European road,
NRI the main connection between Baia Mare and
€41.6m Romania’s Transylvania region. The centre is
BOOK VALUE part of the city’s, and region’s, main commercial
PIERRE
97.4% attractions, having a catchment of approximately
OCCUPANCY 283,000 inhabitants within a 60-minute drive.
100% The open-air mall's tenant mix includes a
OWNED BY MAS hypermarket and a high concentration of
anchor tenants, mainly fashion. The property
was developed in the DJV, became operational
in December 2018 and was acquired by MAS
from the DJV in February 2019. An extension of
approximately 4,300m2 is under development,
planned to be operational by October 2022.
26INCOME PROPERTY
SEPSI VALUE CENTRE
NORIEL
× 514
visit www.sepsivaluecentre.ro
COLLECTION
BOUTIQUE 17 NOBILACASA JUBA CAFE
FASHION
CADOR
BERTIS
ADERIX
CAPPUCCINO
RUFARIE
B&B
CAFE
COVERSHOP
HYGEA
FARM
16,900m²
FINE DRINK
EXCHANGE
Sepsi Value Centre, with a catchment area
XPRESS
TABAC
STORE
KOLUMBAN
TALMA OPTIKA
GSM CUTURA
GLA
of approximately 216,000 residents within a
€2.4m 60-minute drive, is located in Sfantu Gheorghe, PLAY AGAIN
NRI the capital of Covasna County. The project is
BVB
CASINO
SEPSI
€34.1m located in a densely populated residential area, H-JUMP
BIG MAMA
BOOK VALUE is directly accessible from the town’s main MESOPOTAMIA
94.4% boulevard and is close to the city centre.
OCCUPANCY
The centre hosts a fashion area, cafes with
100% outdoor terraces and a modernly designed food
OWNED BY MAS court. The property was developed in the DJV,
became operational on 18 March 2021 and was
acquired by MAS from the DJV on 30 June 2022.
27INCOME PROPERTY
MESOPOTAMIA
BARLAD VALUE CENTRE
LET’S PLAY
NEDJOY
GSM
ROMAIA
TRAVEL
OZ GOLD
LA TUTU
PARFUM
MINIER
ROPHARMA
PARFUM
D&P
NORIEL ALL SPORT
IQOS
AVANGARD
INFINITE
LOVE
MOBICELL
visit www.barladvaluecentre.ro
BARBER
SHOP
16,400m² Located on the northern side of Barlad, Vaslui
GLA
county’s second largest city, the centre has a
€2.1m prominent position on the E581 European road
NRI and is easily accessible from the city centre, as
€30.1m well as from nearby communities. The centre is
BOOK VALUE set to become the dominant commercial node in
99.5% the wider region, totaling approximately 158,000 x 880
OCCUPANCY inhabitants within a 60-minute drive. It includes
the region’s first Carrefour hypermarket, as well as
100%
OWNED BY MAS a service area, fashion tenants, cafes with outdoor
terraces and a small food court.
The property was developed in the DJV, became
operational on 30 November 2021 and was
acquired by MAS from the DJV on 30 June 2022.
28INCOME PROPERTY
STRIP MALLS
× 1 75
owned out of 5��
NORIEL
27,800m² These properties include seven convenience
GLA
centres with a high density of national and
€3.3m international anchors, including Deichmann,
NRI Jysk, and Pepco. They are easily accessible
€42.7m by car and public transport and are close to
BOOK VALUE densely populated residential areas.
100% The centres' proximity catchment areas
OCCUPANCY
range between 47,000 and 80,000 residents.
100% The properties were developed in the DJV, Focsani Value Centre
OWNED BY MAS completed during 2017 and 2018 and
acquired by MAS from the DJV in 2019.
29DEVELOPMENT PROPERTY
Permitted
MALL MOLDOVA – PHASE II
C
A
S
IN
O
T
EN
NT
M
RA
IN
STAU
A
RT
RE
NT
TE
RA
EN
STAU
RE NT
RA
STAU
RE
R
E
S
T
A
U
R
A
N
T
NT
RA
STAU
RE
NT
RA
STAU
RE
A
T
EM
AN
UR
TA
ES
IN
R
C
R
E
S
T
A
U
R
A
N
T
NT
ME
AIN
RT
TE
EN
M
Y
G
R
HO
NC
NA
IO
SH
FA
R
HO
NC
NA
0
IO R
SH HO
15
FA NC
NA
IO
3,
SH
FA
×
N
53,700m²
IO R
The extension of the former Era Shopping Centre
SH O
FA NCH
A
GLA
H N
C O
R
N I
(29,600m2) into Mall Moldova will create a
A SH
O
FA
super-regional mall serving eastern Romania and
H N
€9.9m
C O
N
R
IO R
N I
SH O
A SH
O
FA NCH
FA
A
N
F
IO R
ERV
SH O
A
neighbouring Republic of Moldova, an estimated
FA NCH
S
H
IO
A
N
F
H N
A
A
S
N
C O
H
R
C
N I
IO
A SH
H
O
O
N
FA
R
A
catchment area of approximately 644,000
N
C
€118.6m
H
FA
O
SH
R
FA IO
SH N
AN
IO CH
N OR
BUDGET inhabitants within a 60-minute drive. The centre
AN
CH
OR
FA
SH
will include the region’s largest hypermarket,
IO
N
AN
CH
40%
OR
OWNED BY MAS over 200 stores, more than 30 restaurants, a
large entertainment and leisure facility, and a
E
ER
V
O
R
dedicated home furnishing hub. Construction is
scheduled to commence in November 2022.
30DEVELOPMENT PROPERTY
Permitted
ARGES MALL
FI
TN
ES
S
FA C
SH HO
A
N
IO R
N
×2
,00
FA C
FA C
SH HO
A
N
IO R
SH HO
0
A
FA C
N
SH HO
A
N
N
IO R
IO R
N
F
N
AN ASH
CH ION
OR
51,300m² Arges Mall is located in Pitesti, the capital and
F
AN ASH
FA C
SH HO
A
CH ION
N
IO R
OR
N
GLA
FA C
SH HO
A
largest city of Arges County, with a population
N
IO R
N
FA C
SH HO
A
N
IO R
N
€8.2m of approximately 170,000. Centrally located in
ERV a densely populated residential area next to
EL AN
EC C
TR HO
the main train station and the main boulevard,
O R
FA C
N
€101.9m
SH HO
IC
A
N
IO R
S
N
BUDGET the planned project is easily accessible from
T
E
K
the E81/A1 highway and benefits from a
R
40%
A
M
OWNED BY MAS catchment of approximately 621,000 residents
R
E
P
within a 60-minute drive.
Y
H
31DEVELOPMENT PROPERTY
WIP
ALBA IULIA MALL CAS
INO
GY
M &F
ITN
ESS
FA
SH
IO
FA N
SH
IO
N
SP
EC
I AL
FA IS
SH T
IO
FA N
SH FA
IO SH
IO
N FA
SH
N
IO
N
TO
YS
TO FA
YS SH
IO
SP FA N
EC SH
I
28,900m² Located in central Romania, Alba Iulia is an important IO
AL
IS N
T
FO
GLA O
historical and tourist destination. The property
TW
EA
FA
SH
R
FA IO
SH N
€4.0m benefits from a catchment of approximately 228,000 IO
N
ERV residents within a 60-minute drive. The planned
×7
N
enclosed mall is situated next to a densely populated
IO
€47.2m 00
SH
FA
N
BUDGET area, and has excellent visibility and access to E81
IO
SH
FA
European road. The city’s first and only modern retail
RE
40%
U
IT
RN
OWNED BY MAS centre includes an impressive entertainment and
FU
CS
NI
leisure facility and will benefit from a diverse retail
O
TR
EC
EL
offering and high-quality national and international
HY
tenants. Construction has started and the centre is PE
expected to open in 2023. RM
AR
KE FA
SH
IO
T
N
FU
RN
IT
UR
E
32DEVELOPMENT PROPERTY
Zoning
BRASOV VALUE CENTRE FASHION
FASHION
FOOTWEAR
FASHION
FASHION
FASHION × 850
FURNITURE
19,800m² Brasov Value Centre is located in north-west
GLA
Brasov, next to an existing Hornbach and a
€2.4m large area of existing and future residential and
HYPERMARKET
ERV industrial developments. The planned project
€28.2m has excellent visibility, access from the E68
BUDGET European road and the surrounding cities, and
40% a great connection to the city centre through
OWNED BY MAS numerous bus lines. The centre's catchment area
is estimated to include approximately 504,000
ELECTRONICS
TOYS
FASHION
FASHION
residents within a 60-minute drive.
33DEVELOPMENT PROPERTY
Zoning
GIURGIU VALUE CENTRE
FASHION
SPORTSWARE
SHOES
SPORTSWARE
ELECTRONICS × 560
PET CARE
DRUG STORE
TOYS
FASHION
14,200m² Giurgiu Value Centre is located in east Giurgiu,
GLA
next to Giurgiu/Ruse customs, at the border
€1.7m with Bulgaria. The planned project has excellent
ERV visibility, access directly from the Ring Road
€19.6m Bucharest - Giurgiu/Ruse border, and connection
BUDGET to the city centre through multiple access roads.
40% The centre's catchment area is estimated to
OWNED BY MAS include travelers transiting between Bulgaria and
Romania and approximately 110,000 residents
HYPERMARKET
within a 30-minute drive.
34DEVELOPMENT PROPERTY
Zoning
SPUMOTIM RESIDENTIAL
181,700m²
GSA
2,287
UNITS
€193.5m
BUDGET
40%
OWNED BY MAS
The residential project is planned to be developed on a 6.9ha land
plot, in the south-east of Timisoara, comprising approximately
2,300 high quality apartments. The former industrial platform
benefits from excellent public transport connectivity to the city
centre. The planned development will benefit from efficient
parking solutions in stand-alone structures, connected to
residential buildings through a network of well-placed covered
walkways located in the central car-free green and leisure areas.
35DEVELOPMENT PROPERTY
Zoning
IMGB
Residential Retail
242,400m² 28,000m²
GSA GLA
3,149 €3.9m
UNITS ERV
€188.0m €47.0m
BUDGET BUDGET
40% 40%
OWNED BY MAS OWNED BY MAS
The planned residential project is located in the south of Bucharest
on a former 17.8ha industrial platform with a 250 meter opening
onto Berceni boulevard, within five minutes walking distance
from the Berceni metro station. The development will provide
approximately 3,150 modern apartments integrated into a car-free
and green neighbourhood that will have direct pedestrian and car
access to the project's planned 28,000m2 GLA retail component.
The planned open-air mall benefits from a large catchment area of
383,000 inhabitants within a 45-minute drive.
The residential component will benefit from extensive green areas,
a large and exclusive community centre, a kindergarten, and
around 3,800 affordable and quality parking places in free standing
buildings connected to residential buildings via a grid of walkways.
36DEVELOPMENT PROPERTY
Zoning
ROMAN RESIDENTIAL
166,000m²
GSA
2,137
UNITS
€156.7m
BUDGET
40%
OWNED BY MAS
The residential project is planned to be developed on a 9ha former
industrial platform in south-eastern Brasov, southern Transylvania’s
major city, with approximately 287,000 inhabitants. The project will
have approximately 2,140 high-quality apartments integrated into
a well-designed masterplan comprising modern green and leisure
areas, with planned complimentary functions such as a modern
kindergarten, a community centre and complimentary services.
The land plot benefits from proximity to downtown Brasov and the
historical centre of the city, and to a well-preserved forest on its
eastern border.
37DEVELOPMENT PROPERTY
WIP
SILK DISTRICT
Residential Office
113,100m² 104,400m²
GSA GLA
1,491 €19.1m
UNITS ERV
€128.1m €177.7m
BUDGET BUDGET
40% 40%
OWNED BY MAS OWNED BY MAS
The large 10ha mixed-use, urban regeneration project combines
several functions increasing efficiency of infrastructure, amenities,
and services. The development aims to be a 24/7 neighborhood
and is located in proximity to Iasi’s city centre, Romania’s second
largest city. Primary functions include an A-grade office component
with BREEAM Excellent certification and high-quality apartments.
Residential high-quality components employ a clean design and
whole building approach within a pedestrian-friendly setting,
integrated into a larger ‘work, play and live’ environment.
Construction works are ongoing for the project’s first phases of the
office and residential components. Permitting for the residential
component’s second phase (346 units) has been obtained and it is
progressing well in respect of the third phase (312 units), as well as
for the following two phases of the project’s office component.
visit www.silkdistrict.ro
38DEVELOPMENT PROPERTY
Zoning
ELBA RESIDENTIAL
104,900m²
GSA
1,251
UNITS
€127.6m
BUDGET
40%
OWNED BY MAS
The residential project is planned to be developed in close
proximity to downtown Timisoara on a 5.6ha site comprising
approximately 1,250 high quality apartments and integrated
parking in low- and high-rise apartment buildings. The project
will include significant green spaces, consisting of public squares,
parks, private residents’ courtyards and roof terraces, sports, and
recreation facilities.
The property enjoys frontage to the Bega River and excellent
visibility and access (pedestrian, and via car or public
transportation). The "near zero" emissions project is planned to
include a car-free environment in an integrated single concept
masterplan.
39DEVELOPMENT PROPERTY
WIP
AVALON ESTATE
93,300m²
GSA
746
UNITS
€125.7m
BUDGET
40%
OWNED BY MAS
Avalon Estate is a unique gated community, located between Pipera
and Aviatiei neighbourhoods, in northern Bucharest. The project is
being developed on an 8.1ha plot close to the city’s business district,
providing a central location for its residents. Designed with great
attention to detail and arranged around a large park, this development
has low traffic flow and exclusive community services. Avalon Estate
borders a natural lake and offers many valuable benefits, such as
privacy, security, and a private village-type setting.
Construction is ongoing for 352 of the 746 planned dwellings in
addition to works for the perimeter walls, clubhouse, approximately
50% of the extensive landscaped parks and green areas, and internal
and external infrastructure works.
Construction and finishing works on the first buildings are completed,
and the sales office has been operational in the project’s gatehouse
since March 2022.
visit www.avalonestate.ro
40DEVELOPMENT PROPERTY
Zoning
CLUJ URBAN REGENERATION PROJECT
Residential Retail Office
113,500m² 73,300m² 49,200m²
GSA GLA GLA
1,461 €12.5m €7.9m
UNITS ERV ERV
€119.2m €140.3m €76.3m
BUDGET BUDGET BUDGET
40% 40% 40%
OWNED OWNED OWNED
BY MAS BY MAS BY MAS
A large mixed-use project incorporating retail, office and residential
functions is planned to be developed on a 17.1ha land plot near
downtown Cluj-Napoca on an industrial platform. The city is one of
the largest in Romania, and considered a major IT Hub in CEE.
The residential component will have approximately 1,460 apartments
directly connected to parking and storage areas through building
lobbies into basements whilst benefiting from access to the project’s
office and retail components through an integrated masterplan.
The retail component will benefit from a catchment area of 651,000
inhabitants within a 60-minute drive.
The project is aimed at providing significant car-free green and
leisure areas. The development will benefit from major new
infrastructure works planned by the city, placing the project in the
city centre, and in direct proximity to transportation connections
(metro, bus and road infrastructure).
41DEVELOPMENT PROPERTY
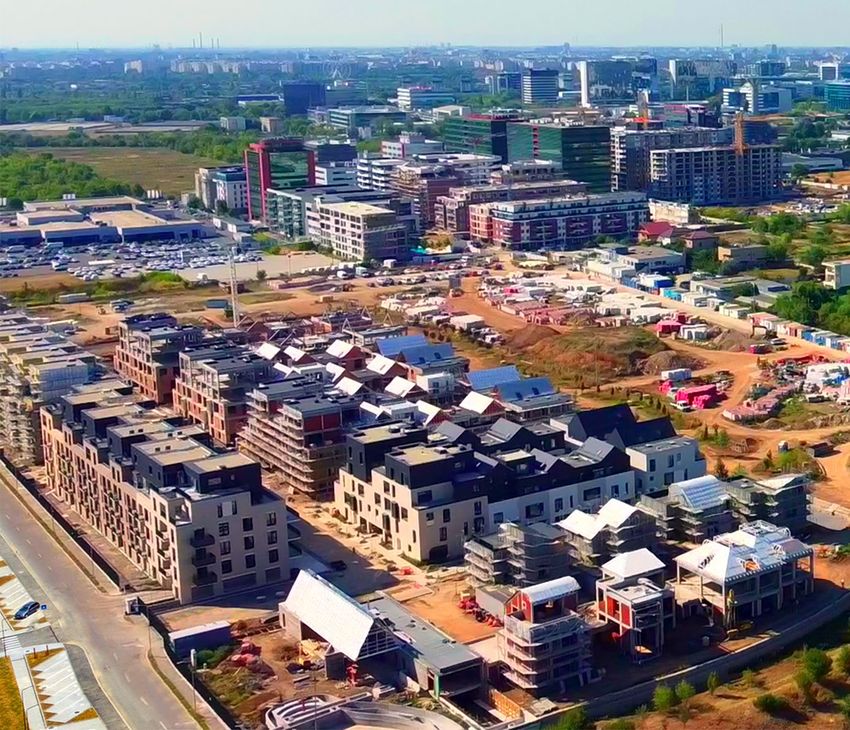
WIP
MARMURA RESIDENCE
36,100m²
GSA
458
UNITS
€49.9m
BUDGET
40%
OWNED BY MAS
Marmura Residence comprises five high-quality, high-rise apartment
buildings above an integrated underground parking, and has several
unique features: an urban park linking it to the neighbourhood,
vibrant cafes and community spaces, a central plaza, rooftop
terraces, convenient services, and direct connections to the city.
Construction works and reception with authorities for the first four
buildings have been completed, and 93% of units sold have been
handed over to clients by 30 June 2022. Construction on the fifth
building is substantially complete and handover will commence soon.
visit www.marmuraresidence.ro
42DEVELOPMENT PROPERTY
Permitting
PLEIADES RESIDENCE
41,000m²
GSA
498
UNITS
€38.1m
BUDGET
40%
OWNED BY MAS
A high quality residential project will be developed in Ploiesti,
Romania, consisting of 498 apartments integrated with Prahova
Value Centre's planned large-scale entertainment and leisure
hub extension. The residential development will consist of seven
medium sized high-rise apartment buildings and integrated
structured parking connected by way of covered pedestrian
walkways through the central green areas. The masterplan allows
for subtle traffic integration, car and pedestrian friendly project.
The project is located within a 10-minute driving distance from
the city centre and the main train station. The plot also connects
well to Bucharest given its proximity to the A3 motorway and
DN1 national road. Construction works for the first phase (two
buildings, 142 units) have started.
visit www.pleiadesresidence.ro
43COMPANY PROFILE
MAS is an internally managed green ANNUAL PASSING NET RENTAL
AND DIVIDEND INCOME
property investor and operator
73% CEE direct assets €61.0m
focused on retail properties in CEE €84.1m 1% CEE DJV €1.2m
3% WE direct assets €2.5m
13% DJV preferred equity €10.6m
10% Listed securities €8.8m
BUSINESS AND STRATEGY
Capital previously invested in WE is being directly reinvested in income property
in CEE and indirectly, on a downside protected basis, in developments via further
preferred equity in the DJV with co-investor, developer and general contractor INCOME PROPERTY AND OTHER
INCOME-PRODUCING INVESTMENTS
Prime Kapital. The Group is operated by a multidisciplinary team of approximately
230 professionals that combine investment, acquisition, leasing, asset and property 72% CEE direct assets €859.8m
management, marketing and finance skills. When required, development and €1,192.1m 1%
7%
CEE DJV
WE direct assets
€14.5m
€78.5m
construction skills can be provided by joint venture partner Prime Kapital. 12% DJV preferred equity €141.6m
8% Listed securities €97.7m
DEBT FUNDING
The Group’s funding comprises unsecured Eurobonds, unsecured revolving credit
facilities, and secured loans from banks. The Group maintains a self-imposed LTV
limitation to 40% of current property value and other investments, or seven-times
GREEN CERTIFICATION
forward-looking net rental income, both on a proportionate consolidated basis.
429,400m 2
94% CEE green certified assets 404.700m2
6% WE non-certified assets 24,700m2
CREDIT RATINGS
MAS is credit rated by Moody’s (Ba1) and Fitch Ratings (BB positive) and
issued, in May 2021, a €300million unsecured, five-year green Eurobond.
44ENVIRONMENTAL
INCOME ASSETS CERTIFICATION CERTIFICATION YEAR
MAS’ approach to business is built on a foundational EM-Nova Park BREEAM: Excellent 2022
belief that to be successful, businesses must EM-Galleria Burgas LEED: Gold 2012
EM-Atrium Mall BREEAM: Very Good 2022
make a positive contribution to society. Therefore, EM-Dambovita Mall EDGE: Advanced 2022
assessment of investment decisions includes EM-Galleria Stara Zagora BREEAM: Very Good 2022
the short- and long-term economic, social and OM-Militari Shopping BREEAM: Very Good 2022
environmental impact on communities. OM-DN1 Value Centre BREEAM: Very Good 2022
OM-Prahova Value Centre EDGE: Advanced 2022
OM-Zalau Value Centre EDGE: Advanced 2022
MAS’ initiatives contribute to the following United OM-Roman Value Centre BREEAM: Very Good 2022
Nation Sustainable Development Goals.
OM-Mall Moldova – phase I BREEAM: Very Good 2022
OM-Baia Mare Value Centre BREEAM: Very Good 2022
OM-Sepsi Value Centre EDGE: Advanced 2022
OM-Barlad Value Centre EDGE: Advanced 2022
SM-Focsani BREEAM: Very Good 2022
SM-Slobozia BREEAM: Good 2022
SM-Ramnicu Sarat BREEAM: Very Good 2022
SM-Sebes BREEAM: Very Good 2022
SM-Targu Secuiesc BREEAM: Very Good 2022
SM-Fagaras BREEAM: Good 2022
SM-Gheorgheni BREEAM: Very Good 2022
100% of GLA CERTIFIED BUILDINGS
8% BREEAM: Excellent 54% BREEAM: Very good
3% BREEAM: Good 9% LEED: Gold 26% EDGE: Advanced
45DEVELOPMENT JOINT VENTURE STRUCTURE
Unique low-risk access to exceptional development pipeline with pre-eminent CEE retail developer
• Prime Kapital employs an unique, vertically integrated development approach that consistently results in high development margins
• DJV provides co-investment access to highly lucrative developments with experienced developer that has ‘skin in the game’ via common equity
• Income assets developed to hold, encouraging long-term sustainable development
• Preferred equity structure provides downside protection and holdings of newly developed income property underpins investment
• Distribution waterfall protects MAS’ financial interests
• MAS’ representation on the DJV’s board approval for decisions on reserved matters and management of completed income properties ensuring appropriate control and influence
• MAS’ shareholders approval required for transactions between MAS and DJV provides appropriate oversight
€40.4m €60.5m
Common equity Common equity
(40% MAS) (60% Prime Kapital)
Economic interest 82% Economic interest 18%
(at Tangible NAV) (at Tangible NAV)
Capital contribution
100% of preferred equity •
€337.0m Capital contribution
• 60% of common equity
40% of common equity •
Tangible NAV
Management functions Management functions
Provides asset and property management in respect • • Sources developments
of completed developments via its integrated • Provides construction and development functions
in-house asset and property management team €236.1m via integrated in-house team on an exclusive basis
Preferred equity
(100% MAS)
Preferred equity terms
7.5% coupon, cumulative, redeemable, non-voting
46You can also read