OF - MARCH 2013 - BOARD OF AIRLINE REPRESENTATIVES NEW ZEALAND LAND VALUATION AUCKLAND AIRPORT - MARKET VALUE ALTERNATIVE USE
←
→
Page content transcription
If your browser does not render page correctly, please read the page content below
BOARD OF AIRLINE REPRESENTATIVES
               OF
         NEW ZEALAND

        LAND VALUATION

AUCKLAND AIRPORT - MARKET VALUE
       ALTERNATIVE USE

          MARCH 2013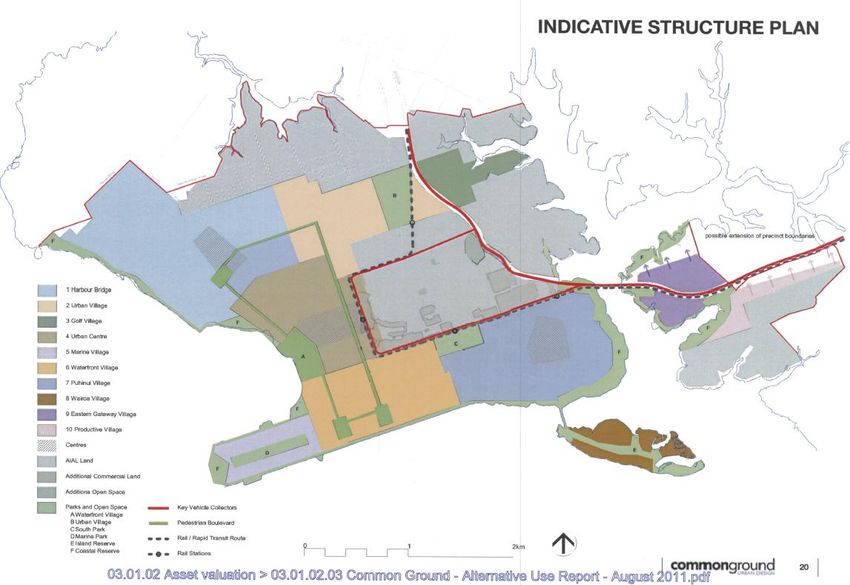
TABLE OF CONTENTS

1.0   INSTRUCTIONS .................................................................................................................... 1

2.0   PROPERTY REPORT ............................................................................................................. 2

2.1   GENERAL PROPERTY DESCRIPTION ..................................................................................... 2
2.2   LEGAL DESCRIPTION & TENURE ............................................................................................. 4
2.3   RESOURCE MANAGEMENT & ZONING .................................................................................. 7

3.0   VALUATION OF MVAU LAND ............................................................................................... 8

3.1   METHODOLOGY .................................................................................................................. 8
3.2   VALUATION CONSIDERATIONS ............................................................................................. 9

4.0   DETAILED MVAU VALUATION ........................................................................................... 10

4.1   (A) & (B) AIAL LAND HOLDINGS ........................................................................................ 10
4.2   (C) & (D) HIGHEST & BEST ALTERNATIVE USE ASSESSMENT ............................................... 10
4.3   (E) RESOURCE MANAGEMENT / AMENITIES / DEVELOPMENT MIX ..................................... 12
4.4   (F) & (G) VALUATION INPUTS - NOTIONAL SUBDIVISION APPROACH .................................... 15
4.5   (H) & (I) MVAU - DISCOUNTED CASH FLOW VALUATION .................................................... 24

5.0   COMPLIANCE STATEMENT & DISCLOSURES ........................................................................ 29

APPENDICES
I      MARKET ECONOMIC – AUCKLAND AIRPORT ALTERNATE USE SCENARIO REVIEW
II     ZOMAC PLANNING SOLUTIONS – AUCKLAND AIRPORT ALTERNATIVE USE EVALUATION
III    AUCKLAND SALES ANALYSIS
IV     DETAILED VALUATION WORKSHEETS
V      VALUATION POLICIES

Property Advisory Ltd                                                                                                                  i
BARNZ03 – MVAU Land Valuation – Auckland Airport
March 2013
Directors:

                                                                      Dougal Smith      Dip Hort, B.Com (VPM), MNZPI
                                                                      Paul Mills        B.Com (VFM), Dip Grad Com, MNZPI
                                                                      Associates:

                                                                      Tom Marks         Dip VFM, B (Ag) Com, FNZIV, MNZIPIM
                                                                      Lyndon Matthews   B.Com (VFM), ANZPI
                                                                      David Oxnam       B.Com Ag (VFM), ANZPI

16 March 2013

Attention: John Beckett

Board Of Airline Representatives Of New Zealand
PO Box 2779
Auckland 1140
New Zealand

Dear Sir

RE: AUCKLAND AIRPORT LAND VALUATION - MARKET VALUE
    ALTERNATIVE USE - JULY 2011
1.0   INSTRUCTIONS
1.    Further to your instructions to assess the Market Value Alternative Use (MVAU) of the
      Auckland International Airport (AIA) land, we have inspected the subject land and
      obtained information necessary to provide you with our opinion of value as at 30 June
      2011.

2.    We inspected the property on 15 August 2012.

3.    We understand that this valuation is required by Board Of Airline Representatives Of
      New Zealand (BARNZ) and the airlines for provision to the Commerce Commission to
      assist the Commission in undertaking its report under section 56G of the Commerce Act
      into the effectiveness of information disclosure regulation on promoting the purpose of
      Part 4.

4.    This valuation of the MVAU of the Auckland Airport land has been undertaken in
      accordance with Schedule A of the Commerce Commission Input Methodologies for
      Airport Services, under Part 4 of the Commerce Act. It has also been undertaken in
      accordance with the Commerce Commission’s requirements for the conduct of expert
      witnesses.

5.    To assist in this analysis we have relied on information that has been provided by Zomac
      Planning Solutions (ZPS), Market Economics Ltd (ME), Colliers International, AIA,
      Statistics New Zealand and Auckland Regional Council. This information includes
      property details, Certificate of Title area, land area allocations, resource documentation,
      supply and demand profiles, historical and projected population and building consent
      information, plus development costing and alternative use structure planning

                                              Property Advisory Ltd
                   51 WestCoast Rd ■ PO Box 16167 ■ Hornby 8441, Christchurch, New Zealand
                      Phone (03) 342 3020 ■ Fax (03) 342 3020 ■ www.propertyadvisory.co.nz
information. We have relied on this information and reserve the right to amend our
assessment if the information or adopted valuation assumptions prove erroneous.
2.0 PROPERTY REPORT
2.1 GENERAL PROPERTY DESCRIPTION
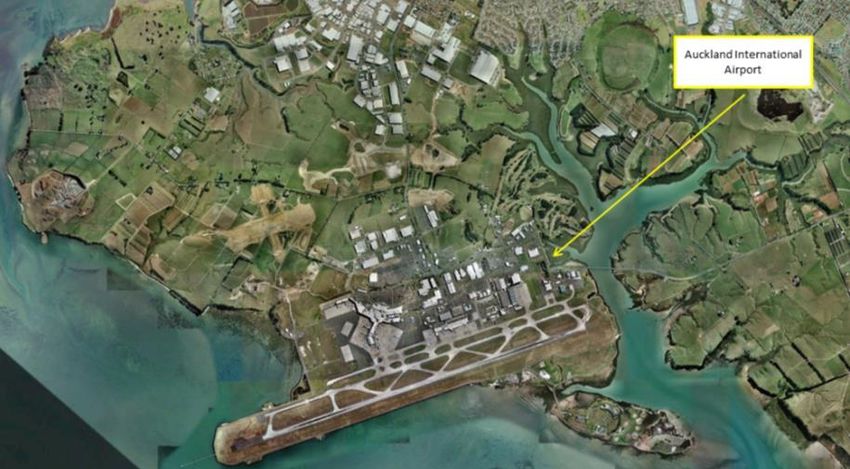
6. The Auckland International Airport is located approximately 21 kilometres south of
central Auckland in the suburb of Mangare. Land uses surrounding the airport comprise
commercial and industrial business, plus lifestyle and farming activities to the north,
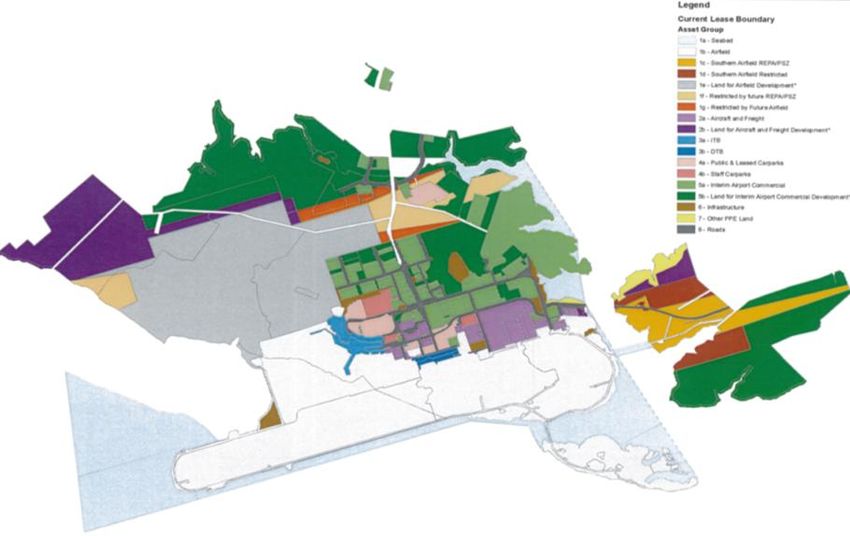
and east. Manukau Harbour flanks the airport to the south and to the west. Figure 1
illustrates the general location of Auckland airport.
Figure 1. Auckland Airport Location Map
7. The airport is operated by AIA, a publicly listed company which has the New Zealand
Government and the Auckland Council as its cornerstone shareholders.
8. Auckland airport is the busiest airport in New Zealand with a total of 31.432m
passengers (6.04m domestic and 7.39m international), and 154,290 aircraft movements
in the year to 30 June 2011.
9. AIA land holdings encompass approximately 1,552 hectares of land of which
approximately 716 hectares is operational airfield, 393 hectares is held for future airfield
development, 169 hectares has been developed and / or leased to third parties, and 275
hectares is vacant and held for future commercial development.
10. Land within the Regulatory Asset Base and subject to this MVAU valuation
encompasses 1,109 hectares (being the operational airfield plus land held for future
development).
11. The current land use configuration of Auckland airport is detailed in Figure 2.
Property Advisory Ltd 2
BARNZ03 – MVAU Land Valuation – Auckland Airport
March 2013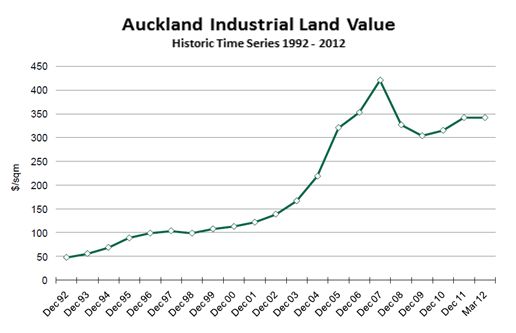
Figure 2. Auckland Airport – Land Use Configuration

       Source:   Common Ground – Alternative Use Report August 2011

Property Advisory Ltd                                                 3
BARNZ03 – MVAU Land Valuation – Auckland Airport
March 2013
12. The airport currently operates a single concrete runway of approximately 3.635
kilometres in length. The adjoining asphaltic concrete taxiway provides utilization as a
runway during emergencies and when the main runway requires maintenance, but is
not sufficiently separated from the main runway to operate simultaneously.
13. We note that much of the runway has an elevation of approximately 7 metres above sea
level and is situated on land that has been reclaimed from Manukau Harbour. This land
has required substantial stabilization and is protected by seawalls.
2.2 LEGAL DESCRIPTION & TENURE
14. We have searched the Land Information New Zealand property database to obtain a
schedule of properties held by AIA. In summary our analysis indicates that AIA hold
approximately 1551.8209 hectares of land.
15. Table 1 summarises the legal description of land held by AIA.
Table 1. AIA – Certificate Of Title Schedule
CT Ref # Title Appellation Area - Ha
1 219885 Lot 3 Deposited Plan 353776 28.7665
2 474467 Lot 2 Deposited Plan 417367 1.4246
3 NA105D/359 Lot 1 Deposited Plan 144042 and Section 1 Survey Office 20.3965
Plan 67433
4 NA106B/643 Lot 1 Deposited Plan 173452 37.5882
5 NA109D/595 Lot 1 Deposited Plan 178161 8.1360
6 NA109D/596 Lot 2 Deposited Plan 178161 2.4980
7 NA1120/171 Lot 2 Deposited Plan 41238 0.0969
8 NA1121/14 Lot 4 Deposited Plan 41238 0.1563
9 NA1138/48 Lot 3 Deposited Plan 41238 0.0943
10 NA1189/51 Lot 1 Deposited Plan 41238 0.0878
11 NA11C/663 Lot 1 Deposited Plan 57642 25.8999
12 NA125B/39 Lot 1 Deposited Plan 196235 0.3233
13 NA125B/98 Lot 2 Deposited Plan 196235 18.4050
14 NA1675/15 Lot 3 Deposited Plan 38518 0.9105
15 NA1691/38 Part Allotment 163 Parish of Manurewa 0.6533
16 NA1B/711 Lot 1 Deposited Plan 51077 6.0703
17 NA24A/830 Lot 2 Deposited Plan 62092 37.8887
18 NA305/113 Lot 15 Deposited Plan 13141 2.0513
19 NA366/26 Part Allotment 89 Parish of Manurewa and Defined On 31.6464
Deposited Plan 13716
20 NA47C/137 Part Allotment 163 Parish of Manurewa 19.6196
21 NA47C/82 Allotment 164 Parish of Manurewa 21.8530
22 NA55A/937 Part Allotment 163 Parish of Manurewa 0.3581
Property Advisory Ltd 4
BARNZ03 – MVAU Land Valuation – Auckland Airport
March 2013Table 1. AIA – Certificate Of Title Schedule - Continued
CT Ref # Title Appellation Area - Ha
23 NA56B/945 Part Lot 2 Deposited Plan 12194 24.7847
24 NA56D/993 Lot 1 Deposited Plan 103178 3.7408
25 NA586/220 Part Allotment 89 Parish of Manurewa and Lot 2 Deposited 44.9201
Plan 125742
26 NA586/221 Part Allotment 89 Parish of Manurewa 40.4686
27 NA58D/290 Lot 1 Deposited Plan 94420 10.0219
28 NA62C/558 Lot 1 Deposited Plan 111094 0.5094
29 NA73B/518 Lot 1 Deposited Plan 125742 0.5566
30 NA78D/181 Part Lot 2 Deposited Plan 32275 11.9056
31 NA78D/182 Lot 1 Deposited Plan 36039 0.2982
32 NA78D/183 Part Allotment 179 Parish of Manurewa 0.2024
33 NA78D/185 Part Allotment 179 Parish of Manurewa 2.6133
34 NA78D/186 Allotment 474 and Allotment 476 Parish of Manurewa 170.0600
35 NA78D/187 Allotment 484 Parish of Manurewa 13.9400
36 NA78D/188 Allotment 482-483 Parish of Manurewa 15.4300
37 NA78D/189 Allotment 477-481 Parish of Manurewa 53.5270
38 NA78D/191 Lot 1 Deposited Plan 46409 36.6342
39 NA78D/192 Lot 2 Deposited Plan 46409 36.6089
40 NA78D/193 Allotment 504 Parish of Manurewa 70.4026
41 NA78D/194 Allotment 492 Parish of Manurewa 0.6085
42 NA78D/195 Allotment 508 Parish of Manurewa 36.4260
43 NA78D/196 Allotment 506 Parish of Manurewa 54.6326
44 NA78D/197 Allotment 328 Parish of Manurewa 0.4426
45 NA78D/198 Allotment 470 Parish of Manurewa and Defined On Survey 313.9000
Office Plan 49515
46 NA78D/199 Allotment 505 Parish of Manurewa and Defined On Survey 0.5975
Office Plan 52973
47 NA78D/200 Allotment 469 Parish of Manurewa and Defined On Survey 40.3600
Office Plan 49514
48 NA78D/201 Allotment 494 Parish of Manurewa 2.7290
49 NA78D/202 Allotment 493 Parish of Manurewa and Defined On Survey 1.3673
Office Plan 49184
50 NA78D/203 Allotment 182-185 Parish of Manurewa 60.2981
51 NA78D/204 Allotment 497 Parish of Manurewa 0.4047
52 NA78D/205 Part Lot 1 Deposited Plan 13104 19.6273
53 NA78D/206 Allotment 543 Parish of Manurewa and Defined On Survey 0.3792
Office Plan 53644
Property Advisory Ltd 5
BARNZ03 – MVAU Land Valuation – Auckland Airport
March 2013Table 1. AIA – Certificate Of Title Schedule - Continued
CT Ref # Title Appellation Area - Ha
54 NA78D/207 Allotment 565 Parish of Manurewa and Defined On Survey 54.2300
Office Plan 60283
55 NA78D/208 Allotment 561 Parish of Manurewa 19.8400
56 NA798/163 Lot 1 Deposited Plan 31279 1.4460
57 NA82C/672 Part Lot 2 Deposited Plan 111094 37.6418
58 NA867/2 Lot 7 Deposited Plan 24346 22.3083
59 NA902/21 Lot 8 Deposited Plan 24346 43.7060
60 NA950/9 Lot 196 Deposited Plan 18037 0.0825
61 NA97D/261 Lot 1 Deposited Plan 162130 0.6984
62 NA985/62 Lot 1 Deposited Plan 28940 38.5463
Total 1,551.8209
16. We note that there are numerous encumbrances registered against the differing
Certificates of Title. The effect of these encumbrances has explicitly been accounted for
in this valuation.
17. As requested we have not attached copies of the Certificates of Title however they are
held on file and are available for reference if required.
18. On review of AIA reports / documentation we note that there is a small discrepancy in
our respective assessments of the land area. AIA documentation indicates a total land
area of 1,552.7 hectares. We have queried this with AIA and as of writing this report we
have not received confirmation as to the correct land area.
19. For valuation purposes we have ignored these differences and adopted a total land area
of 1,551.8209ha and a comparable MVAU land area of 1,109.0 hectares. The balance
land (as advised by AIA) encompasses existing commercial land that is either rented and
leased or held for future development.
20. In accordance with the MVAU methodology this valuation assessment excludes all
partial interests that AIA may have granted or hold in leases (ground plus land and
buildings) with the airport.
Property Advisory Ltd 6
BARNZ03 – MVAU Land Valuation – Auckland Airport
March 20132.3 RESOURCE MANAGEMENT & ZONING
21. AIA land is located within the territorial limits of the Auckland Council, and is governed
by the Auckland Council District Plan (Operative Manukau Section), first made
operative in October 2002.
22. Our review of Auckland Council documentation indicates the majority of AIA land is
within the Airport Activities Zone, with a small portion zoned Mangere Puhinui Rural
and Mangare Puhinui Heritage.
23. Designation 231 extends over the majority of the airport land and is divided into two
areas – Area A which covers the majority of the airport land to the south, and Area B
which covers a smaller northern portion. This designation provides for a wide range of
airport related activities which are essential for the provision of airport related services.
24. Area B to the north allows for a wider range of activities including commercial, retail
and recreational activities which are not provided for in Area A. Airport operations are
recognized in the plan as being significant for the region and the country as a whole.
Residential development is generally a non complying activity within this zone.
25. Development controls within the Airport zone govern hours of operation, noise discharge
levels, runway operations, various building height limitations, the storage of hazardous
substances, and coastal protection measures.
26. The majority of the AIA land is subject to Proposed Plan Change 13 and 14. These
Proposed Plan Changes sought to include the AIA land within the Metropolitan Urban
Limit and to rezone the airports rural land to Airport Activities. WE understand that
all appeals to the Proposed Plan Changes have been resolved and that they will become
operative in the near future.
27. In discussions with council we understand that that there may be some contamination
affecting certain sites within the AIA complex. As discussed we have not undertaken a
geotechnical or environmental audit of the land, and in accordance with Commerce
Commission Decision 709 have excluded the impact of any contamination and
remediation in the MVAU valuation.
28. Please note that we have not searched council records nor compiled a list for Resource
Consents that support the development of the property in its existing use. Furthermore
we have not carried out a survey of the property and assume no responsibility in
connection to such matters.
29. Full copies of the planning documentation as they affect the AIA complex are held on
file, and are available if required.
Property Advisory Ltd 7
BARNZ03 – MVAU Land Valuation – Auckland Airport
March 20133.0 VALUATION OF MVAU LAND
3.1 METHODOLOGY
30. This valuation has been prepared in accordance with the Commerce Commission
Decision 709, entitled “Commerce Act (Specified Airport Services Input Methodologies)
Determination 2010.” Schedule A to Decision 709 sets out the mandatory requirements
for a valuer to apply when undertaking a valuation of land held by an airport for
specified airport purposes.
31. In summary land valuations are required to be performed as if the specified airport land
were to be put to its Highest and Best Alternative Use (HBAU). This is termed Market
Value in the Alternative Use (MVAU).
32. The key concept of MVAU, is that it reflects the most probable use of airport land, other
than for the supply of specified airport services, or a use that is influenced by specified
airport services, which is physically possible, appropriately justified, legally permissible,
financially feasible, and results in the highest valuation of the land in question.
33. Section A10 of Decision 709 sets out the mandatory valuation steps that valuers must
follow when carrying out an MVAU valuation. The mandatory valuation steps are
summarised in Table 2.
Table 2. A10 – Valuation Steps
Valuation Steps - A10
(a) Schedule land to be included in MVAU
(b) Confirm ownership, tenure and aggregated land area
(c ) Determine existing zoning and likely zoning of the land for the HBAU
(d) Consider and determine the HBAU, which must be -
- Physically possible
- Appropriately justified
- Legally permissible and
- Financially feasible
(e ) Consider resource management requirements, amenities in the area and access to services
(f) For notional subdivision / residual value approaches
- Prepare a land development plan (in conjunction with a planner where considered necessary by the valuer).
This should demonstrate the valuers view of the likely HBAU development of the land, and provide
evidence for the assessment of inputs into the notional subdivision / residual value approaches;
- Determine market demand for the proposed development and the time period for the sale or realisation of
the developed land in a notional subdivision or development;
Property Advisory Ltd 8
BARNZ03 – MVAU Land Valuation – Auckland Airport
March 2013Table 2. A10 – Valuation Steps - Continued
Valuation Steps - A10
- Determine the direct costs of developing the land, including roading, supply of services, legal, sales costs etc;
- Determine any indirect costs of developing the land, including developers holding costs etc;
(g) Undertake market research and obtain comparable sales information to support the alternate land uses including
both block sales and developed land sales if both a direct sales comparison and notional subdivision / residual
value approaches are to be used;
(h) Apply suitable adjusted market evidence to airport land as required and taking account of whether a direct sales
comparison and notional subdivision / residual value approaches are to be used;
(i) Reconcile the results of the valuation approaches used and determine a final value for the HBAU; and
(j) Prepare a valuation report, incorporating all disclosures required by the relevant valuation standards.
3.2 VALUATION CONSIDERATIONS
34. In practical terms we have undertaken this MVAU valuation in a way that is consistent
with the valuation of other development land, ie; we have analysed and considered the
prevailing market conditions of supply and demand, population and employment
projections, plus cost and required developer returns, as they relate to the subject and
comparable development land.
35. In accordance with standard valuation practice it is preferable to assess the value of the
identified assets on the basis of comparable sales. Unfortunately however in this
instance due to the scale, location and strategic nature of the proposed development,
there is a paucity of comparable block sales evidence from which to accurately assess its
value.
36. We have therefore used the hypothetical subdivision analysis and discounted cash flow
approach as the primary method to assess the MVAU value of the AIA land.
37. The discounted cash flow approach simulates the subdivision and on-sale of land, taking
into account all costs associated with the development and sale of lots, including a
return to the purchaser for risk and other holding costs. The net present value of the
free cash flows represents the price that a prudent purchaser would be prepared to pay
for the subject land in its present state (block value).
38. In undertaking the hypothetical subdivision analysis we have taken professional
planning and market supply and demand advice from ZPS and ME. As discussed in
Section 4 below under the “Highest & Best Alternative Use” assessment, the airport
complex has been hypothetically split into ten villages and one residual commercial
precinct.
39. Due to the scale of the property we have used a discounted cash flow valuation approach
to assess a “baseline” market value for one village precinct. The value benchmarks ($ per
lot) from this “baseline” assessment have then been applied to the remaining village
Property Advisory Ltd 9
BARNZ03 – MVAU Land Valuation – Auckland Airport
March 2013precincts. To account for differences in village precinct aspect, density, yield and
projected sell down periods, adjustments have been applied to the “baseline” value
benchmarks.
40. As a cross check to the discounted cash flow valuation the block values have been
benchmarked against market evidence of block land.
41. The summation value of the component village precincts less planning and rezoning
costs reflects the estimated current market value of the MVAU block value.
4.0 DETAILED MVAU VALUATION
42. This MVAU valuation follows the steps outlined in Section A10 of Decision 709 (see
Table 2 above).
4.1 (A) & (B) AIAL LAND HOLDINGS
43. In accordance with Section 2.2 above we have adopted an MVAU land area of 1,109.0
hectares.
4.2 (C) & (D) HIGHEST & BEST ALTERNATIVE USE ASSESSMENT
44. Independent planners ZPS were commissioned to assess the HBAU for the AIA land
holding. In accordance with Commerce Commission guidelines (to determine what is
physically possible, appropriately justified and legally permissible on the AIA land) ME
were engaged to undertake a preliminary assessment of the prevailing market
conditions, and to look at the current and projected catchment extent and market size,
including population and employment projections.
45. This market size assessment then provided the basis from which the planning experts
(ZPS and ME), calculated the future demand for a range of different land uses that could
be developed on the AIA land.
46. In discussions with the planning experts we have been advised that the key drivers
influencing the assessment of the HBAU for the AIA land include:
In principle the Auckland airport land is an appropriate site for extensive
residential and non residential development.
The adjoining undeveloped areas to the west and south of Mangere through to
Wiri would have been developed for urban uses were it not for the presence of
the airport, the Mangere Wastewater Treatment Plant and the Wiri Oil
Storage terminal.
ME conclude that the site would allow for a logical extension of the urban
residential area with good proximity to SH20 and the metropolitan centre of
Manukau.
Household and population growth projections prepared by Auckland Council
anticipate growth of 400,000 households in the Auckland Region between 2012
and 2041, at an average of 14,000 per annum. Council expect 15% of this
Property Advisory Ltd 10
BARNZ03 – MVAU Land Valuation – Auckland Airport
March 2013growth to happen over the first 10 (10,000 per annum) years, with the
strongest rate of growth between 2022 and 2031, at an annual average of
19,000 households per annum. Council also estimate that the southern area of
the region will accommodate growth of 145,000 households until 2041 (70,000
in the urban area and 75,000 in the non-urban area).
47. On the basis of this analysis, Tables 3 and 4 schedules the planning experts’ assessment
of the HBAU land use allocation for the AIA land.
Table 3. ZPS & ME – HBAU Land Use Allocation (ha)
Description Gross Land Area Net Land Area -Amount Of Activity
Commercial Residential Total Commercial Residential Total
Base Residential 641.2 641.2 477.7 477.7
Non-Centre’s Based Commercial 9.4 9.4 7.0 7.0
Centre’s Based Commercial 26.0 26.0 19.3 19.3
School’s 48.3 48.3 43.9 43.9
Open Space & Arterial Roading 152.7 152.7
Seabed 231.7 231.7
TOTAL AIA 83.6 641.2 1,109.2 70.2 477.7 932.3
Table 4. ZPS & ME – HBAU Land Use Activity Allocation
Description Amount Of Activity
Commercial Floor Residential Population Dwelling Density /
Space (GFA m²) Dwellings ha
Base Residential 16,030 40,075 25
Non-Centres Based Commercial 36,430
Centres Based Commercial 67,700
Schools 73,720
Open Space & Arterial Roading
Seabed
TOTAL AIA 177,850 16,030 40,075 25
48. A copy of the ME and ZPS reports detailing the HBAU of the AIA land are attached as
Appendices I and II to this report.
Property Advisory Ltd 11
BARNZ03 – MVAU Land Valuation – Auckland Airport
March 20134.3 (E) RESOURCE MANAGEMENT / AMENITIES / DEVELOPMENT MIX
49. In accordance with sound development practices it is anticipated that the HBAU
development of the AIA land would be undertaken in an integrated and comprehensive
manner.
50. The HBAU structure plan / land use allocation prepared by the planning experts
proposes to develop an integrated mixed density residential community that offers a
high level of amenity, quality community assets, usable green space areas, with
commercial, schooling and retail centre activities.
51. Environmental outcomes anticipated include:
An urban form which creates a sense of place and encourages a community to
develop.
A safe, comfortable and healthy living environment.
Integration of the roads within the new neighborhood area with existing
arterial roads and public transport routes.
An integrated road network that supports effective and efficient public
transport.
An efficient and effective cycle and pedestrian network that connects with
existing and potential facilities.
Provision of a network of open spaces integrated with cycle and pedestrian
facilities.
Opportunities for a wide variety of residential development forms of low,
medium and high residential densities.
Medium density development offering housing located in conjunction with a
core of community facilities and having ready access to public transport.
Medium density buildings which relate well to each other and to adjoining
public and private open space.
A development that meets City Plan policies to achieve an overall increase in
residential density, urban consolidation and a compact urban form.
Provisions to enable neighborhood retail, community, or medical facilities to be
located within walkable distance of any part of the zone, or be within walkable
distance of a bus stop within the zone.
Provision of neighborhood shopping facilities.
Provision of community footprint and business facilities.
A sustainable storm water disposal system integrated with open space,
reserves, pedestrian and cycle facilities.
Property Advisory Ltd 12
BARNZ03 – MVAU Land Valuation – Auckland Airport
March 2013 The establishment of an overall development concept that provides a defined
basis for integrated development of this area.
Protection of groundwater resource from contamination.
52. Based on the HBAU structure plan, approximately 16,030 residential dwellings,
104,130m² of net useable commercial space (GFA – Non Centres and Centres based
commercial space – Table 4), and 13 schools will be hypothetically developed on the
1,109.2 hectare property.
53. We have been advised by ZPS that it will take between 1.5 to 2 years to obtain the
necessary approvals (plan change to convert Airport zone to a Residential zone), to allow
the mixed density residential development to occur on the AIA land.
54. As part of the plan change process ME note there is the possibility that Auckland
Council may attempt to stage any HBAU development on the AIA in order to mitigate
adverse effects on other initiatives outlined in the plan. However, given that the airport
land is located within the ‘Southern Initiative’ zone and can provide for a large tract of
residential development in a market that requires capacity for this land use, this may
provide support to any Plan Change applications.
55. ZPS have advised us that it will cost approximately $2.5m to undertake the private plan
change. Further from a time perspective once the planning approvals have been
obtained it would take approximately 1 year to finalise the design and install all
earthworks and infrastructure (water, utilities etc), before titles are able to be issued.
56. Consistent with AIA’s planning experts; ZPS recommend that the logical development of
the MVAU land would follow a series of residential village precincts.
57. For valuation purposes and subject to changes in the land use allocations ZPS have
adopted the Common Ground “Indicative Structure Plan.”
58. A copy of the HBAU Indicative Structure Plan is detailed in Figure 3 on the following
page.
Property Advisory Ltd 13
BARNZ03 – MVAU Land Valuation – Auckland Airport
March 2013Figure 3. ZPS / ME – Indicative HBAU Structure Plan For AIA Land
Source: Common Ground – Alternative Use Report August 2011
Property Advisory Ltd 14
BARNZ03 – MVAU Land Valuation – Auckland Airport
March 20134.4 (F) & (G) VALUATION INPUTS - NOTIONAL SUBDIVISION APPROACH
59. As detailed in Section 3.2 above due to the scale, location and strategic nature of the
proposed HBAU development of the AIA land, there is a paucity of comparable sales
evidence from which to accurately assess the block value of the property on a MVAU
basis. We have therefore used the hypothetical subdivision analysis and discounted cash
flow approach as the primary method to assess the MVAU of the AIA land.
60. Under the hypothetical subdivision valuation approach we have calculated a “baseline”
market value for one village precinct (Puhinui Village being approximately 120.9 ha).
The value benchmarks ($ / dwelling typology / lot) from this “baseline” assessment have
then been applied to the remaining village precincts. To account for differences in village
precinct aspect, density, yield and projected sell down periods, adjustments have been
applied to the “baseline” value benchmarks.
61. In accordance with standard valuation practice the key inputs to the discounted cash
flow approach include:
Development of a hypothetical development plan,
Estimation of gross realisations of individual allotments,
Determination of appropriate realisation periods / market absorption,
Calculation of development costs, and
Assessment of an appropriate discount rate.
4.4.1 HYPOTHETICAL DEVELOPMENT PLAN
62. In accordance with advice received from ZPS we have adopted the notional HBAU
structure plan and land use allocation as detailed in Section 4.2 above.
63. The HBAU land use activity by type and precinct is scheduled in Table 5 on the
following page.
Property Advisory Ltd 15
BARNZ03 – MVAU Land Valuation – Auckland Airport
March 2013Table 5. HBAU Land Area By Activity Type & Precinct (Ha)
Precincts Gross Internal Net Land Centres Non Education Total
Land Area Roads & Area Based Centres NLA Residential
Reserves Commercial Based NLA
NLA Commercial
NLA
Puhinui Village 120.9 28.2 92.7 1.4 11.0 80.3
Waterfront Village 87.6 22.3 65.3 2.0 63.3
Wiroa Village 25.3 6.6 18.7 18.7
Urban Centre 89.0 20.4 68.6 4.2 6.2 58.1
Marine Village 30.8 7.5 23.3 2.0 21.3
Urban Village 73.3 18.5 54.8 2.0 52.8
Golf Village 28.2 6.8 21.4 2.0 19.4
Harbour Edge 184.5 46.0 138.5 1.4 6.0 131.1
Eastern Centre Gateway 30.2 7.3 22.9 2.0 20.9
Productive Village 18.0 4.2 13.8 2.0 11.8
Other Commercial 37.0 9.0 28.0 13.0 15.0
Totals 724.8 176.9 547.9 7.0 19.2 44.0 477.7
Net Land Area (NLA)
64. In accordance with planning advice the residential areas have been further apportioned
by dwelling typology (detached, urban houses, semi-detached, terraced, and apartments)
within each precinct. The average lots sizes adopted in this HBAU analysis include:
Detached – 600m²
Urban House – 400m²
Semi-Detached – 300m²
Terraced – 200m²
Apartments – 125m²
65. On the basis of discussions with local industry participants and planning experts the
land use allocation for apartments has been further split to allow for high density
retirement living. In this analysis we have allowed for 2 x 6 hectare retirement villages
to be developed. These units may encompass a combination of independent living units,
apartments, and care beds.
66. On the basis of a total residential capacity of 16,030 households (25 dwellings per
hectare), the adopted dwelling yield by housing typology and precinct are summarised in
Table 6 on the following page.
Property Advisory Ltd 16
BARNZ03 – MVAU Land Valuation – Auckland Airport
March 2013Table 6. HBAU Residential Land Area - Dwelling Yield By Housing Typology & Precinct
Precincts Detached Urban House Semi Detached Terraced Apartments Retirement Ap. Indicative Gross
Yield Density
% Yield % Yield % Yield % Yield % Yield % Yield
Puhinui Village 30.0% 401 30.0% 602 25.0% 669 5.0% 201 2.5% 161 7.5% 482 2,516 23
Waterfront Village 15.0% 158 20.0% 317 30.0% 633 30.0% 950 5.0% 253 0.0% 0 2,312 27
Wiroa Village 50.0% 156 40.0% 187 10.0% 62 0.0% 0 0.0% 0 0.0% 0 406 16
Urban Centre 0.0% 0 0.0% 0 30.0% 581 49.4% 1,434 10.7% 495 10.0% 465 2,976 38
Marine Village 0.0% 0 20.0% 107 45.0% 320 30.0% 320 5.0% 85 0.0% 0 831 29
Urban Village 20.0% 176 30.0% 396 30.0% 528 15.0% 396 5.0% 211 0.0% 0 1,706 24
Golf Village 15.0% 48 15.0% 73 20.0% 129 35.0% 339 15.0% 233 0.0% 0 822 32
Harbour Edge 30.0% 655 40.0% 1,311 20.0% 874 5.0% 328 5.0% 524 0.0% 0 3,691 21
Eastern Centre Gateway 40.0% 139 25.0% 130 35.0% 243 0.0% 0 0.0% 0 0.0% 0 513 18
Productive Village 50.0% 99 40.0% 118 10.0% 39 0.0% 0 0.0% 0 0.0% 0 257 16
Other Commercial 0 0 0 0 0 0 0
Totals 1,833 3,240 4,079 3,968 1,962 947 16,030 25
Property Advisory Ltd 17
BARNZ03 – MVAU Land Valuation – Auckland Airport
March 20134.4.2 GROSS REALISATIONS
67. In assessing the gross realisations under the HBAU structure plan we have researched
and analysed sales in greater Auckland, liaised with local industry participants, and have
had regard to the current residential, business and retail markets.
68. On the basis of our comparable sales analysis contained in Appendix III to this report we
have adopted the following “baseline” gross realisations for the Puhinui Village.
Table 7. HBAU – Gross Realisations – Puhinui Village
Land Use Allocation Gross Realisations
Dwelling Type
(a) Detached $350,000 / lot inc GST
(b ) Urban House $280,000 / lot inc GST
(c ) Semi-Detached $250,000 / lot inc GST
(d) Terraced $185,000 / lot inc GST
(e) Apartments $80,000 / lot inc GST
Commercial $400/m² plus GST
Retirement Village / Apartments $200 / m² plus GST
Education $200 / m² plus GST
Other – Roads / Reserves nil
69. We note that no value has been ascribed to 152.7 hectares of land identified for open
space reserves and arterial roading, or the 231.7 hectares of seabed. The value of these
land assets is implicitly included in the value of other AIA land (the Village precincts),
under the HBAU valuation construct.
70. Our research indicates that over the medium to long term that land values / median
section prices have typically increased at a rate in excess of the rate of general CPI
inflation. Consistent with our analysis of comparable block sales we have applied an
appreciation factor to the base gross realisation scheduled in Table 7.
71. Our analysis of historical land / residential section appreciation in greater Auckland
relative to the general CPI is illustrated in Figure 4.
Property Advisory Ltd 18
BARNZ03 – MVAU Land Valuation – Auckland Airport
March 2013Figure 4. Land Value Appreciation Analysis – Auckland Median Section Price v CPI Index
Source- Real Estate Institute Of New Zealand Statistics
72. Converting this analysis into a tabular format indicates that median section prices in
Auckland have increased at an annual rate of approximately 8.78% over the last 10 years,
whilst the CPI has increased a rate of 2.82% per annum.
Table 8. Average Land Appreciation Analysis - Median Section Price v CPI Index
Period Greater Auckland Manukau City CPI
5yr Average 3.10% 1.41% 2.55%
10yr Average 8.78% 7.82% 2.82%
73. Due to the current market environment we have adopted a conservative land appreciation
/ growth rate across all land classes of 2.5% per annum.
Property Advisory Ltd 19
BARNZ03 – MVAU Land Valuation – Auckland Airport
March 20134.4.3 REALISATION PERIOD
74. Preliminary analysis on the commercial realities of developing an integrated residential
and commercial community on the AIA land has been carried out by ME and ZPS.
75. Key demand and timing recommendations are summarised as follows:
It will take between 1.5 to 2 years to obtain the necessary approvals (plan
change to convert Airport zone to a Residential zone).
Residential sections (and therefore household growth) will develop at the annual
average of 800 households.
On the assumption that approximately 10,000 new dwelling are required every
year to meet population growth it is envisaged that the hypothetical
development of the AIA land could obtain a 8% regional market share.
It is estimated that 13 schools will be required as part of the integrated
development - 9 primary, 2 intermediate, and 2 secondary schools. Schools will
need to be provided to attract residents.
Centres-based retail and office space will be provided commensurate with
population growth.
It is envisaged that land for 2 retirement villages will be sold in a block state
with base roading and services to the boundary.
76. As a cross check to this analysis, in a residential context we have analysed Statistics New
Zealand building consent data to establish historical absorption rates. A summary of this
analysis is detailed in Table 9 on the following page.
77. Analysis of Table 9 indicates that over the last ten years there were an average of 6,520
residential dwellings per annum consented in the Auckland Region. As with section sales,
we note a high level of activity through the early to mid 2000’s, before a decrease in
activity due to the global financial crisis.
78. Currently it is well recognised that there is a significant undersupply of houses in the
Auckland Region.
Property Advisory Ltd 20
BARNZ03 – MVAU Land Valuation – Auckland Airport
March 2013Table 9. Statistics New Zealand – Auckland Building Consent Data – Residential Dwellings
Year Rodney North Waitakere Auckland Manukau Papakura Franklin Total Auckland
District Shore City City City City District District District
2000 812 1,268 1,316 2,077 1,797 275 354 7,899
2001 773 1,162 1,177 2,422 2,194 152 310 8,190
2002 1,239 1,662 1,537 4,578 2,496 305 463 12,280
2003 1,395 1,317 1,542 3,536 2,724 310 610 11,434
2004 1,163 1,304 1,025 5,622 2,146 267 760 12,287
2005 1,021 1,017 777 2,280 1,863 333 542 7,833
2006 821 1,244 843 1,873 1,698 239 623 7,341
2007 727 1,049 697 1,747 1,198 126 745 6,289
2008 717 430 608 1,438 715 163 349 4,420
2009 604 549 514 916 541 199 234 3,557
2010 599 569 443 897 623 260 290 3,681
2011 598 603 414 1,172 657 191 137 3,772
2012 901 545 554 1,246 746 358 231 4,581
Totals 11,370 12,719 11,447 29,804 19,398 3,178 5,648 93,564
5yr Average 684 539 507 1,134 656 234 248 4,002
10yr Average 855 863 742 2,073 1,291 245 452 6,520
79. In cross check on the supply side equation we usually review vacant land survey data
collected by the Local Authority. We have been in discussions with Local Authorities and
have requested this information, however as of writing this report this data has not been
provided to us.
80. In summary based on the available information, we envisage that the demand for vacant
allotments as proposed by ZPS and ME under the HBAU development scenario will
attract approximately 8% of the total demand. This equates to sales of approximately 800
residential allotments per annum.
Property Advisory Ltd 21
BARNZ03 – MVAU Land Valuation – Auckland Airport
March 20134.4.4 DEVELOPMENT COSTS
81. Development costs include:
Construction Costs ,
Resource Management / Consenting Costs,
Local Authority Fees / Development Contributions,
Marketing / Legal Costs,
Local Authority Rates, and
Management.
CONSTRUCTION COSTS
82. We understand that due to timing constraints BARNZ have been unable to employ the
services of a quantity surveyor to prepare detailed construction cost estimates for the
hypothetical subdivision of the AIA land.
83. For valuation purposes we have therefore had to estimate the HBAU construction costs
with reference to industry benchmarks and valuer observed development costs for other
land developments.
84. To confirm or otherwise these cost estimates we recommend that a quantity surveyor be
engaged to prepare detailed costings. We reserve the right to amend our assessment if the
resultant costs differ materially from our cost estimates.
85. Our estimate of aggregated average development costs includes all civil, earthworks,
development contributions, local authority rates, plus a 10% contingency margin, and are
summarised as follows:
Residential lots - $65,000.
Commercial land - $57 / m².
Retirement Village land - $57 / m²
Education land - $40 / m².
Average rate - $1,164,000 / hectare.
RESOURCE MANAGEMENT / CONSENTING COSTS
86. We have been advised by ZPS that it would take between 18 and 24 months and cost
approximately $2,500,000, to obtain the necessary approvals (plan change to convert
Airport Precinct zone to a Residential zone), to allow the mixed density residential
development to occur on the AIA land.
Property Advisory Ltd 22
BARNZ03 – MVAU Land Valuation – Auckland Airport
March 2013MARKETING / LEGAL COSTS
87. Selling costs have been calculated on the basis of a 2.0% commission, plus a marketing
allowance equaling 1% of the gross realisation.
88. Legal costs of preparing sale and purchase agreements and conveyancing have been set at
$1,000 per dwelling unit.
MANAGEMENT
89. A project management allowance has been assessed on a precinct basis. In the baseline
assessment for Puhinui Village management costs have been set at $350,000 per annum.
LOCAL AUTHORITY FEES / DEVELOPMENT CONTRIBUTIONS
90. Development contributions have been set at $9,750 per residential dwelling allotment.
LOCAL AUTHORITY RATES
91. A project management allowance has been assessed on a precinct basis. In the baseline
assessment for Puhinui Village Local Authority rates have been assessed at $250,000 per
annum.
SEA WALL
92. On inspection we identified a number of sea walls fronting Manukau Harbor, which have
been developed to protect the airport complex from erosion and support aircraft
movements. These protection assets are located on AIA land and are currently
maintained by AIA.
93. We have assumed for HBAU valuation purposes that these structures will either
redeveloped as beaches or maintained as a seawalls and vested to the Local Authority as
public reserve, at no cost.
4.4.5 DISCOUNT RATE SELECTION
94. The discount rate reflects the annualised rate of return that an investor would require
from undertaking the proposed development. In practical terms profit and risk margins
analysed from comparable transactions fluctuate relative to the following factors:
The size and scale of the development,
The potential development mix,
The complexity of design and marketability,
The consent-ability and level of planning risk involved,
The state of the market and effective competition,
The availability and security of investment,
Comparative returns available from other investments,
Expectations surrounding future capital appreciation, and
The weight of capital employed in the development.
Property Advisory Ltd 23
BARNZ03 – MVAU Land Valuation – Auckland Airport
March 201395. In summary the greater the risk being carried by the developer, the greater the required
return / profit and risk allowance.
96. Due to the unique nature and scale of the proposed HBAU development there is little
transactional evidence from which direct comparisons can be made. Our analysis of
smaller urban development land transactions indicates that the required return / profit
and risk allowances range from 10% to 40% of outlay. This has increased in recent years
as the global financial crisis has put pressure on property values and reduced funding
liquidity.
97. On the basis of analysis of urban development land transactions and discussions with
major property developers, we have assessed the pre-tax nominal discount rate to be 27%.
4.5 (H) & (I) MVAU - DISCOUNTED CASH FLOW VALUATION
98. As discussed above the discounted cash flow approach simulates the subdivision and on-
sale of land, taking into account all costs associated with the development and sale of lots,
including a return to the purchaser for risk and other holding costs. The net present value
of the free cash flows represents the price that a prudent purchaser would be prepared to
pay for the subject land in its present state.
99. Under the hypothetical subdivision valuation approach we have calculated a “baseline”
market value for one village precinct (Puhinui Village being approximately 120.9 ha), and
then applied the value benchmarks ($ / dwelling typology / lot) from this “baseline”
assessment to the remaining village precincts.
100. To account for differences in village precinct aspect, density, yield and projected sell down
periods, adjustments have been applied to the “baseline” value benchmarks.
101. A summary of the key inputs adopted in the MVAU valuation of the “baseline” Puhinui
Village land are contained in Table 10.
Table 10. Baseline MVAU Development Inputs – Puhinui Village
Description Totals
Revenue
Detached - 401 lots @ 600m² 157,348,685
Urban House - 602 lots @ 400m² 188,818,422
Semi Detached - 669 lots @ 300m² 186,971,142
Terraced - 201 lots @ 200m² 41,585,010
Apartments - 161 lots @ 125m² 14,386,165
Retirement Apt. – 60,218m² @ 200/m² 12,970,423
Commercial – 14,006m² @ 400/m² 5,961,701
Education – 110,000m² @ 200/m² 24,285,549
Total Revenue - Base 632,327,098
Property Advisory Ltd 24
BARNZ03 – MVAU Land Valuation – Auckland Airport
March 2013Table 10. Baseline MVAU Development Inputs – Puhinui Village - Continued
Description Totals
Expenses
Legal & Sales Expenses 21,003,832
GST 76,840,360
Development Expenses 153,483,557
Total Expenses - Base 251,327,749
Variables
Pre-Tax Nominal Required Rate of Return 27.00%
Land Appreciation Rate 2.50%
Development Cost Escalation Factor 2.50%
Development Period 9 Years
102. Having regard to the above inputs we have assessed the “baseline” value of the 120.9
hectare Puhinui Village land to be $147,900,000, plus GST.
103. The value benchmarks (by land use and dwelling typology) that have been applied to the
other nine village precincts within the airport complex, have been calculated by
multiplying the “baseline” value of the Puhinui Village by their gross realisation
percentage, and then dividing this figure by either land area or the number residential
lots.
104. The allocation of the “baseline” Puhinui Village valuation and resulting value
benchmarks are summarised in Table 11.
Table 11. “Baseline” Land Value Apportionment – Adopted Benchmark Values ($ / lot & $ / m²)
Description Gross % Allocation Land Value Adopted
Realisation Of Gross Apportionment $ Benchmark
Estimate $ Realisation Values $ / Lot
$ / m²
Detached - 401 lots @ 600m² 136,824,944 24.63% 36,430,049 90,746 / lot
Urban House - 602 lots @ 400m² 164,189,932 29.56% 43,716,059 72,597 / lot
Semi Detached - 669 lots @ 300m² 162,583,602 29.27% 43,288,369 64,698 / lot
Terraced - 201 lots @ 200m² 36,160,878 6.51% 9,627,942 47,966 / lot
Apartments - 161 lots @ 125m² 12,509,709 2.25% 3,330,747 20,742 / lot
Retirement Apt. – 60,218m² @ 200/m² 12,970,423 2.33% 3,453,414 57 / m²
Commercial – 14,006m² @ 400/m² 5,961,701 1.07% 1,587,321 113 / m²
Education – 110,000m² @ 200/m² 24,285,549 4.37% 6,466,100 59 / m²
Total Revenue - Base 555,486,738 100.00% 147,900,000
$ / Potential Residential Lot 58,650
Property Advisory Ltd 25
BARNZ03 – MVAU Land Valuation – Auckland Airport
March 2013$ Per hectare 1,223,325
105. As part of this valuation adjustments have been made to the “baseline” value benchmarks
to reflect aspect, density, and yield etc; plus projected sell down periods and a one off
$2.5m adjustment for consenting costs.
106. Table 12 on the following page summarises the MVAU valuation of the AIA land by
Village precinct.
Property Advisory Ltd 26
BARNZ03 – MVAU Land Valuation – Auckland Airport
March 2013Table 12. MVAU – Summation Valuation By Precinct
Precincts Gross Residential Indicative Gross Commercial Deferment Development Notional Value $/ha Deferment $/ha
Area Adjustment Residential Density Land ha yrs Start Date Value
Factor % Yield
1/07/2011 10%
Puhinui Village (Base) 120.9 0% 2,516 23 12.4 2 1/07/2013 147,900,000 1,223,325 122,231,405 1,011,012
Waterfront Village 87.6 5% 2,312 27 2.0 2 1/07/2013 136,811,709 1,561,778 113,067,528 1,290,725
Wiroa Village 25.3 50% 406 16 0.0 6 1/07/2017 47,680,902 1,884,621 26,914,626 1,063,819
Urban Centre 89.0 0% 2,976 38 10.5 6 1/07/2017 131,853,470 1,481,500 74,427,846 836,268
Marine Village 30.8 15% 831 29 2.0 11 1/07/2022 53,524,531 1,737,809 18,760,022 609,092
Urban Village 73.3 0% 1,706 24 2.0 12 1/07/2023 103,358,043 1,410,069 32,933,058 449,291
Golf Village 28.2 30% 822 32 2.0 14 1/07/2025 52,056,798 1,845,986 13,708,182 486,106
Harbour Edge 184.5 0% 3,691 21 7.4 15 1/07/2026 242,833,992 1,316,173 58,132,527 315,081
Eastern Centre Gateway 30.2 20% 513 18 2.0 20 1/07/2031 46,589,225 1,542,690 6,925,191 229,311
Productive Village 18.0 20% 257 16 2.0 21 1/07/2032 25,298,799 1,405,489 3,418,641 189,925
Other Commercial 37.0 0% 0 0 28.0 1/07/2011 23,514,423 635,525 23,514,423 635,525
Open Space & Arterial
Roading 152.7
Seabed 231.7
Totals 1,109.2 16,030 25 70 136,811,709 1,561,778 113,067,528 1,290,725
Less Consenting Costs 2,500,000
MVAU Estimate 491,533,450 678,164
Property Advisory Ltd 27
BARNZ03 – MVAU Land Valuation – Auckland Airport
March 2013107. In assessing the MVAU land value of the AIA complex we have followed the guidelines
put forward by the Commerce Commission in Decision 709 and taken professional
advice from planners and market economists. In addition we have liaised with the Local
Authority and major industry participants to arrive at an independent assessment of the
HBAU of the AIA complex.
108. This valuation has also been undertaken in accordance with the Commerce
Commission’s requirements for the conduct of expert witnesses.
109. As part of this MVAU valuation we have analysed and considered the prevailing market
conditions of supply and demand, population and employment projections, plus cost and
required developer returns as they relate to the subject and comparable development
land.
110. In accordance with standard valuation practice it is preferable to assess the value of the
identified assets on the basis of comparable sales. Unfortunately however in this
instance due to the scale, location and strategic nature of the proposed AIA
development, there is a paucity of comparable sales evidence. We have therefore used
the hypothetical subdivision analysis and discounted cash flow approach as the primary
method to assess the MVAU value of the AIA land.
111. On the basis of the available information it is our opinion that the MVAU of the 1,109.2
hectare AIA property as at 30 June 2011 was:
Four Hundred & Ninety One Million Five Hundred Thousand Dollars
(Plus GST if any)
$491,500,000
112. Table 13 apportions the MVAU valuation within the AIA property.
Table 13. MVAU Apportionment – AIA Land
Description Gross Area ha MVAU Value $ / Ha
Estimate $
Precinct Land 724.8 $491,500,000 $678,118
Open Space & Arterial Roading 152.7 $0 $0
Seabed 231.7 $0 $0
Total 1,109.2 $491,500,000 $443,112
113. We refer you to Appendix IV and V which contains our detailed discounted cash flow
worksheets and our standard valuation policies upon which this assessment is based.
Property Advisory Ltd 28
BARNZ03 – MVAU Land Valuation – Auckland Airport
March 20135.0 COMPLIANCE STATEMENT & DISCLOSURES
This valuation has been prepared having regard to the High Court Code of Conduct
for preparation of expert evidence, plus International Valuation Standard 3 of the
Australia and New Zealand Valuation and Property Standards . We confirm the
following:
To the best of our knowledge the statements of fact presented in this report are
correct,
The analysis and conclusions in the report are limited only by the reported
assumptions and conditions,
Property Advisory Ltd has no direct pecuniary or other interest in the property
being valued,
Our fee is not contingent upon any aspect of the report,
The valuation has been prepared in accordance with the Property Institute of New
Zealand / New Zealand Institute of Valuers Code of Ethics, Rules of Conduct and
Valuation Standards,
The Valuer has satisfied professional education requirements,
The Valuer has experience in the location and category of the property being valued,
The Valuer has made a personal inspection of the property;
No one, except those specified in the report, has provided professional assistance in
preparing the report.
114. If you have any queries regarding this assessment please do not hesitate to contact us.
Yours faithfully
Property Advisory Ltd
K D Smith
B.Com VPM, MNZPI
Registered Valuer
Director
Property Advisory Ltd 29
BARNZ03 – MVAU Land Valuation – Auckland Airport
March 2013Attachment I
Market Economic Report
Auckland Airport
Alternative Use Scenario Review
Property Advisory Ltd 30
BARNZ03 – MVAU Land Valuation – Auckland Airport
March 2013Property Advisory Ltd 31 BARNZ03 – MVAU Land Valuation – Auckland Airport March 2013
Property Advisory Ltd                              32
BARNZ03 – MVAU Land Valuation – Auckland Airport
March 2013
Property Advisory Ltd                              33
BARNZ03 – MVAU Land Valuation – Auckland Airport
March 2013
Property Advisory Ltd                              34
BARNZ03 – MVAU Land Valuation – Auckland Airport
March 2013
Property Advisory Ltd                              35
BARNZ03 – MVAU Land Valuation – Auckland Airport
March 2013
Property Advisory Ltd                              36
BARNZ03 – MVAU Land Valuation – Auckland Airport
March 2013
Property Advisory Ltd                              37
BARNZ03 – MVAU Land Valuation – Auckland Airport
March 2013
Attachment II

                       Zomac Planning Solutions

                           Auckland Airport
                      Alternative Use Evaluation
                             Assessment

Property Advisory Ltd                               38
BARNZ03 – MVAU Land Valuation – Auckland Airport
March 2013
Property Advisory Ltd 39 BARNZ03 – MVAU Land Valuation – Auckland Airport March 2013
Property Advisory Ltd                              40
BARNZ03 – MVAU Land Valuation – Auckland Airport
March 2013
Attachment III

                         Auckland Sales Analysis

Property Advisory Ltd                               41
BARNZ03 – MVAU Land Valuation – Auckland Airport
March 2013
COMPARABLE SALES ANALYSIS
116. In assessing the gross realisations under the HBAU structure plan we have researched
and analysed sales in greater Auckland and have liaised with local industry
participants.
117. The following paragraphs summarise our comparable sales analysis:
RESIDENTIAL
Table 1. Residential Allotment Sales
Location Sale Date Sale Price Land Rate
area per m²
Dannemora
16 Lucca Cres May-10 $299,000 449 $666
7 Agapanthus Pl May-10 $170,000 206 $825
19 Agapanthus Pl May-10 $170,000 230 $739
2 Michael Richard Pl May-10 $536,000 750 $715
11 Bejoy Rise Nov-10 $500,000 714 $700
8 Verley Rise Mar-11 $430,000 765 $562
25 Woolaston Pl Mar-11 $400,000 747 $535
East Tamaki Heights
11 Bushpark Pl Jun-10 $155,000 200 $775
33 Erica Rd Jun-10 $195,000 384 $508
Lot 43 Ravello Rise Jun-10 $290,000 538 $539
6 Ravello Rise Aug-10 $370,000 901 $411
4 Ravello Rise Sep-10 $380,000 1037 $366
8 Ravello Rise Nov-10 $360,000 1192 $302
2 Ravello Rise Mar-11 $349,000 1300 $268
5A Kinmont Rise Mar-11 $435,000 1021 $426
93 Gracechurch Dr Jun-11 $420,000 771 $545
Flat Bush
Lot 7 Aviano Cl Feb-11 $286,957 519 $553
3 Coolaghy Dr Feb-11 $271,000 474 $572
73 Killarney St Mar-11 $245,000 452 $542
Lot 13 Coolaghy Dr Mar-11 $290,000 420 $690
Lot 25 Silvana Dr Apr-11 $260,000 465 $559
7 coolaghy May-11 $315,000 498 $633
2 Creeve May-11 $303,000 434 $698
4 Alexia Pl May-11 $295,000 556 $531
14b Ravello Rise May-11 $329,000 461 $714
17 Alexia Pl May-11 $212,500 547 $388
Property Advisory Ltd 42
BARNZ03 – MVAU Land Valuation – Auckland Airport
March 2013You can also read