Restoration Trajectories and Ecological Thresholds during Planted Urban Forest Successional Development
←
→
Page content transcription
If your browser does not render page correctly, please read the page content below
Article
Restoration Trajectories and Ecological Thresholds during
Planted Urban Forest Successional Development
K. J. Wallace * , Bruce D. Clarkson and Bridgette Farnworth

                                          Environmental Research Institute, University of Waikato, Private Bag 3105, Hamilton 3240, New Zealand;
                                          clarkson@waikato.ac.nz (B.D.C.); bridgette.farnworth@outlook.com (B.F.)
                                          * Correspondence: kwallace@waikato.ac.nz

                                          Abstract: Successfully reconstructing functioning forest ecosystems from early-successional tree
                                          plantings is a long-term process that often lacks monitoring. Many projects lack observations of
                                          critical successional information, such as the restoration trajectory of key ecosystem attributes and
                                          ecological thresholds, which signal that management actions are needed. Here, we present results
                                          from a 65 ha urban temperate rainforest restoration project in Aotearoa New Zealand, where trees
                                          have been planted annually on public retired pasture land, forming a 14 years chronosequence. In
                                          25 plots (100 m2 each), we measured key ecosystem attributes that typically change during forest
                                          succession: native tree basal area, canopy openness, non-native herbaceous ground cover, leaf litter
                                          cover, ground fern cover, dead trees, and native tree seedling abundance and richness. We also
                                          monitored for the appearance of physiologically-sensitive plant guilds (moss, ferns, and epiphytes)
                                          that may be considered ecological indicators of succession. Linear regression models identified
                                          relationships between all but one of the key ecosystem attributes and forest age (years since planting).
                                          Further, using breakpoint analysis, we found that ecological thresholds occurred in many ecosystem
                                attributes during their restoration trajectories: reduced canopy openness (99.8% to 3.4%; 9.6 years

                                          threshold), non-native herbaceous ground cover (100% to 0; 10.9 years threshold), leaf litter cover
Citation: Wallace, K.J.;
Clarkson, B.D.; Farnworth, B.
                                          (0 to 95%; 10.8 years threshold), and increased tree deaths (0 to 4; 11 years threshold). Further, juvenile
Restoration Trajectories and              native plant recruitment increased (tree seedling abundance 0 to ~150 per 4 m2 ), tree seedling species
Ecological Thresholds during Planted      richness (0 to 13 per 100 m2 ) and epiphytes colonized (0 to 3 individuals per 100 m2 ). These and other
Urban Forest Successional                 physiologically-sensitive plant guilds appeared around the 11 years mark, confirming their utility as
Development. Forests 2022, 13, 199.       ecological indicators during monitoring. Our results indicate that measurable, ecological thresholds
https://doi.org/10.3390/f13020199         occur during the restoration trajectories of ecosystem attributes, and they are predictable. If detected,
Academic Editor: Francisco
                                          these thresholds can inform project timelines and, along with use of ecological indicators, inform
J. Escobedo                               management interventions.

Received: 22 November 2021                Keywords: urban restoration; urban ecology; forest succession; tree regeneration; restoration ecology;
Accepted: 20 January 2022
                                          ecological threshold; ecological function; ecological indicators; ecological trajectory; restoration trajectory
Published: 27 January 2022

Publisher’s Note: MDPI stays neutral
with regard to jurisdictional claims in
published maps and institutional affil-   1. Introduction
iations.                                  1.1. Urban Forest Restoration
                                               Urban centres and their associated human activity lead to a dramatic loss of native
                                          ecosystem cover [1]. Although urbanization generates environmental challenges, cities
Copyright: © 2022 by the authors.
                                          provide a unique context to restore native ecosystems for human well-being [2] and opportu-
Licensee MDPI, Basel, Switzerland.        nities to develop the field of restoration ecology. Restored urban forests provide important
This article is an open access article    ecosystem services [3], such as reducing greenhouse gases through carbon sequestra-
distributed under the terms and           tion [4,5], decreasing storm water runoff by absorbing rainwater [2,6,7] and minimising
conditions of the Creative Commons        the urban heat island effect by reducing ground surface and air temperatures [8]. Further,
Attribution (CC BY) license (https://     complex urban greenspaces, such as forests, can be havens for native biodiversity [9,10]
creativecommons.org/licenses/by/          and enhance human health and well-being [11,12].
4.0/).

Forests 2022, 13, 199. https://doi.org/10.3390/f13020199                                                       https://www.mdpi.com/journal/forests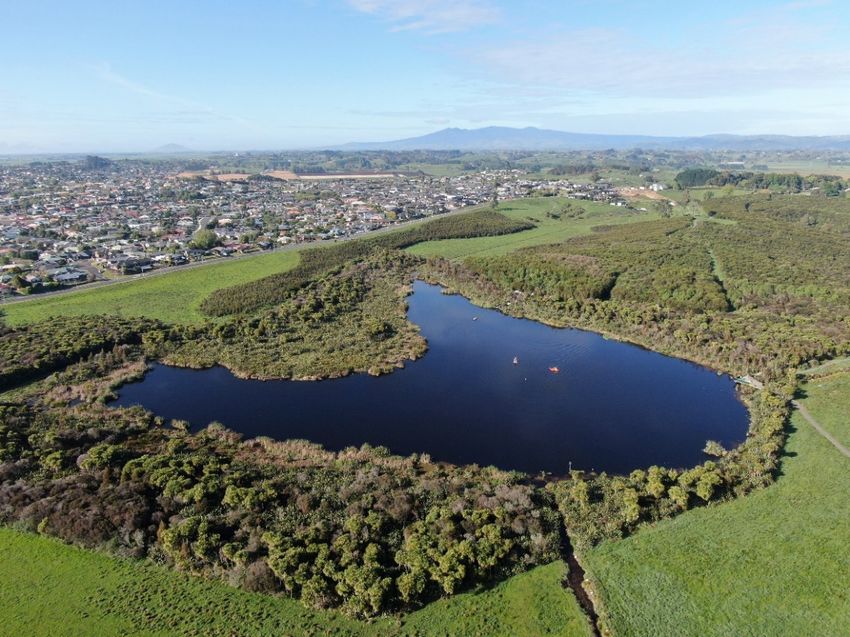
Forests 2022, 13, 199                                                                                                             2 of 16

                                      Restoring urban forests is becoming increasingly important because more than 50%
                                 of the world’s population live in urban areas [1] and, for city residents, the only op-
                                 portunity to enjoy nature is often at a local forested park. Urban forests therefore of-
                                 fer opportunities to support threatened species [13] and enhance ecosystem function
                                 through restoration [14], while simultaneously allowing people the manifold benefits of
                                 re-connection with nature [13,15,16]. However, to successfully restore urban forests, we
                                 must develop a comprehensive understanding of urban forest successional dynamics and
                                 the ways the urban context might constrain young tree plantings from developing into
                                 mature, ecologically functioning forests [17]. Restoring urban forests by trial and error is
                                 costly, and can often result in failures that discourage stakeholders and practitioners, and
                                 condemn future funding applications [18]. After the initial plantings occur, restoration
                                 practitioners require (1) predictive power about forest developmental trajectories, (2) tools
                                 to detect threshold points, and (3) knowledge of the ecological indicators that signal im-
                                 portant changes in forest succession. These factors promote improved management, by
                                 forecasting the need for specific interventions (e.g., non-native herbaceous weed control or
                                 late-successional tree enrichment planting) to guide forest ecosystem restoration along a
                                 successful pathway

                                 1.2. Successional Development and Restoration Trajectories in the Urban Ecosystem Context
                                       Addressing differences in successional development (definition in Table 1) between
                                 urban and non-urban forests is relevant to restoration practice [3] because models based on
                                 non-urban forests may not accurately predict succession in urbanized environments [19].
                                 Residential, industrial, and infrastructural landcover differences in urban areas creates dis-
                                 tinctive challenges for urban forest restoration, including larger temperature fluctuations [20,21],
                                 native landcover fragmentation [22,23], pollutants (e.g., light pollution [24,25] and chemical
                                 pollution [3]), and invasion by non-native species [26–28].
                                       Acknowledging that continual anthropogenic pressure alters natural disturbance
                                 regimes and shapes successional development by redirecting restoration trajectory ([29];
                                 Table 1) allows realistic goals to be set for urban restoration management. Appropriate
                                 goals will improve management and lead to successful social, economic and ecological
                                 outcomes [19,29,30]. Anticipating the urban context and its influence on the restoration
                                 of planted forests is critical and requires knowledge of succession theory to (i) guide the
                                 ecosystem’s successional development, but also (ii) to understand individual restoration
                                 trajectories of key ecosystem attributes (e.g., canopy openness; Table 1), and (iii) select the
                                 most useful ecological indicators of success (e.g., plant guilds physiologically sensitive to
                                 urban climates).

                                 Table 1. Definition of terms discussed in the context of this paper.

          Term                                    Definition as Used in this Paper                                 Related Refs.
                         Also sometimes known as ‘ecological succession’. Succession theory defines as the
                         process of a change in species structure of an ecological community over time. This
                        results largely from modification of the physical environment by the species present
     Successional       and is somewhat predictable and therefore a process that ecological restoration often
                                                                                                                    [29,31–34]
     development             seeks to mimic. Here we assume successional development should occur in
                            restoration projects following an anthropogenic disturbance and subsequent
                        restoration action and the goal is to reach a ‘mature’, ‘climax’ or ‘stable’ functioning
                                           ecosystem possibly sustained at an ‘equilibrium’.
                         Also sometimes known as ‘key ecological attribute’ or ‘community attribute’. These
           Key          are measurable properties of an ecosystem that are useful in monitoring or otherwise
       ecosystem            quantitatively assessing function or biodiversity and they are often drivers of          [21,35,36]
        attribute       successional development. They are helpful characteristics to monitor when assessing
                                           progress toward a target state for the ecosystem.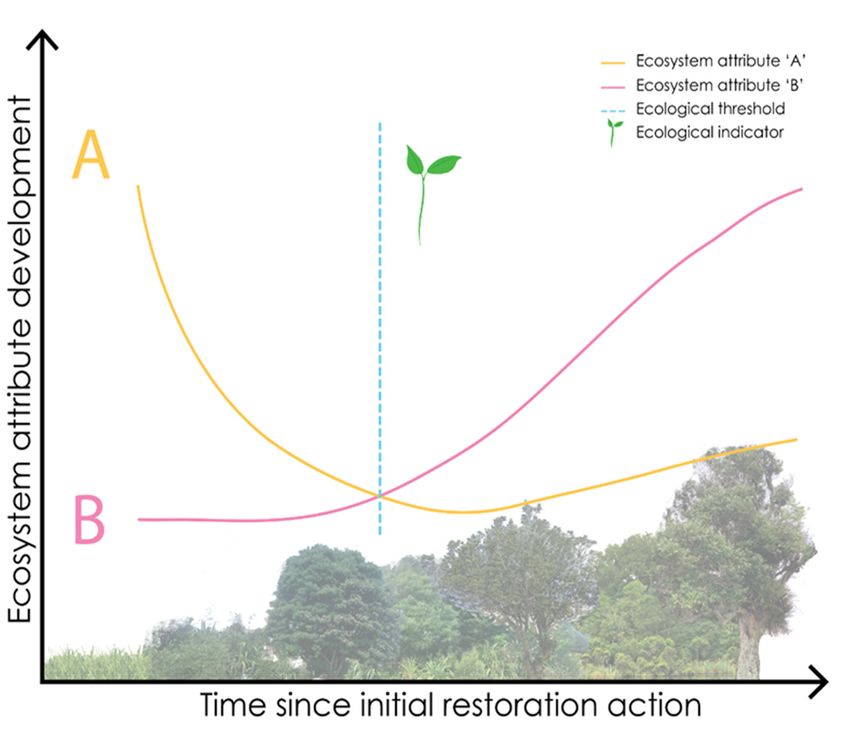
Forests 2022, 13, 199                                                                                                            3 of 16

                                 Table 1. Cont.

          Term                                    Definition as Used in this Paper                                 Related Refs.
                        Also sometimes known as ‘ecological trajectory’. The pathway of development taken
      Restoration       by either an entire ecological community or individual ecosystem attribute during the
                                                                                                                      [37,38]
       trajectory       process of restoration. In this paper we use the concept when referring to individual
                                                        key ecosystem attributes.
                            An ecological threshold is the point at which there is an abrupt change in an
       Ecological       ecosystem attribute or property, or where small changes in an environmental driver
                                                                                                                      [39–41]
       threshold        produce large responses in the ecosystem. A threshold can often signal a rapid shift or
                             change from one state or successional stage of the ecosystem to another.
                         The appearance or occurrence of a specified abiotic or biotic property that signals a
       Ecological       condition or state of the wider ecosystem. Ecological indicators may differ widely in
                                                                                                                     [7,42–44]
       indicator        their specification, depending on their application, and in this paper we discuss in the
                               context of those that may be of most use during urban forest restoration.

                                       Successional development of an entire ecosystem encompasses many possible trajecto-
                                 ries (e.g., retrogressive, direct regeneration, divergent, convergent) and change in various
                                 communities or taxa offers restoration insights into how species’ attributes can reflect
                                 changes in community structure [45]. Successional development and active restoration are
                                 tightly coupled because ‘succession’ gauges species composition change through time and
                                 restoration is the deliberate manipulation of that change [45]. We must therefore under-
                                 stand the possible successional development pathways of urban forest ecosystems, as well
                                 as trajectories of their constituent key ecosystem attributes. For example, tree basal area
                                 and canopy openness are key constituent metrics of succession with regard to vegetation
                                 structure [46].
                                       In addition to being good measures of the current state of the entire ecosystem’s
                                 successional development, some key ecosystem attributes can be cost-effective and time
                                 efficient to measure, providing relationships between forest structural complexity and
                                 recovery of other ecosystem components [47]. The key ecosystem attribute of canopy
                                 openness in cohort restoration plantings of pioneer tree species can be especially telling,
                                 particularly when these trees naturally senesce after a few decades [48]. Tree death creates
                                 canopy gaps and signals an important window for enrichment planting of mid- or late-
                                 successional species. In fragmented city landscapes with limited native seed rain, the
                                 development of these canopy gaps can enable invasive non-native plants to re-establish,
                                 so the timing of appropriate management actions is essential. Continual monitoring to
                                 understand the restoration trajectory of a key ecosystem attribute, such as canopy openness,
                                 will allow managers to pre-empt invasive non-native plant re-invasion.

                                 1.3. Ecological Thresholds and Indicators in Restoration
                                      As successional development of an ecosystem occurs over time there are discrete
                                 points of note. These points may be called ecological thresholds (Table 1), where there
                                 is a significant change in the restoration trajectory of a key ecosystem attribute, that
                                 is sometimes signaled by the appearance of an ecological indicator (Table 1; Figure 1).
                                 Ecological indicators are observable and measurable quantities that have great utility
                                 because they provide important information on the ecosystem condition [49]. For example,
                                 the appearance of physiologically-sensitive plant species that are typically associated with
                                 stable, moist conditions could be considered ecological indicators and their presence may
                                 suggest the understory microclimate has reached a threshold.
Forests 2022, 13, x FOR PEER REVIEW 4 of 17
Forests 2022, 13, 199 4 of 16
Figure
Figure 1. Thisconceptual
1. This conceptual diagram
diagram hypothesizes
hypothesizes restoration
restoration trajectories
trajectories of two ofkeytwo key ecosystem
ecosystem attrib‐ at-
tributes (represented
utes (represented by lines
by lines A andA B)
and B) time
over oversince
time initial
since restoration
initial restoration
action wasaction was
taken. taken.
When oneWhen
or more
one attributes
or more reach
attributes an ecological
reach an ecologicalthreshold (dashed,
threshold vertical
(dashed, blue blue
vertical line),line),
ecological indicators
ecological indicators
may appear
may appear (green
(green seedling
seedlingicon).
icon).ForForexample,
example, within
withinthethe
context of urban
context of urbanforest restoration,
forest a
restoration, a
cohort of early‐successional native tree plantings should grow over time and reduce canopy open‐
cohort of early-successional native tree plantings should grow over time and reduce canopy openness
ness (e.g., Ecosystem attribute ‘A’) leaf litter cover is accruing on the forest floor (e.g., Ecosystem
(e.g., Ecosystem
attribute ‘B’). Asattribute ‘A’) leaf
each of these litter cover
ecosystem is accruing
attributes followsonthe
thepictured
forest floor (e.g., Ecosystem
hypothetical attribute
restoration
‘B’). As each of these ecosystem attributes follows the pictured hypothetical
trajectory, a threshold may occur when Ecosystem attributes A and B reach a point in which under‐restoration trajectory, a
story conditions
threshold may occurare ameliorated
when Ecosystemadequately to facilitate
attributes A and shade‐tolerant
B reach a point mid‐ or late‐successional
in which understory condi-
plantare
tions species. This threshold
ameliorated may be
adequately signaled by
to facilitate spontaneous mid-
shade-tolerant colonization (green seedling
or late-successional icon),
plant species.
which could be considered an ecological indicator. Knowledge of when ecological indicators should
This threshold may be signaled by spontaneous colonization (green seedling icon), which could be
appear and when to look for them can inform management decisions. In this hypothetical scenario,
considered an ecological indicator. Knowledge of when ecological indicators should appear and
when the green seedling indicator appears the management implication is that conditions are ap‐
when to look for them
propriate to plant mid‐ orcan inform management
late‐successional enrichmentdecisions.
species.In this hypothetical scenario, when the
green seedling indicator appears the management implication is that conditions are appropriate to
plant In
mid-urban forests, understanding
or late-successional enrichment ecological
species.thresholds and their associated indicators
can greatly support restoration efforts [18]. By monitoring planted forests as they grow
fromIn urban
the forests, understanding
early‐successional ecologicalecological
stage and observing thresholds and theirofassociated
indicators successional indicators
de‐
can
velopment progress, we can assess if plantings are maturing to resemble a target forestgrow
greatly support restoration efforts [18]. By monitoring planted forests as they
from the early-successional
ecosystem [50]. Easily‐measured stageecological
and observing ecological
indicators are usefulindicators of successional
for triggering specific de-
velopment
management progress,
practiceswe can assess
[43,44]. if plantings
Indicators are maturing
can be classified to resemble
in three a target forest
ways: composition,
structure and
ecosystem [50].function [43,46,51,52].
Easily-measured For example,
ecological composition
indicators are usefulmayforinclude indicators
triggering re‐man-
specific
lated to the
agement diversity
practices or abundance
[43,44]. Indicatorsofcanflora
beand fauna; in
classified structure may indicate
three ways: change
composition, in
structure
vegetation
and functionsuch as height, diameter
[43,46,51,52]. and canopy
For example, closure;may
composition and include
functionindicators
may include varia‐to the
related
bles that measure
diversity ecosystem
or abundance processes,
of flora and fauna;suchstructure
as diversity
mayand abundance
indicate change ofin
bioindicators
vegetation such
or height,
as specificdiameter
trophic interactions
and canopy [43]. Here, we
closure; anddefine ecological
function indicators
may include similarly
variables to Lin‐
that measure
denmayer et
ecosystem al. [53], where
processes, such indicators
as diversity areand
species or conditions
abundance that infer a particular
of bioindicators or specificres‐
trophic
toration state, or species that reflect efforts to mitigate disturbance and
interactions [43]. Here, we define ecological indicators similarly to Lindenmayer et al.are easily used as [53],
management indicators (also see Table 1).
where indicators are species or conditions that infer a particular restoration state, or species
Ecological
that reflect indicators
efforts can disturbance
to mitigate denote the general
and areecosystem
easily used successional
as managementdevelopment
indicators
(e.g., native species colonization [43,54]), or marked changes in individual key ecosystem
(also see Table 1).
Ecological indicators can denote the general ecosystem successional development (e.g.,
native species colonization [43,54]), or marked changes in individual key ecosystem at-
tributes. For example, colonization by shade-tolerant plants, which require moist, sheltered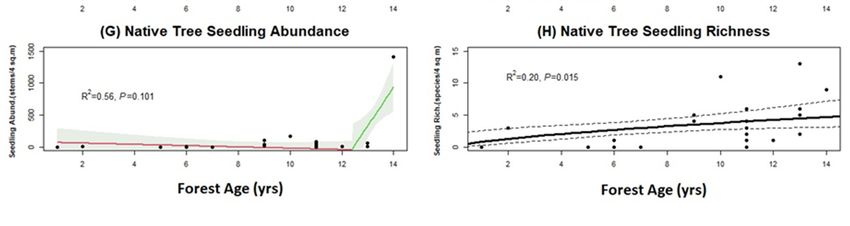
Forests 2022, 13, 199 5 of 16
microclimates (e.g., epiphytes), indicates successional development [55]. Regenerating
tree species richness and abundance are the ultimate indicators of success for restoring
a self-perpetuating forest ecosystem; however, they may only come after thresholds in
some key ecosystem attributes eventuate, e.g., canopy openness, or stable understory
microclimate [21]. In the years immediately following initial restoration activities, key
ecosystem attributes should be monitored while looking for the appearance of ecological
indicators to best inform on forest successional development. Monitoring is also critical
in later stages of the restoration process (i.e., >10 years since initial plantings) because
short-term data may not reveal long-term ecosystem responses [56].
Here, we present analysis on the successional development of a planted urban forest
14 years chronosequence. We evaluate restoration trajectories of key ecosystem attributes,
detect ecological thresholds, and speculate about useful ecological indicators for the urban
context. The goal is to better assess progress towards a functioning, self-perpetuating forest.
We assessed early-successional tree plantings to identify: (i) general forest ecosystem succes-
sional development, (ii) change in constituent key ecosystem attributes, and (iii) ecological
indicators of restoration success (e.g., physiologically-sensitive native plant colonization).
We were particularly interested in the appearance of important ecological indicators that
may mark jumps in ecosystem attribute recovery and have positive implications for native
wildlife health (e.g., reproduction, migration activities, and population growth) and food
web dynamics.
2. Materials and Methods
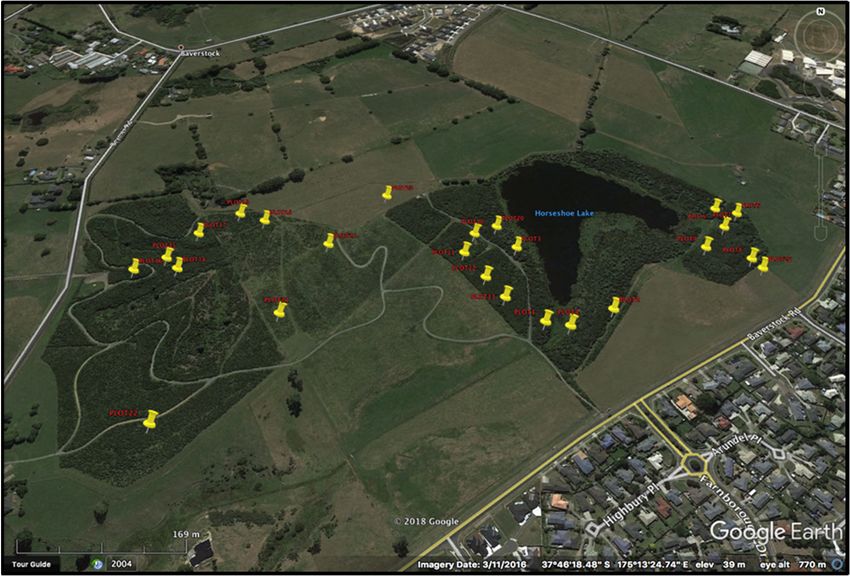
2.1. Study Site
Our site was situated within northwest Kirikiriroa Hamilton (37.7870◦ S, 175.2793◦ E;
population 160,000) within the Waikato region of Aotearoa New Zealand. The area was
historically heavily forested but now has ~2.1% indigenous forest cover remaining [57].
Kirikiriroa Hamilton has an annual mean precipitation of 1110 mm with mean minimum
and maximum temperatures of 8.7 and 18.9 ◦ C, respectively. Data were collected from
Waiwhakareke Natural Heritage Park (WNHP; Figure 2) a 65.5 ha area of public retired
pasture land covered in non-native plants. Waiwhakareke Natural Heritage Park was once
temperate lowland rainforest and wetland which is now being restored through active
planting and ongoing management [58]. As of 2020, 37.3 ha has received pioneer plantings,
with 10.7 ha of that also being enriched with mid–late-successional plant species.
Planting followed guidelines outlined in the operative management plan [59] which
identifies target ecosystem planting composition based on topography and soils. Five main
planting zones have been identified, each with a species composition suited to that zone
type (Lake Zone, Riparian Zone, Wetland Zone, Hillslope, and Ridgetop [59]). Together,
some 80 different native trees and shrubs are being used in the initial early-successional
and late-successional plantings. Depending on successional status and expected size at
maturity, plantings occur at densities of 50–200 plants per 100 m2 , with small-maturing,
early-successional species planted densely and large-maturing, late-successional species
planted sparsely. Early-successional planting composition includes pioneer tree and shrub
species historically found in the region, most from genera such as Pittosporum, Kunzea,
Leptospermum, Hoheria and Coprosma. These species display typical early-successional
species’ characteristics such as tolerance to temperature swings and drought and require
full sun conditions for their quick growth. They generally grow quickly but have short
lifespans and therefore are only a first step in forest establishment and must be augmented
with enrichment plantings of late-successional plant species. Late-successional species
composition includes late-successional species typical of the region from genera such as
Dacrycarpus, Dacrydium, Agathis, Alectryon, Beilschmiedia, and Hedycarya. Late-successional
species’ growth traits include slower growth, juveniles with less tolerance to swings in
local climate conditions and more shade tolerance and longer lifespans.Forests 2022,
Forests 13,13,
2022, 199x FOR PEER REVIEW 6 of 176 of 16
Figure 2.
Figure 2. The
The research
researchsite,
site,Waiwhakareke
Waiwhakareke Natural
NaturalHeritage Park
Heritage in the
Park in city of Kirikiriroa
the city Hamilton,
of Kirikiriroa Hamilton,
Aotearoa New Zealand. This public land on the outskirts of the city is being restored with additional
Aotearoa New Zealand. This public land on the outskirts of the city is being restored with additional
plantings every year. The entire area pictured was once severely modified pasture land and the aim
plantings every
is to return it to year.
mature The entire
native area pictured
temperate was representative
rainforest once severely of
modified
the localpasture
region’sland and the aim
vegetation.
isThe
to current
return it to mature native temperate rainforest representative of the local region’s
canopy consists largely of early‐successional species. The park features low, rolling vegetation.
hills
The
and current
a peat canopy
lake. consists
Image largely
credit: ofDavid
early-successional
G. Schmalespecies. The park features low, rolling
III. (www.hamilton.govt.nz/our‐
city/parks/parksandgardens/waiwhakareke/Pages/default.aspx)
hills (accessed on10 November 2021).
and a peat lake. Image credit: David G. Schmale III. (www.hamilton.govt.nz/our-city/parks/
parksandgardens/waiwhakareke/Pages/default.aspx) (accessed on10 November 2021).
Planting followed guidelines outlined in the operative management plan [59] which
identifies targetofecosystem
Plantings planting
native species havecomposition based onover
occurred annually topography
the last 14 and soils.forming
years, Five a
main planting zones
chronosequence. have been identified,
Chronosequences each with a species
are space-for-time composition
substitutions thatsuited
can tobethat
used to
zone type (Lake
understand Zone, Riparian
the long-term Zone, that
processes Wetland Zone,forests
structure Hillslope,
[60]and
andRidgetop
allow us[59]). To‐
to provide a
gether, some 80 different native trees and shrubs are being used in the initial
novel perspective on how succession theory can be applied to the ecological restoration of early‐succes‐
sional and
forests withinlate‐successional
city landscapes. plantings. Depending on successional status and expected
size at maturity, plantings occur at densities of 50–200 plants per 100 m2, with small‐ma‐
turing,
2.2. Dataearly‐successional
Collection species planted densely and large‐maturing, late‐successional
species planted sparsely. Early‐successional planting composition includes pioneer tree
We collected data on key ecosystem attributes from 25 permanent plots (100 m2/ plot)
and shrub species historically found in the region, most from genera such as Pittosporum,
that span across different planting ages in the 14 years chronosequence (2004–2017; Figure 3).
Kunzea, Leptospermum, Hoheria and Coprosma. These species display typical early‐succes‐
In each plot, canopy openness was measured at four locations (at each plot corner) by
sional species’ characteristics such as tolerance to temperature swings and drought and
taking
requiredensiometer measurements
full sun conditions for their of lightgrowth.
quick transmission from 1.4 grow
They generally m above the ground
quickly but haveusing
ashort
convex
lifespans and therefore are only a first step in forest establishment and must beMS,
spherical densiometer (Convex model A; Forestry Suppliers, Jackson, aug‐USA).
The average value across the four plot locations was used to quantify
mented with enrichment plantings of late‐successional plant species. Late‐successional plot-level canopy
openness as an index of light availability in the forest understory.
species composition includes late‐successional species typical of the region from genera
suchAll
as Dacrycarpus, trees ≥2.5Agathis,
living adultDacrydium, cm (single- and multi-stemmed
Alectryon, Beilschmiedia, andindividuals) diameter at
Hedycarya. Late‐suc‐
breast height
cessional (DBH;
species’ 1.4 m)
growth within
traits eachslower
include plot were identified
growth, juvenilesto species
with less level, classified
tolerance to as
native
swingsor in non-native,
local climate and the DBH
conditions and of each
more stem
shade was recorded.
tolerance and longer Welifespans.
used these data to
compute the basal
Plantings area for
of native adulthave
species tree species
occurredinannually
each plot. Allthe
over deadlastadult treesforming
14 years, rooted within
a
achronosequence.
plot were talliedChronosequences
but not otherwise measured.
are Saplings,
space‐for‐time defined as
substitutions trees
that can1.4 m inthe
understand height were tallied
long‐term processes by that
species acrossforests
structure the entire
[60] plot
and and
allow classified as native
us to provide a or
non-native. Seedlings, defined asWe collected data on key ecosystem attributes from 25 permanent plots (100 m2/plot)
that span across different planting ages in the 14 year chronosequence (2004–2017; Figure
3). In each plot, canopy openness was measured at four locations (at each plot corner) by
taking densiometer measurements of light transmission from 1.4 m above the ground us‐
Forests 2022, 13, 199 ing a convex spherical densiometer (Convex model A; Forestry Suppliers, Jackson, MS,7 of 16
USA). The average value across the four plot locations was used to quantify plot‐level
canopy openness as an index of light availability in the forest understory.
Figure 3.
Figure 3. The
The2525plot locations
plot at Waiwhakareke
locations Natural
at Waiwhakareke Heritage
Natural Park, each
Heritage witheach
Park, a unique
withID num‐ ID
a unique
ber. The plots form a chronosequence by spanning the range of planting years (2004–2017). There‐
number. The plots form a chronosequence by spanning the range of planting years (2004–2017).
fore, there is a marked difference in appearance between the different planting areas, with younger
Therefore, there
planting areas is a marked
lighter difference
in appearance and in appearance
older between
ones showing the different
up darker and moreplanting areas,
textured. The with
younger planting areas lighter in appearance and older ones showing up darker and more
same data were collected in each plot to observe forest successional changes as related to plantingtextured.
The
age. same data were collected in each plot to observe forest successional changes as related to
planting age.
All living adult trees ≥2.5 cm (single‐ and multi‐stemmed individuals) diameter at
Epiphytes
breast were 1.4
height (DBH; defined as anyeach
m) within obligate native
plot were epiphytetogrowing
identified on an classified
species level, adult treeas which
native
was or non‐native,
rooted within aand plotthe DBH of each
(obligate stem was
epiphytes arerecorded.
those whichWe used
must these
grow data
ontotrees
com‐[61]).
pute the basal
Epiphytes were area for adult to
identified tree speciesand
species in each plot.by
tallied Allnumber
dead adult treestrees
of host rooted within
they a
occurred
plot were
on [62]. tallied but not otherwise measured. Saplings, defined as trees 1.4 m in height
Ground wereassessed
cover was tallied bybyspecies
percentacross the entire
cover acrossplot
the and classified
entire plot andas native
could not
or non‐native. Seedlings, defined asForests 2022, 13, 199 8 of 16
standard measures of basal area in forestry practice. All statistical analyses were performed
in R using the “vegan” package [65].
3. Results
3.1. Canopy Changes
All adult trees recorded were native. There was a significant relationship between
forest planting age and native adult tree basal area. We found that they increase together in
a predictable, linear fashion, with no thresholds detected (Figure 4A). The greatest basal
area occurred at 12 years (38.5 m2 /ha), and at 11 years, when many other key ecosystem
attributes experienced a threshold, and averaged 25.2 m2 /ha. The lowest basal area value
(0 m2 /ha) occurred in younger plots (1 and 2 years after planting) because none
Forests 2022, 13, x FOR PEER REVIEW 9 of 17
of the
plantings were large enough to qualify as adult trees.
Figure 4. Successional development of key ecosystem attributes and ecological indicators within
Figure 4. Successional development of key ecosystem attributes and ecological indicators within
planted urban forest plots (plot size = 100 m2 ) that range between 1 and 14 years in age since
planted urban forest plots (plot size = 100 m2) that range between 1 and 14 years in age since plant‐
planting. We show
ing. We show ecosystem
ecosystem attributes
attributes that have that have changed
changed most drastically
most drastically since initialsince initial
planting, manyplanting,
many of which
of which displaydisplay thresholds
thresholds in their developmental
in their developmental trajectories.trajectories.
Forest age Forest
is shown ageonisthe
shown
x‐axison the
x-axis andare
and units units are inScatterplot
in years. years. Scatterplot points each
points represent represent
of the each of the
25 plots data25 plots
were data were
collected collected
in; some
points
in; some overlap
pointswith each with
overlap other each
almost completely
other almost in graph space,
completely causingspace,
in graph fewercausing
than 25 to be visible
fewer than 25 to
in visible
be some cases. The cases.
in some solid lines
The represent
solid linestherepresent
fitted values from linear
the fitted valuesregression
from linear models, and 95%
regression models,
confidence intervals are shown for piecewise linear regression models with significant thresholds
and 95% confidence intervals are shown for piecewise linear regression models with significant
by using shading, whereas for linear regression models without thresholds detected, 95% confi‐
thresholds by using
dence intervals shading,
are shown whereas
by using dashedfor lines.
linear(A)
regression
Native tree models
basal without thresholds
area (m2/ha) detected, 95%
had a significant
confidence
relationshipintervals
with forestare shown
age but noby using dashed
detectable lines.
threshold, (B)(A) Native
canopy tree basal
openness area (m
(% cover) had2 /ha)
a sig‐had a
nificant relationship
significant withwith
relationship forest age and
forest age abut
threshold at 9.6 years,
no detectable (C) non‐native
threshold, (B) canopy herbaceous
opennesscover (% cover)
had a significant relationship with forest age and a threshold at 10.9 years, (D) leaf
had a significant relationship with forest age and a threshold at 9.6 years, (C) non-native herbaceouslitter cover had
a significant relationship with forest age and a threshold at 10.8 years, (E) fern cover had a significant
cover had a significant relationship with forest age and a threshold at 10.9 years, (D) leaf litter cover
relationship with forest age but no threshold, (F) dead trees had a significant relationship with forest
had a significant
age and a threshold relationship
at 11 years,with forest tree
(G) native age seedling
and a threshold
abundance at had
10.8 ayears, (E) fern
marginally cover had a
significant
significant relationship with forest age but no threshold, (F) dead trees had a
relationship with forest age and a threshold at 12.4 years, and (H) native tree seedling richness significant relationship
had
with forest age
a significant and a threshold
relationship at age
with forest 11 years,
but no(G) native threshold.
detectable tree seedling abundance had a marginally
significant relationship with forest age and a threshold at 12.4 years, and (H) native tree seedling
In contrast,
richness while basal
had a significant area increased
relationship withage
with forest forest
but age, we foundthreshold.
no detectable a significant inverse
relationship between forest age and canopy openness (Figure 4B). A steep drop from
99.8% canopy openness to 3.4% openness occurred with a threshold at 9.6 years after
planting. After this threshold, canopy openness slowly increased.
3.2. Ground Covers and Dead TreesForests 2022, 13, 199 9 of 16
In contrast, while basal area increased with forest age, we found a significant inverse
relationship between forest age and canopy openness (Figure 4B). A steep drop from 99.8%
canopy openness to 3.4% openness occurred with a threshold at 9.6 years after planting.
After this threshold, canopy openness slowly increased.
3.2. Ground Covers and Dead Trees
Ground cover summary measurements are summarised in Table 2, and those of note
are also shown graphically with their associated statistical results (Figure 4C–E). Non-native
herbaceous cover decreased with forest age, beginning at 100%, and declining to 0%, with a
significant breakpoint at 10.9 years (Figure 4C; Table 2). Leaf litter cover accrued with forest
age (Figure 4D) from 0% to 95% and peaked at 20 times greater than in youngest plots, with
a significant breakpoint at 10.8 years (95% cover; Table 2), after which it declined. Ferns
began to appear approximately 10 years after initial plantings and increased with age to
65% cover in the years following, but without a significant breakpoint detected (Figure 4E;
Table 2). There was generally little bare ground (no more than 15%, with the exception
of 60% in one 7-years-old plot; Table 2), which was marginally inversely related to forest
age (R2 = 0.30, P = 0.063; threshold 7 years). Moss cover displayed a marginally significant
increase during forest development (R2 = 0.09, P = 0.074), but no breakpoint was evident.
Moss was completely absent in plantings seven years or younger and only occurred in very
low quantities thereafter (~1% cover; Table 2). The number of dead adult trees significantly
increased with forest age (threshold 11 years; Figure 4F).
Table 2. Ground covers measured in five categories: non-native herbaceous plants, leaf litter,
bare ground, moss or ferns, displayed as percent cover with relation to forest age. * Significant
breakpoint detected.
Ground Cover Category (Percent Cover)
Forest Age (y) Non-Native
Leaf Litter * Bare Ground * Moss Fern
Herbaceous Plants *
1 100 0 0 0 0
2 100 0 0 0 0
5 75 20 5 0 0
6 85 10 5 0 0
6 70 28 2 0 0
6 70 20 10 0 0
7 1 38 60 1 0
9 70 20 1 1 8
9 7 89 2 1 1
9 9 73 15 2 1
10 25 65 5 1 4
11 55 25 4 0 16
11 10 65 5 0 20
11 0 49 10 1 40
11 0 50 8 2 40
11 0 95 5 0 0
11 1 90 4 0 5
11 1 88 10 0 1
11 10 73 15 1 1
12 70 27 1 1 1
13 20 10 5 0 65
13 5 24 5 1 65
13 79 15 5 0 1
13 36.56 54.31 6 3.13 0
14 42 15 1 1 41Forests 2022, 13, 199 10 of 16
3.3. Native Plant Regeneration in the Understory
3.3.1. Tree Seedlings
The total abundance of native tree seedlings had a significant positive relationship
with forest age and a threshold was detected (Figure 4G; threshold 12.4 years). The plot
with the greatest number of native seedlings (1416) was in the oldest forest planting
(14 years). In this plot the most abundant seedling species was Dacrycarpus dacrydioides
(white pine, kahikatea; 1270), followed by Cordyline australis (cabbage tree, tı̄ kōuka; 93).
Native seedlings had a large increase in numbers measured after the threshold point at
12.4 years. The most abundant seedling species across all plots were D. dacrydioides (white
pine, kahikatea: 1299), Melicytus ramiflorus (whitey wood, māhoe: 297), C. australis (cabbage
tree, tı̄ kōuka: 164) and Coprosma tenuicaulis (swamp coprosma, hukihuki: 130).
Non-native seedling abundance was comparatively low regardless of forest age
(alwaysForests 2022, 13, 199 11 of 16
slope, or temporal aspect of the trajectory may be important to observe. Here, we note a
fairly rapid positive increase in native adult tree basal area, and while there is a similar
trajectory shape demonstrated by fern cover and native tree seedling richness, the slope
is much flatter, signaling a slower developmental timeframe which may require different
practitioner planning.
The other two types of non-linear trajectories with distinct thresholds are interesting
to consider as they are more dynamic, helpful attributes for signaling important points
in successional development. For example, in our results, after the first decade of canopy
closure, a distinct slope change occurs that indicates the canopy begins to open again.
This is likely indicating a turnover in canopy trees, perhaps as early-successional species
senesce and contribute to gap formation [69,70], which is an important moment for mid-
and late-successional plant species establishment in the understorey (spontaneously or
via enrichment planting) [71]. These non-linear results reflect dynamics hypothesized in
our conceptual model (Figure 1) and demonstrate the possibility of multiple equilibrium
states in an ecosystem attribute [37]. Especially in highly disturbed urban contexts, con-
certed management intervention may be required to push an ecosystem attribute past the
threshold point towards a more desirable, perhaps more resilient equilibrium state [19].
For example, in wetland restoration, nitrogen supplementation has been demonstrated as
important for shifting plant community height to a more desirable state, (but the effect did
not persist after supplementation ceased) [72].
The trajectories of individual key ecosystem attributes may sometimes be entangled
with those of other ecosystem attributes, and may therefore trigger changes in one another.
For example, in our results, tree growth caused a closed canopy, limiting understorey
light availability and consequently inhibiting growth of non-native herbaceous pasture
light-demanding species, a cascading relationship found in other research [18]. Forest floor
characteristics changed such that non-native herbaceous plants senesced and were replaced
by increasing leaf litter and coarse woody debris dropped by the maturing trees. Building
the litter layer ultimately boosts soil organic material, a primary requirement in functioning
forests [73,74]. The combination of canopy closure and increased leaf litter will subsequently
enhance nutrient cycling and improve conditions for native seedling establishment. [75].
Our findings support our hypothesis that the trajectories of ecosystem attributes may vary
in shape over time, and that they can influence each other in fundamental ways (Figure 1).
4.2. Ecological Thresholds and Suitable Indicators in Urban Forests
Many of the thresholds we detected occurred approximately 11 years after initial
restoration plantings, which suggests this as a critical point in successional development [39]
of urban forest ecosystems undergoing restoration. This point in development may be
driven by factors other than time since initial restoration action, such as local climate,
original disturbance extent [37], canopy composition [48] or other ecosystem drivers not
yet fully understand in threshold dynamics [41].
For example, the temporal scale found here is different from a similar study by
Wallace et al. 2017 [21], which studied 27 restored urban forests in two Aotearoa New
Zealand cities (Kirikiriroa Hamilton and Ngāmotu New Plymouth). Wallace et al. 2017
found that it took 20 years (versus 11 in the present paper) to reach similar native tree
basal area values. Forest age differed between studies, but the adult native tree basal area
values were very similar at the detected thresholds (25.2 m2 /ha here versus 27 m2 /ha in
Wallace et al. 2017). Differences in forest age at similar basal areas may simply be due to
different locations and therefore growing conditions. Additionally, one study encompasses
plots scattered across two cities while the present study focusses on data from plots in
just one location. The studies’ findings agree that the ecosystem attribute basal area has a
predictable threshold point during its restoration trajectory.
We propose several easily-detected ecological indicators for use during urban for-
est restoration; all are groups or guilds of physiologically-sensitive plants: moss, ferns,
epiphytes, and native tree seedlings. None of these plant guilds occurred in youngerForests 2022, 13, 199 12 of 16
planted forests, but appeared about a decade after initial tree plantings (moss 7 years; ferns
9 years; epiphytes 11 years; native tree seedlings 12 years). These are good ecological
indicators (or perhaps ‘indicator species’) in urban forests because they signal a critical shift
in understory conditions to a more stable, moister microclimate—an all-important shift
for the dry, urban heat island context [20]. They also signal change in forest successional
status from early to mid-successional communities of plants. To develop a complex forest
structure, the typical sequence of events begins with an increase in planted tree size (basal
area), followed by a subsequent decrease in canopy openness. Reduced canopy cover
blocks sunlight and reduces fluctuations in air temperature, and ultimately generates a
balanced microclimate [21]. The presence of ecological indicators can infer that this cascade
of events has occurred and particular microclimate conditions have been met. At this
point, practitioners might consider that restorative actions to mitigate prior anthropogenic
disturbances are on a successful pathway [53].
Using the presence of ecological indicators such as physiologically-sensitive plant
guilds is not a new concept [44]. For example, epiphytes are already considered an excel-
lent indicator of forest restoration success [62]. However, the urban context is particularly
poignant for their use as indicators because of the larger microclimatic swings [76], high
habitat fragmentation, and resulting poor native seed rain [77]. Colonization by sensitive
plants is therefore notable for urban forests because they unmistakably signal that more ap-
propriate understory microclimate conditions have developed. Furthermore, their presence
suggests that management action is appropriate because a critical stage in successional
development of the planted forest has occurred [78]. Understanding that physiologically-
sensitive plants are excellent ecological indicators is valuable for urban forest restoration
practitioners, as they provide important implications for management at pivotal points in
forest development, and are relatively easy to observe and measure.
4.3. Implications for Management of Urban Forests Undergoing Restoration
Our results show the latency between initial restoration plantings and canopy closure
of approximately 11 years, when many thresholds in key ecosystem attributes were then
detected and ecological indicators appeared. Therefore, management to facilitate succes-
sional development in the first decade should be directed towards reaching this predictable
threshold by encouraging early-successional tree growth. Firstly, the time required to reach
canopy closure could be expedited by ensuring initial plantings are dense (e.g., one plant
per m2 ) and tall (>1 m in height) [18]. Additional management to encourage succession
may include regular invasive non-native plant control that is well targeted so juvenile
native plants are not collateral damage. In some places, vertebrate browsers (e.g., rabbits
[Oryctolagus cuniculus], Australian possums [Trichosurus vulpecula]) and seed predators (e.g.,
mice [Mus musculus]) should be controlled.
Monitoring is vital, and use of several metrics is beneficial. By a decade post-planting,
basal area and canopy closure should be evaluated and, if basal area of ~25 m2 /ha and at
least 90% canopy closure have developed, invasive non-native plant control efforts can be
reduced. These basal area and canopy closure measurements together with appearance of
ecological indicator species such as mosses, ferns, epiphytes or native tree seedlings also
suggest enrichment planting of mid- and late-successional species can begin. Enrichment
planting should focus most on species that cannot self-introduce due to dispersal limitation
and lack of seed sources in the urban environment. When understory conditions are suitable
in larger, rural forests recovering from disturbance, there is often mid- and late-successional
seed introduction provided through bird and wind dispersal. However, in urban contexts,
introduction of mid- and late-successional species through enrichment planting by people
is sometimes the only way these species may return [77].
Enrichment planting should be done in the important time window of canopy gap
formation to prevent non-native plant re-invasion and before too much canopy openness
increase and change in understory conditions. Mid- and late-successional plant species
established via enrichment planting have different physiological tolerances to understoryForests 2022, 13, 199 13 of 16
conditions depending on their growth stage, known as the ‘ontogenetic growth shift’ [79,80].
While a mostly-closed canopy promotes suitable conditions for mid- and late-successional
tree species’ seedlings, this is often not the case as they grow into saplings. Once established,
these more mature saplings often have greater light demands, and as a trade-off, are more
tolerant of microclimatic stresses such as large swings in temperature (they then have
larger carbon and water reserves) [81,82]. Saplings therefore do not rely as much on the
protected conditions that a closed canopy provides (e.g., shelter from wind, heat, frost and
desiccation). Because of this, the optimal timing to plant young, mid- and late-successional
trees as enrichment species may only span a few years: after canopy closure has occurred,
but before the early-successional trees senesce and canopy gaps re-form.
5. Conclusions
The restoration trajectory of planted urban forest ecosystems requires continual moni-
toring to gauge progress. As these planted forests develop, they may follow a predictable
successional development framework and include critical points, such as ecological thresh-
olds and indicators. Tracking forest growth (e.g., basal area and canopy closure) allows
these points to be detected and creates opportunities to observe colonization by sensitive
indicator plant guilds. By monitoring plantings, restoration practitioners can assist planted
urban forests to cross ecological thresholds more effectively and continue managing forest
development towards a self-sustaining, functioning ecosystem.
Author Contributions: Conceptualization and methodology, K.J.W.; formal analysis, K.J.W. and B.F.;
data collection, K.J.W.; data curation, B.F.; writing—original draft preparation, B.F.; writing—review
and editing, B.F., K.J.W. and B.D.C.; funding acquisition, B.D.C. All authors have read and agreed to
the published version of the manuscript.
Funding: This research was funded by the research program People, Cities & Nature, which is funded
by a Ministry of Business Innovation and Employment (MBIE) [grant number UOWX1601] from the
New Zealand government.
Informed Consent Statement: Not applicable.
Data Availability Statement: The data presented in this study and code used in analysis are openly
available in figShare under Wallace, Kiri Joy; Clarkson, Bruce D.; Farnworth, Bridgette (2022):
Wallace et al. 2022 Data and R code—Urban Forest Restoration. figshare. Dataset. https://doi.org/
10.6084/m9.figshare.18516476.v1 (accessed on 15 January 2022).
Acknowledgments: We thank the Hamilton City Council for granting land access and express
gratitude to T. Cornes for field assistance, to M. Hall for technical help with Figure 1 and F. Hasan for
creation of the graphical abstract.
Conflicts of Interest: B.D.C. was guest editor of the Special Issue this article was published in and
as such took all precautions to remove himself from review duties or final decisions regarding
publication of the article. The funders had no role in the design of the study; in the collection,
analyses, or interpretation of data; in the writing of the manuscript, or in the decision to publish
the results.
References
1. Grimm, N.B.; Faeth, S.H.; Golubiewski, N.E.; Redman, C.L.; Wu, J.; Bai, X.; Briggs, J.M. Global Change and the Ecology of Cities.
Science 2008, 319, 756–760. [CrossRef] [PubMed]
2. Endreny, T.; Santagata, R.; Perna, A.; De Stefano, C.; Rallo, R.; Ulgiati, S. Implementing and managing urban forests: A much
needed conservation strategy to increase ecosystem services and urban wellbeing. Ecol. Model. 2017, 360, 328–335. [CrossRef]
3. Piana, M.R.; Aronson, M.F.; Pickett, S.T.; Handel, S.N. Plants in the city: Understanding recruitment dynamics in urban landscapes.
Front. Ecol. Environ. 2019, 17, 455–463. [CrossRef]
4. Nowak, D.J.; Crane, D.E. Carbon storage and sequestration by urban trees in the USA. Environ. Pollut. 2002, 116, 381–389.
[CrossRef]
5. Nowak, D.J.; Crane, D.E.; Stevens, J.C. Air pollution removal by urban trees and shrubs in the United States. Urban For. Urban
Green. 2006, 4, 115–123. [CrossRef]Forests 2022, 13, 199 14 of 16
6. Xiao, Q.; McPherson, E.G. Rainfall interception by Santa Monica’s municipal urban forest. Urban Ecosyst. 2002, 6, 291–302.
[CrossRef]
7. Dobbs, C.; Escobedo, F.J.; Zipperer, W.C. A framework for developing urban forest ecosystem services and goods indicators.
Landsc. Urban Plan. 2011, 99, 196–206. [CrossRef]
8. Bowler, D.E.; Buyung-Ali, L.; Knight, T.M.; Pullin, A.S. Urban greening to cool towns and cities: A systematic review of the
empirical evidence. Landsc. Urban Plan. 2010, 97, 147–155. [CrossRef]
9. Aronson, M.F.J.; La Sorte, F.A.; Nilon, C.H.; Katti, M.; Goddard, M.A.; Lepczyk, C.A.; Warren, P.S.; Williams, N.S.G.; Clilliers, S.;
Clarkson, B.; et al. A global analysis of the impacts of urbanization on bird and plant diversity reveals key anthropogenic drivers.
Proc. R. Soc. B Biol. Sci. 2014, 281, 20133330. [CrossRef]
10. Threlfall, C.G.; Williams, N.; Hahs, A.K.; Livesley, S. Approaches to urban vegetation management and the impacts on urban bird
and bat assemblages. Landsc. Urban Plan. 2016, 153, 28–39. [CrossRef]
11. Brown, G.; Schebella, M.; Weber, D. Using participatory GIS to measure physical activity and urban park benefits. Landsc. Urban
Plan. 2014, 121, 34–44. [CrossRef]
12. Breed, M.F.; Cross, A.T.; Wallace, K.; Bradby, K.; Flies, E.; Goodwin, N.; Jones, M.; Orlando, L.; Skelly, C.; Weinstein, P.; et al.
Ecosystem Restoration: A Public Health Intervention. EcoHealth 2020, 18, 269–271. [CrossRef] [PubMed]
13. Soanes, K.; Lentini, P. When cities are the last chance for saving species. Front. Ecol. Environ. 2019, 17, 225–231. [CrossRef]
14. Elmqvist, T.; Setälä, H.; Handel, S.N.; van der Ploeg, S.; Aronson, J.; Blignaut, J.N.; Gómez-Baggethun, E.; Nowak, D.J.;
Kronenberg, J.; de Groot, R. Benefits of restoring ecosystem services in urban areas. Curr. Opin. Environ. Sustain. 2015, 14, 101–108.
[CrossRef]
15. Standish, R.J.; Hobbs, R.J.; Miller, J.R. Improving city life: Options for ecological restoration in urban landscapes and how these
might influence interactions between people and nature. Landsc. Ecol. 2013, 28, 1213–1221. [CrossRef]
16. Mata, L.; Ramalho, C.E.; Kennedy, J.; Parris, K.M.; Valentine, L.; Miller, M.; Bekessy, S.; Hurley, S.; Cumpston, Z. Bringing nature
back into cities. People Nat. 2020, 2, 350–368. [CrossRef]
17. Piana, M.R.; Hallett, R.A.; Aronson, M.F.J.; Conway, E.; Handel, S.N. Natural regeneration in urban forests is limited by
early-establishment dynamics: Implications for management. Ecol. Appl. 2021, 31, e2255. [CrossRef]
18. Wallace, K.J.; Clarkson, B.D. Urban forest restoration ecology: A review from Hamilton, New Zealand. J. R. Soc. N. Z. 2019, 49,
347–369. [CrossRef]
19. Johnson, L.R.; Handel, S.N. Restoration treatments in urban park forests drive long-term changes in vegetation trajectories.
Ecol. Appl. 2016, 26, 940–956. [CrossRef]
20. Zipper, S.C.; Schatz, J.; Singh, A.; Kucharik, C.J.; Townsend, P.A.; Ii, S.P.L. Urban heat island impacts on plant phenology:
Intra-urban variability and response to land cover. Environ. Res. Lett. 2016, 11, 054023. [CrossRef]
21. Wallace, K.J.; Laughlin, D.C.; Clarkson, B.D. Exotic weeds and fluctuating microclimate can constrain native plant regeneration in
urban forest restoration. Ecol. Appl. 2017, 27, 1268–1279. [CrossRef] [PubMed]
22. Drinnan, I.N. The search for fragmentation thresholds in a Southern Sydney Suburb. Biol. Conserv. 2005, 124, 339–349. [CrossRef]
23. Clarkson, B.D.; Wehi, P.M.; Brabyn, L.K. A spatial analysis of indigenous cover patterns and implications for ecological restoration
in urban centres, New Zealand. Urban Ecosyst. 2007, 10, 441–457. [CrossRef]
24. McIntyre, N.E. Ecology of Urban Arthropods: A Review and a Call to Action. Ann. Èntomol. Soc. Am. 2000, 93, 825–835.
[CrossRef]
25. Farnworth, B.; Innes, J.; Kelly, C.; Littler, R.; Waas, J.R. Photons and foraging: Artificial light at night generates avoidance
behaviour in male, but not female, New Zealand weta. Environ. Pollut. 2018, 236, 82–90. [CrossRef]
26. Trammell, T.L.E.; Ralston, H.A.; Scroggins, S.A.; Carreiro, M.M. Foliar production and decomposition rates in urban forests
invaded by the exotic invasive shrub, Lonicera maackii. Biol. Invasions 2011, 14, 529–545. [CrossRef]
27. La Sorte, F.A.; Aronson, M.; Williams, N.; Celesti, L.; Cilliers, S.; Clarkson, B.D.; Dolan, R.W.; Hipp, A.; Klotz, S.; Kühn, I.; et al.
Beta diversity of urban floras among European and non-European cities. Glob. Ecol. Biogeogr. 2014, 23, 769–779. [CrossRef]
28. Morgan, D.K.J.; Waas, J.R.; Innes, J. An inventory of mammalian pests in a New Zealand city. N. Z. J. Zool. 2009, 36, 23–33.
[CrossRef]
29. Hobbs, R.J.; Norton, D.A. Towards a Conceptual Framework for Restoration Ecology. Restor. Ecol. 1996, 4, 93–110. [CrossRef]
30. Suding, K.N.; Gross, K.L.; Houseman, G.R. Alternative states and positive feedbacks in restoration ecology. Trends Ecol. Evol.
2004, 19, 46–53. [CrossRef]
31. Odum, E.P. The Strategy of Ecosystem Development. Science 1969, 164, 262–270. [CrossRef] [PubMed]
32. Connell, J.H.; Slatyer, R.O. Mechanisms of Succession in Natural Communities and Their Role in Community Stability and
Organization. Am. Nat. 1977, 111, 1119–1144. [CrossRef]
33. Pickett, S.T.A.; Collins, S.; Armesto, J.J. Models, mechanisms and pathways of succession. Bot. Rev. 1987, 53, 335–371. [CrossRef]
34. Hobbs, R.J.; Walker, L.R.; Walker, J. Integrating Restoration and Succession. In Linking Restoration and Ecological Succession;
Walker, L.R., Walker, J., Hobbs, R.J., Eds.; Springer: New York, NY, USA, 2007; pp. 168–179.
35. Schick, A.; Porembski, S.; Hobson, P.R.; Ibisch, P.L. Classification of key ecological attributes and stresses of biodiversity for
ecosystem-based conservation assessments and management. Ecol. Complex. 2019, 38, 98–111. [CrossRef]
36. Timpane-Padgham, B.L.; Beechie, T.; Klinger, T. A systematic review of ecological attributes that confer resilience to climate
change in environmental restoration. PLoS ONE 2017, 12, e0173812. [CrossRef]You can also read