Sprinkling: An Approach to Describe Urbanization Dynamics in Italy
←
→
Page content transcription
If your browser does not render page correctly, please read the page content below
sustainability

Article
Sprinkling: An Approach to Describe Urbanization
Dynamics in Italy
Bernardino Romano *, Francesco Zullo, Lorena Fiorini, Serena Ciabò and Alessandro Marucci
 University of L’Aquila, DICEAA, Via G. Gronchi, 18-67100 L’Aquila, Italy; francesco.zullo@univaq.it (F.Z.);
 lorena.fiorini@graduate.univaq.it (L.F.); serenaciabo@gmail.com (S.C.); alessandro.marucci@univaq.it (A.M.)
 * Correspondence: bernardino.romano@univaq.it

 Academic Editors: Federico Martellozzo and Beniamino Murgante
 Received: 19 November 2016; Accepted: 5 January 2017; Published: 12 January 2017

 Abstract: This paper presents research which has defined a new typology of urban patterns
 (sprinkling), different from the internationally recognized standard urban sprawl, as well as various
 indicators that have been implemented to measure sprinkling. It is important to highlight that the
 damage caused to the environment and communities by urban sprinkling is much more serious
 and irreversible than that notoriously caused by urban sprawl. The paper introduces the difficult
 methodological and planning aspects of retrofitting (de-sprinkling), a true challenge for land
 management. We argue that even partial inversion of many negative effects is impossible in the short
 term. Only medium- to long-term, organized, and politically coordinated programs can tackle the
 various issues associated with sprinkling.

 Keywords: land take; urban–rural pattern; urban sprinkling

1. Introduction
     This research defines a new typology of land take that is different from the internationally
recognized standard urban sprawl, which scientific literature has consolidated in terms of its
characteristics and the related consequences on environmental, economic, social and territorial
balances [1–6]. Great interest has also been manifested in rural areas, especially in countries such as
China, which is in rapid expansion [7–11].
     Taking into consideration a geographical sample of the Italian Peninsula, fundamental differences
were identified between the globally diffused sprawl model and the national modalities of land take
with reference to vast tracts of rural and hill areas. Therefore, in Italy’s case, a different definition is
suggested, namely “sprinkling”, as it is a better fit to represent the configuration of the peninsula’s
urbanized areas. Sprinkling is also present in other southern European countries and, although in
different ways, also in other continental areas. According to Merriam-Webster’s definition, sprawl is
“the spreading of urban developments (as houses and shopping centers) on undeveloped land near a
city”, whereas the word “sprinkling” means “a small quantity falling in scattered drops or particles”.
This land take modality has already been classified experimentally through ad hoc indicators [12,13].
The study sample is an emblematical configuration of the urbanized areas in Italy’s chief plains,
but nearly the whole national territory is characterized by this form of land take, without significant
meridian differences.
     The issues caused by ordinary urban management are massive:

a)    Land take has extremely high energy costs for both the public and private sectors [14];
b)    The supply of technical/economic/organizational utilities is particularly onerous, due to the
      distance among urbanized areas and their extremely low demographic density [15];

Sustainability 2017, 9, 97; doi:10.3390/su9010097                          www.mdpi.com/journal/sustainability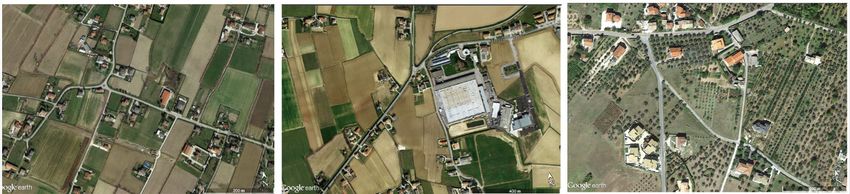
Sustainability 2017, 9, 97                                                                            2 of 17

c)     Landscapes and ecosystems are subject to drastic quality degradation due to partial alteration,
       disturbance, fragmentation, and loss, even when those changes are remote [16,17].

     This study begins by providing an analytical outline of the technical characteristics of sprinkling.
Next, it introduces the difficult methodological and planning aspects of its retrofit, “de-sprinkling”,
a true challenge for land management. It is important to highlight that the damage caused to the
environment and communities by urban sprinkling is much more serious and irreversible than that
notoriously caused by urban sprawl. For this reason, even partial inversion of many negative effects
is basically impossible in the short term. Only medium- to long-term, organized, and politically
coordinated programs can tackle the various issues involved in de-sprinkling.
     It is currently acknowledged that, in Italy, there is a need to reorganize the distribution of buildings
and the related functional areas, so as to contain expansion and make development more sustainable
both in environmental and social/economic terms. The conclusions reached by this research provide
fundamental insights capable of helping tailor future rules aimed at regulating land take behavior in
many regional communities.

2. Material and Methods
      Despite its various configurations, urban sprawl is characterized by several aspects that
are standard even across international comparisons. It is a model associated with strong land
transformation and remarkable land consumption, and in recent years there has been an increase
in the scientific literature on urban sprawl [18]. When researching the term “sprawl” on Google’s
research engine, about seven million links are extracted, which in almost all cases refer to the urban
phenomenon; few exceptions refer to a different meaning of the noun. One of its distinctive traits is
low density housing, which finds one of its most striking examples worldwide in the city of Atlanta,
Georgia [19] with an extension of more than 5000 km2 (a little smaller than the Italian region of Liguria)
and fewer than 3.5 million inhabitants. In other words, the population density of Atlanta is less than
700 people/km2 , equal to an urban density slightly more than three times higher than the Italian
national (territorial) density and 1.5 times that of the density of the regions of Campania or Lombardy.
      Generally speaking, urbanized area characterized by sprawl is delimited and compact, with
a homogeneous use pattern planned through apportionment, with mainly (but not necessarily)
detached/semi-detached houses. The Asian example in particular suggests much more intensive
typologies with multi-floor closely ranged buildings [20–22]. In this case, collective spaces and
services are realized through coordinated interventions, often with reference to the architecture of
the buildings. Internationally, sprawl develops according to models that, although differing in parts,
nonetheless follow various standards related to the distributive layouts of buildings and streets and
town planning parameters. To investigate this aspect, several samples of urban patterns were selected
from metropolitan hinterlands in different continents. The aim was to understand their similarities
and differences with reference to both spatial organization and technical indicators. The purpose of
this analysis is to highlight the clear differences between the international standard of sprawl and the
model prevailing in Italy, which we call “sprinkling”. In our study we found that sprinkling has been
widely used in the territory of the Umbria region, where about 10 years of research allows considerably
detailed understanding of the settlement characteristics and its evolutionary metrics.
      To this end Table 1 shows a series of sprawl models providing the distinctive land indicators that
form the urban agglomeration mosaic. The territory values must keep into consideration the incidence
of the public road system (on average assessable in the order of 10%) and the variable quantity of
collective services. As evident, the housing density is not much spread out, and all the examples are
characterized by the actual town planning and the rational distribution of the buildings, also in the
presence of strong differences as to typology and economic quality. These characteristics are evident
also in cases of higher density sprawl, as shown in Table 1 referring to the Australian, Japanese and
Chinese examples. Urban sprawl is typically distinguished by a growth aggregated to pre-existent
parts of the city, thus maintaining fabric continuity while increasing its spatial development. In other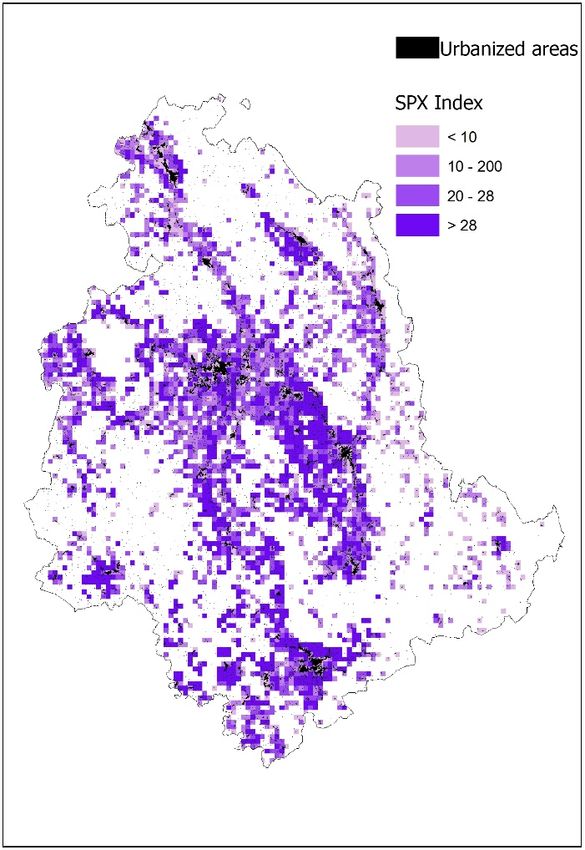
Sustainability 2017, 9, 97                                                                                                      3 of 17

words, the urbanized area always maintains a net perimeter as to the rural or forest surrounding
context, even when the growth phenomenon is very intense.

          Table 1. International examples of sprawl with the assessment of distinctive urban parameters.

    Urban                    Building Area   Floor Area       Useful Floor   Coverage Ratio   Building Density   Population Density
                Location
    Pattern                      (mq)           (mq)           Area (mq)          (%)            (build./ha)        (inhab./ha)

                 Los
                                 800            200               400             0.25              12.5               30–50
                Angeles

                 Atlanta         600            150               300             0.25              16                 30–50

                London           500            70                140             0.14              20                 30–40

                  Paris          800            120               240             0.15              12.5               20–30

                 Berlin
                                 600            60                60              0.1               16                 20–30
                 (rural)

                 Sidney          600            250               500             0.4               16                 30–40

                                                           TYPES OF “DENSE” SPRAWL

                 Sidney          500            300               600             0.6               20                80–100

                 Tokyo           100            90                180             0.9               100               200–300

                                                      TYPES OF “INTENSIVE” SPRAWL
                                                      1
                                                      11
                                                      1
                                                    1
                Shangai          1000           400 1            2000             0.4               10                500–800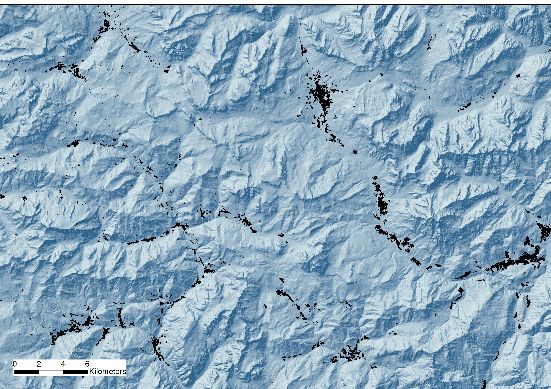
Sustainability 2017, 9, 97 4 of 17
Italian sprawl can be identified in the early 20th century cities: the difficulties in moving around
obliged people to build houses as close as possible to the consolidated historic centers, which continued
to remain the places where fundamental public services were provided. Starting from the second half of
the 20th century, these schemes entered into crisis due to vast use of private mobility and a progressive
reduction of town planning rules aimed at collective interests. Cities lost cohesion, spreading into the
countryside on the basis of individual initiatives and on the land available. In some cases, this sprawl
was supported by planning; in others, it was the result of abusive initiatives encouraged by amnesties
for the infringement of building regulations, which had already been implemented three times and
then relaunched continuously in the parliamentary chambers. The second half of the 20th century is
still characterized by examples of sprawl, for instance along the Adriatic coast [23], which in 50 years
averaged 10 km a year of urbanized waterfront development [24]. In this case, the apportionments,
although rather coarse, were planned. Generally speaking, the buildings were of poor quality, almost
always made of blocks of flats and built without an analogous and concurrent planning of utilities.
Other Italian development can be comprehended by a different category, which can be called
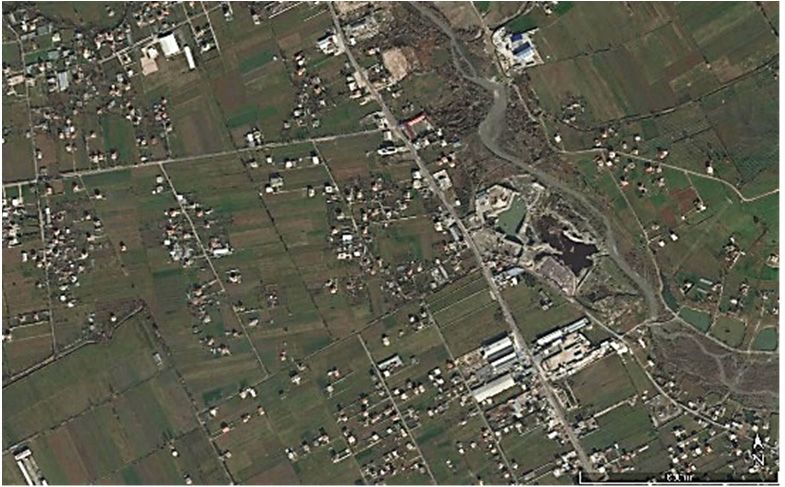
“sprinkling”. This distributive scheme is typical of Italian urban development, though it is possible
to identify it also in other countries. Figure 1 shows various cases of Italian plain sectors, and
Figure 2 highlights similar situations in Asia and in the Balkan area. This model is very different
from the international standard sprawl: in this case, land take follows a partially spontaneous
development
Sustainability 2017,subject
9, 97 to low controls, and is added onto a historical structure. The built-up areas 5 of 17
are not homogeneous in size and use and have linear or spread out features with a mixture of rural,
due to serious
residential, ecologic
industrial erosion
and and
tertiary fragmentation
functions. caused by urban
Land parameters linearization
are largely andsince
indefinable the proliferation
the surfaces
streets required
of pertinence by urban
of single sprawl
buildings [30–32]. different and public spaces referring to specific levels of
are extremely
use areSomenot of the data mentioned
recognizable. The mainhere were drawn
differences betweenfromthealmost 10 years
two models canofberesearch
summarized (2006–2015)
by the
assessing the
following evolution and dynamics of Italian urbanized areas starting from the years after WWII.
definitions:
We evaluated the data following a non-sampled measured method, using a scale of 1:20,000 for the
Sprawl:
1950s (source: Urban
Militarystructure planned
Geographic through apportionment,
Institute—IGM), with a prevalence
and of 1:10,000–1:5000 of detached/
for the following period
semi-detached houses. Interventions for realizing collective
up to the year 2000 (source: Land Use Regional Maps). Qualitative and quantitative phenomena spaces and utilities are
coordinated, often with reference to the architecture of the
connected to urban growth were analyzed through various indicators which then allowed us tobuildings. The urban fabric
is homogeneous
identify the prevailing modelsas into its use.
various Building
areas of the density: 10–20 build./ha. Population density:
country [33,34].
20–50 inhab./ha, Coverage ratio: 10%–30%.
Taking into consideration several threshold values, this study identified new trajectories of
Sprinkling:
regional Land taketowards
convergence with a partially
said valuesspontaneous development,
within a timeframe or subject to
of remarkable low controls,
statistical adding
validity. The
on to a historical structure. The built-up areas are not homogeneous
indicators used allowed us to classify land take behaviors throughout a peninsula that, as is known, in size and use,
with a mixture
has always presented deepofeconomic,
rural, residential, industrial,
social and culturaland tertiary functions.
differences Building
between north anddensity:
south,
differences which 0.1 build./ha,
governmentalPopulation density:
policies 0.2–0.5
have never inhab./ha,
been Coverage ratio: 0.5%–1%.
able to balance.
Figure 1.
Figure 1. Examples
Examples of
of sprinkling
sprinkling in
in Italy’s
Italy’s flat
flat and
and hill
hill areas (from left:
areas (from left: Lombardy,
Lombardy, Veneto and
Veneto and
Campania). Source:
Campania). Source: Google
Google Earth
Earth 2016.
2016.
The current Italian urban landscape is the result of a transformation process started back in the
years after WWII. From the 1980s on, this process became increasingly widespread and weakened due
to regional, provincial and municipal planning [25].
Local land take models are conditioned by the distribution of mountain ranges, but also by limited
regulatory power in implementing plans. In fact, it is worth recalling that regulatory power is managed
(a) (b)
Figure 2. (a) Example of urban-rural fabric highly linearized in the northern area of Shanghai in the
Sustainability 2017, 9, 97 5 of 17
in Italy by 1.more
Figure than 8000
Examples individual
of sprinkling municipalities;
in Italy’s thatareas
flat and hill is, at(from
a very low
left: decisional
Lombardy, administrative
Veneto and
level, considering that the national average size of a municipality is 36 km 2 (6 × 6 km).
Campania). Source: Google Earth 2016.
(a) (b)
Figure 2. (a) Example of urban-rural fabric highly linearized in the northern area of Shanghai in the
Figure 2. (a) Example of urban-rural fabric highly linearized in the northern area of Shanghai in the
Jiangsu
Jiangsuregion
regionbetween
betweenthetheeastern
easternsection
sectionofofthe
theriver
riverChang
ChangJiang
Jiang(Blue
(BlueRiver)
River)and
andthe
thesouthwest
southwest
coast
coast of the Yellow Sea; (b) Urban “sprinkling-like” pattern in a flat area in Albania. Source:Google
of the Yellow Sea; (b) Urban “sprinkling-like” pattern in a flat area in Albania. Source: Google
Earth
Earth2016.
2016.
3. Results
This situation has led to a systematic change of important rural and cultural landscapes. It has also
On the vast
introduced basisareas
of data extracted
to flood from
risk, with land use
dramatic regional maps
consequences updated
for the after
safety of the year
housing 2000, the
and productive
Italian
areas,urbanized
which every surface is currently
year increase theirassessable at two million
extreme vulnerability duehectares (7% of changes
to the climate the country),
taking excluding
place [26].
streets, outside of densely urban areas. The last 50 years have been characterized
All this has caused a serious decrease in the quality of anthropic life: the widespread land takes by extremely quick
have
acceleration, considering
very high energy that incosts,
management the years immediately
low overall after
resilience WWIIdifficulty
[27,28], the density of urbanization
in providing servicesdid
and
not reachtransport
public 2%. Therefore, the mean
and therefore speed of transformation
a generalized dependence on is equal to mobility
private more than 80 all
[29], ha/day
issues(Figures
that the
3 Italian
and 4).scientific literature has been highlighting for the last 15 years. Moreover, the rural, mountain
andThe changes
coastal occurring
landscapes have in undergone
urban structures have affected
deep changes, to theItalian
point municipalities in different
that some of these ways,
landscapes are
depending on the amount of population and the geographic relationships with
far from the image historically held by international tourism. A further effect, already highlightedthe country’s main
metropolitan areas. Based
long ago, concerns on the
a decrease in classification
the quality ofof the Italianand
ecosystems National
relatedInstitute
servicesofdue
Statistics (ISTAT)
to serious of
ecologic
the municipalities’
erosion demographic
and fragmentation causedsize,
byFigure
urban5linearization
shows an analogous polynomial distribution
and the proliferation for bothby
of streets required
the demographic (∆Dem)
urban sprawl [30–32]. and urban (∆Urb) variations (R 2 higher than 0.85 up to 0.92). Small cities
Some of the data mentioned here were drawn from almost 10 years of research (2006–2015)
assessing the evolution and dynamics of Italian urbanized areas starting from the years after WWII.
We evaluated the data following a non-sampled measured method, using a scale of 1:20,000 for the
1950s (source: Military Geographic Institute—IGM), and of 1:10,000–1:5000 for the following period up
to the year 2000 (source: Land Use Regional Maps). Qualitative and quantitative phenomena connected
to urban growth were analyzed through various indicators which then allowed us to identify the
prevailing models in various areas of the country [33,34].
Taking into consideration several threshold values, this study identified new trajectories of
regional convergence towards said values within a timeframe of remarkable statistical validity.
The indicators used allowed us to classify land take behaviors throughout a peninsula that, as is
known, has always presented deep economic, social and cultural differences between north and south,
differences which governmental policies have never been able to balance.
3. Results
On the basis of data extracted from land use regional maps updated after the year 2000, the Italian
urbanized surface is currently assessable at two million hectares (7% of the country), excluding
streets, outside of densely urban areas. The last 50 years have been characterized by extremely
quick acceleration, considering that in the years immediately after WWII the density of urbanization
did not reach 2%. Therefore, the mean speed of transformation is equal to more than 80 ha/day
(Figures 3 and 4).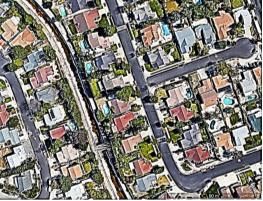
(up to 3000 inhabitants) have experienced a considerable decrease in population, despite having
 doubled their urbanized areas. The cities showing the most important dynamics are those ranging
doubled their urbanized areas. The cities showing the most important dynamics are those ranging
 from 5000 to 60,000 inhabitants (an average Italian city), in which a 50% increase of population
from 5000 to 60,000 inhabitants (an average Italian city), in which a 50% increase of population
 corresponds to an increase of urbanized areas higher than 300% (a six-fold increase). Big
corresponds to an increase of urbanized areas higher than 300% (a six-fold increase). Big
 municipalities with more than 250,000 inhabitants show almost stable demographic dynamics and a
municipalities with more than 250,000 inhabitants show almost stable demographic dynamics and a
 1.5-fold urbanization
Sustainability 2017, 9, 97 increase.                                                       6 of 17
1.5-fold urbanization increase.

      Figure 3. Regional variations of the density of urbanization from the years after WWII to the period
     Figure 3.3. Regional variations of the density of urbanization from the years after WWII to the period
                                                                                                     period
      after the year 2000. (*) Northern regions, (+) central regions, (-) southern regions.
     after the year 2000. (*) Northern regions, (+) central regions, (-) southern regions.

      Figure 4. Urbanization variation rates and mean land take speed in Italian regions from the years after
     Figure 4. Urbanization variation rates and mean land take speed in Italian regions from the years after
      WWII to the period after the year 2000.
     WWII to
     WWII  to the
               the period
                   period after
                          after the
                                the year
                                    year 2000.
                                         2000.

       However, the major variations across half a century were not found in the large cities, but in the
      However, theoccurring
      The changes
                      major variations
                                in within
                                          across half ahave
                                   urban structures
                                                          century  wereItalian
                                                              affected
                                                                          not found      in the largeincities,
                                                                                   municipalities
                                                                                                               but in
                                                                                                        different
                                                                                                                      the
                                                                                                                   ways,
 surrounding    municipalities,             a range of 10 km.       In fact, if the     large municipalities      had,  on
surrounding
depending
               municipalities,    within   a  range   of  10 km.   In  fact,  if  the  large  municipalities     had,  on
 average, a on  the=amount
             ∆Urb     136% and of population
                                   a ∆Dem = 14%, and the
                                                       the geographic
                                                           values in theirrelationships
                                                                               hinterlandswith     the country’s
                                                                                              amounted      to 200% main
                                                                                                                      and
average, a ∆Urb
metropolitan
                   = 136%   and a ∆Dem
               areas. confirming
                      Based on thethe
                                             = 14%, the the
                                       classification
                                                           values  in their  hinterlands amounted          to (ISTAT)
                                                                                                               200% and
 38%, respectively,                       understoodofpattern Italian  National Institute
                                                                   of peripheral               of Statistics
                                                                                       land take.   Although     this isofa
38%, respectively, confirming the understood pattern of peripheral land take. Although this is a
the
 common phenomenon in many countries, in Italy it takes on much more problematic features,the
    municipalities’ demographic      size, Figure  5 shows   an analogous      polynomial     distribution   for both   as
common phenomenon in many countries, in Italy it2 takes on much more problematic features, as
demographic
 mentioned and (∆Dem)
                  as willand
                          be urban    (∆Urb)
                              discussed        variations
                                           in more   detail(R   higher than 0.85 up to 0.92). Small cities (up to
                                                             hereafter.
mentioned and as will be discussed in more detail hereafter.
3000 inhabitants)   have experienced
       One very important      indicator aofconsiderable     decrease in
                                               land take behaviors       is population,      despite having
                                                                             per capita urbanization.           doubled
                                                                                                              The  values
      One very important indicator of land take behaviors is per capita urbanization. The values
their urbanized
 referring to theareas.
                  years The
                         aftercities
                               WWII  showing    the mostregions
                                        differ between     important
                                                                   with dynamics
                                                                          an economy  are those
                                                                                           basedranging
                                                                                                   more on from   5000 to
                                                                                                              agriculture
referring to the years  after WWII differ between regions with an economy based                   more on agriculture
60,000  inhabitants
 (less than          (an average
             100 m2/inh)            Italianalready
                           and regions      city), inindustrialized
                                                       which a 50% increase
                                                                       (more than  of population
                                                                                        200 m2/inh).corresponds
                                                                                                       Currently,to    an
                                                                                                                     most
(less than 100 m2/inh) and regions2 already industrialized (more than 200 m2/inh). Currently, most
increase  of urbanized  areas   higher   than  300%   (a six-fold increase).     Big municipalities
 regions have an average of 360 m /inh (with a standard deviation that has halved, passing from 60%    with   more  than
regions have an average of 360 m2/inh (with a standard deviation that has halved, passing from 60%
250,000
 to 30%),inhabitants  show
           which is also     almostEurope’s
                          western     stable demographic
                                                average.       dynamics and a 1.5-fold urbanization increase.
to 30%), which is also western Europe’s average.
      However, the major variations across half a century were not found in the large cities, but in the
surrounding municipalities, within a range of 10 km. In fact, if the large municipalities had, on average,
a ∆Urb = 136% and a ∆Dem = 14%, the values in their hinterlands amounted to 200% and 38%,
respectively, confirming the understood pattern of peripheral land take. Although this is a common
phenomenon in many countries, in Italy it takes on much more problematic features, as mentioned
and as will be discussed in more detail hereafter.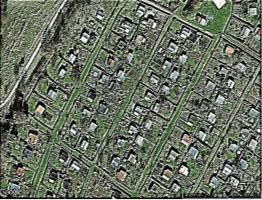
Sustainability 2017, 9, 97 7 of 17
Sustainability 2017, 9, 97 7 of 17
Populationand
Figure 5. Population andurbanization
urbanizationvariations
variationsononthe
thebasis
basisofof ISTAT’s
ISTAT’s demographic
demographic categories
categories of
of municipalities.
municipalities.
Sprinkling
One prevails in
very important the main
indicator northern
of land take plains
behaviors(Piedmont,
is per capitaLombardy, Veneto and
urbanization. Emilia
The values
Romagna), but it is also found in the Mediterranean hill and coastal
referring to the years after WWII differ between regions with an economy based more on agriculture areas and in the smaller internal
or coastal
(less than plains
100 mof central
2 /inh) and southern
regionsItaly. Dispersion
already modalities
industrialized (more have changed
than 200 min the mountainous
2 /inh). Currently,
areas where land take is concentrated on
2 the valley floor with linearization
most regions have an average of 360 m /inh (with a standard deviation that has halved, passing extended even for dozens
from
of kilometers and with variable
60% to 30%), which is also western Europe’s average. densities (Figure 6). The dispersion of buildings and related
functional areas is
Sprinkling impossible
prevails in theto intercept and therefore
main northern plains measure
(Piedmont, through cartographic
Lombardy, Veneto surveys, if not
and Emilia
extremely detailed. Therefore, it is basically impossible to register, take
Romagna), but it is also found in the Mediterranean hill and coastal areas and in the smaller internal a census, calculate and thus
control the urban conversion of lands with methods and metrics homologated
or coastal plains of central southern Italy. Dispersion modalities have changed in the mountainous in their definitions and
processes.
areas whereNational
land takeor regional structures
is concentrated for monitoring
on the valley floor with urbanized
linearization land are few
extended even and forstill
dozensnot
coordinated; there are no shared protocols and the data available are rather
of kilometers and with variable densities (Figure 6). The dispersion of buildings and related functional approximate. Even this
problem
areas is due to land
is impossible take models
to intercept [35,36]. Other
and therefore measurecountries,
through with more compact
cartographic urbanized
surveys, areas, can
if not extremely
make useTherefore,
detailed. of European-managed remote sensing
it is basically impossible products,
to register, such ascalculate
take a census, Corine and Landthus Cover (CLC).
control the
However, Table 2 shows that this is not possible for Italy due to the
urban conversion of lands with methods and metrics homologated in their definitions and processes.extremely reduced size of various
urbanizedorareas,
National which
regional cannot befor
structures caught by satellite
monitoring readings
urbanized landwitharea few
minimum
and stillcartographic unit of
not coordinated;
25 ha and a minimum width of 100 m detectable polygons. Considering
there are no shared protocols and the data available are rather approximate. Even this problem is all 20 regions, the satellite
survey
due averages
to land take 26%models less[35,36].
detail thanOther thecountries,
photographic with one.
moreIncompact
some cases, there isareas,
urbanized a detailcanloss
make of
more
use ofthan 50% when the land
European-managed remote take areas are
sensing very small:
products, such asthat is, at Land
Corine the level
Coverof a(CLC).
singleHowever,
building
drowned in an agricultural area.
Table 2 shows that this is not possible for Italy due to the extremely reduced size of various urbanized
areas,Therefore,
which cannot morebe than one-fourth
caught of Italy’s
by satellite urbanized
readings with a areas
minimum escape CLC’s survey.
cartographic unitTheof 25curves
ha and in
aFigure
minimum7 show the clear
width of 100 relationship
m detectable between the average
polygons. size of all
Considering the 20built-up
regions, area
the(broken
satellite line) and
survey
CLC’s ability to intercept its presence. This attests to a relative validity
averages 26% less detail than the photographic one. In some cases, there is a detail loss of more than of the European satellite
datum
50% onlythe
when forland
the sixtake Italian
areasregions
are very forsmall:
whichthat error
is,rates
at theare lower
level of athan 10%
single (Figure drowned
building 7). At the insame an
time, though,
agricultural area. it highlights the inefficacy of the satellite dataset throughout the rest of the national
territory, at leastmore
Therefore, withthanreference to urbanized
one-fourth of Italy’ssurfaces.
urbanized areas escape CLC’s survey. The curves in
Figure 7 show the clear relationship between the average size of the built-up area (broken line) and
CLC’s ability to intercept its presence. This attests to a relative validity of the European satellite datum
only for the six Italian regions for which error rates are lower than 10% (Figure 7). At the same time,
though, it highlights the inefficacy of the satellite dataset throughout the rest of the national territory,
at least with reference to urbanized surfaces.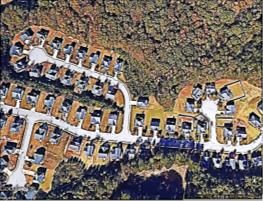
Sustainability 2017, 9, 97                                                                                               8 of 17
Sustainability 2017, 9, 97                                                                                              8 of 17
Sustainability 2017, 9, 97                                                                                              8 of 17

      A                                                          B
      A                                                          B

      C                                                          D
      C                                                          D

      Figure 6. Models of morphological linearization in the valley and hill areas of the Adriatic coast (A)
      Figure 6.
      Figure   6. Models of morphological
                             morphologicallinearization
                                              linearizationininthethevalley
                                                                      valleyand hillhill
                                                                              and    areas  of the
                                                                                         areas      Adriatic
                                                                                                of the       coast
                                                                                                       Adriatic    (A) and
                                                                                                                coast  (A)
      and of the Alpine valleys (B). Models of infrastructural linearization and of extreme dispersion
      of theofAlpine
      and             valleysvalleys
               the Alpine     (B). Models  of infrastructural
                                     (B). Models                linearization
                                                    of infrastructural         and of extreme
                                                                           linearization    and ofdispersion
                                                                                                     extreme (sprinkling)
                                                                                                               dispersion
      (sprinkling) in the flat agricultural areas (C,D).
      in the flat agricultural
      (sprinkling)              areas (C,D). areas (C,D).
                    in the flat agricultural

      Figure 7. Relationship between the mean size of the built-up areas, indicated by the broken line, and
      Figure
      Figure 7.
             7. Relationship
                Relationship  between   the
                               betweenthe    mean
                                             mean size
                                         theurbanized  of
                                                        of the
                                                   sizeareas    built-up
                                                            theonly
                                                                built-up areas, indicated   by the  broken   line, and
      CLC-CUS    % gap in measuring                                 with areas,  indicated
                                                                          reference  to the by
                                                                                            six the  broken
                                                                                                Italian      line,with
                                                                                                         regions   and
      CLC-CUS
      CLC-CUS    %
                 % gap
                   gap  in
                         in measuring
                            measuring  the
                                        the urbanized
                                            urbanized  areas
                                                       areas   only
                                                               only with
                                                                     with reference
                                                                          reference to
                                                                                     to the
                                                                                        the six
                                                                                            six Italian
                                                                                                 Italian regions
                                                                                                         regions  with
                                                                                                                   with
      an error contained within 10%.
      an
      an error
         error contained
               contained within
                           within 10%.
                                  10%.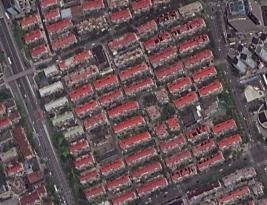
Sustainability 2017, 9, 97 9 of 17
Sustainability 2017, 9, 97 9 of 17
Table 2. The gap between CLC and regional cartography in measuring urbanized areas. The comparison was carried out taking into consideration CLC’s time-section
closest to Table 2. The
the date on gap between
which CLC anddatasets
the regional regional cartography in measuring urbanized areas. The comparison was carried out taking into consideration CLC’s time-section
were updated.
closest to the date on which the regional datasets were updated.
Urbanized
UrbanizedArea
Area(ha)
(ha) Regional Data
Regional Data
REGIONS Difference %
REGIONS CLC Regional Data Difference %Type and Scale Updating
CLC Regional Data Type and Scale Updating
Molise 5123.42 12,028.05 0.57 LUM 10k 2002
Molise
Piedmont 5123.42
111,100.05 12,028.05
224,410.99 0.57
0.50 RTMLUM
5k 10k 2002
2006
Piedmont
Emilia Romagna 111,100.05
111,252.73 224,410.99
206,369.06 0.50
0.46 LUM 10k 5k
RTM 2006
2008
Emilia Romagna
Veneto 111,252.73
150,319.42 206,369.06
213,532.15 0.46
0.30 LUMLUM10k 10k 2008
2006
Veneto
Puglia 150,319.42
90,478.03 213,532.15
128,190.03 0.30
0.29 LUMLUM10k 10k 2006
2006
Puglia 90,478.03 128,190.03 0.29
0.29
LUM 10k 2006
Calabria 56,506.33 79,779.47 ISTAT 2011 2011
Calabria 56,506.33 79,779.47 0.29 ISTAT 2011 2011
Abruzzo 26,989.85 36,740.00 0.27 LUM 10k 1997
Abruzzo 26,989.85 36,740.00 0.27 LUM 10k 1997
Tuscany 100,897.87 136,357.68 0.26 LUM 10k 2007
Tuscany 100,897.87 136,357.68 0.26 LUM 10k 2007
Marche 37,529.1 50,580.37 0.26 LUM 10k 1990
Marche 37,529.1 50,580.37 0.26 LUM 10k 1990
Friuli V. G. 52,992.43 69,719.61 0.24 LUM 10k 2000
Friuli V. G. 52,992.43 69,719.61 0.24 LUM 10k 2000
Lazio
Lazio 104,254.81
104,254.81 132,078.31
132,078.31 0.21
0.21 LUMLUM10k 10k 2004
2004
Lombardy
Lombardy 270,739.26
270,739.26 335,882.1
335,882.1 0.19
0.19 LUMLUM10k 10k 2009
2009
Basilicata
Basilicata 15,212.4
15,212.4 17,764.66
17,764.66 0.14
0.14 RTMRTM
5k 5k 2010
2010
Umbria
Umbria 26,064.95
26,064.95 30,124.74
30,124.74 0.13
0.13 GBMGBM10k 10k 2002
2002
Liguria
Liguria 26,921.58
26,921.58 31,047.42
31,047.42 0.13
0.13 LUMLUM10k 10k 2000
2000
Sardinia
Sardinia 67,880.54
67,880.54 78,061.88
78,061.88 0.13
0.13 LUMLUM25k 25k 2008
2008
Trentino Alto
Alto Adige
Adige 28,203.8
28,203.8 29,604.11
29,604.11 0.05
0.05 LUMLUM10k 10k 2005
2005
Sicily
Sicily 121,229.63
121,229.63 126,690.16
126,690.16 0.04
0.04 LUMLUM10k 10k 2007
2007
Campania
Campania 99,245.75
99,245.75 101,163.93
101,163.93 0.02
0.02 AM AM
50k 50k 2009
2009
d’Aosta
Valle d’Aosta 4715.1
4715.1 4709.36
4709.36 0.00
0.00 NM NM
50k 50k 2000
2000
Total
Total 1,507,657.1
1,507,657.1 2,044,834.08
2,044,834.08 0.26
0.26
GBM = geobotanical map, LUM = land use map, NM = nature map, RTM = regional technical map, AM = agricultural map.
GBM = geobotanical map, LUM = land use map, NM = nature map, RTM = regional technical map, AM = agricultural map.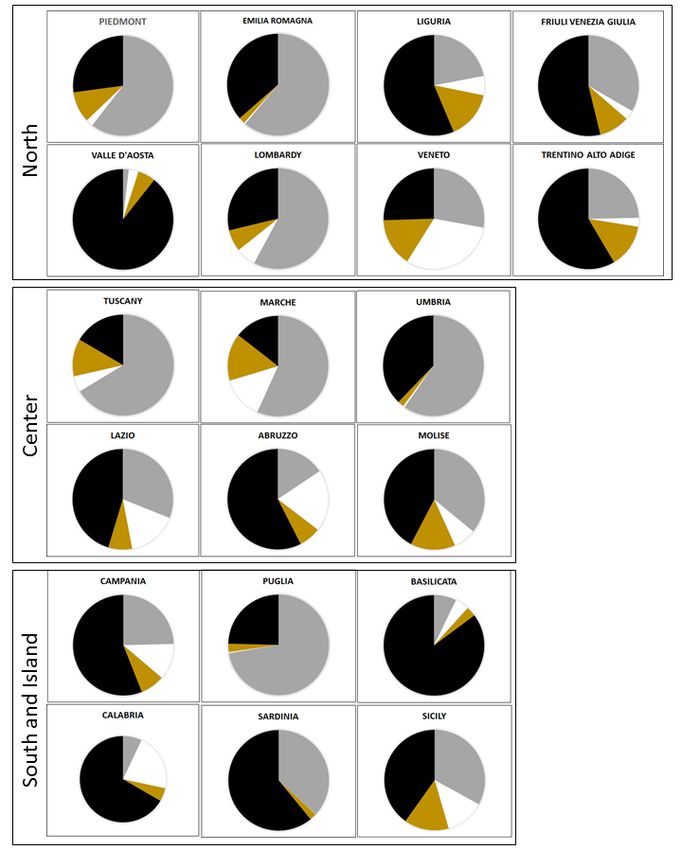
Sustainability 2017, 9, 97                                                                        10 of 17

      The morphological and historical-economic differences that characterize Italy, especially in the
meridian direction, cause a very differentiated distribution of the urban areas in the 20 regions in
which the country is divided. Half of the urban surfaces are concentrated in the plains (a morphology
that involves less than a fourth of the territory), identifying a 12% urbanization density. This value
has more than doubled since the 1950s (when this index was below 5%), with an average speed of
transformation near 43 ha/day. The hill areas, which represent less than half of the national territory,
are 6% urbanized, which means that 22% of total urbanized areas are concentrated in the hills, with an
average speed of transformation that has been a little less than 20 ha/day. Even the mountainous areas
have reached 2% urbanization, versus six per thousand in the 1950s, with strong concentrations along
the valley floors (Figure 6).
      The higher values of urban density in the flat regions are clearly due to the ease with which these
areas can be connected with industrial/commercial localizations and services in general. The hill
areas attract residential interest due to reasons of climate and landscape, the mountains mainly due
to tourism.
      The influence of the country’s morphology is very evident along the peninsular arch, where the
meridian line of the Apennine chain has always limited urban development in internal areas while
being very intense along the coasts. Currently, less than 30% of the over-4000-km peninsular coast is
free from urbanization in comparison to more than 60% in the 1950s: 26% of the 788 km Ionian coast,
30% of the 1940 km Tyrrhenian coast and 31% of the 1472 km Adriatic coast. The urbanization density
of the 500 m coast is five times the national average (34% vs. 7%) with urbanization peaks of 40% and
even 50% in some regional sectors, such as Liguria, Emilia Romagna, Friuli and Calabria. Increases in
urban density are evident also in the areas leading to the coasts, as they have been affected positively
by the economic and transport advantages of the fast infrastructural lines that pass through Italy along
the two coastal sides.
      This study analyzed the growth models of the urbanized areas in depth, through a dispersion
index (Urban Dispersion Index, UDI) formulated as follows and applied to all the Italian regions on a
1 × 1 km plot (Figure 8) together with the urban density (UD):

                                                      Nuc
                                             UDI =                                                    (1)
                                                       A

where Nuc is the number of the urban nuclei and A is the area of reference (km2 ).
     The graphs in Figure 8 show that, in almost all regions, the prevailing model of urban growth is
the intensified dispersion model (UDI+). The exceptions are Veneto, with an important variation of
the UDI model due to phenomena of linearization along the road system of the plains, and Abruzzo
and Calabria, where the steep morphology has led to the establishment of linearizations along the
valleys. Regions with weak economies or with a difficult morphology also report invariability models
(no change) involving more than 50% of the territory (up to more than 80% in Basilicata): this is the
case for Aosta Valley, Trentino A.A., Liguria, Abruzzo, Basilicata, Calabria and Sardinia. The opposite
model is found in Piedmont, Lombardy, Emilia Romagna, Tuscany, Marche, Umbria and Apulia, where
the dispersion phenomenon involves more than half of the regional territory. All regions, on average,
have not balanced much (maximum of 30% of the territory) and have substantially avoided aggregated
urban growth (UDI0 + DU) which represents a generalized standard for northern European countries.
     However, other indicators for measuring sprinkling are being tested, and these are more complex
than the UDI-DU combination described above.
Sustainability 2017, 9, 97 11 of 17
Sustainability 2017, 9, 97 11 of 17
Figure 8.
Figure 8. Indicators
Indicators and models
models of
of urban
urbangrowth
growthin
inthe
theItalian
Italianregions.
regions.Sustainability 2017, 9, 97 12 of 17
Sustainability 2017, 9, 97 12 of 17
AAfurther
furtherclarification
clarificationofofthe
thecharacteristics
characteristics of
of the model under
the model underinvestigation
investigationcomes
comes from
from thethe
calculation of the Sprinkling Index (SPX), expressed as follows. An example is provided for the
calculation of the Sprinkling Index (SPX), expressed as follows. An example is provided for the regionregion
of Umbria (Figure 9),9),always 2 plot:
of Umbria (Figure alwayswith
withreference
referenceto
toaaregular
regular 11 km
km2 plot:
q
∗ ∗
Σ = ( xi(− x ∗ ))2 +( (yi −)y∗ )2 (2)
SPX = (2)
R
where xi and yi are the coordinates of the centroids of the single polygons of urbanized areas present
where xi and yi are the coordinates of the centroids of the single polygons of urbanized areas present
in the 1 × 1 km plot; x* and y* are the coordinates of the mean center of the centroids obtained as an
in the 1 × 1 km plot; x* and y* are the coordinates of the mean center of the centroids obtained as an
average calculated through the surfaces of the distances among centroids within the 1 × 1 km plot;
average calculated through the surfaces of the distances among centroids within the 1 × 1 km plot;
and R is the radius of the circular area with dimensions analogous to those of the sum of the
and R is the radius of the circular area with dimensions analogous to those of the sum of the urbanized
urbanized areas present in the 1 × 1 km plot.
areas present in the 1 × 1 km plot.
Figure 9. Sampling of the Sprinkling Index (SPX) and the geostatistics map in the region of Umbria.
Figure 9. Sampling of the Sprinkling Index (SPX) and the geostatistics map in the region of Umbria.
The SPX is an index capable of providing a more immediate and, theoretically, a more effective
The SPX isofanthe
description index capable of
dispersion providing a more
characteristics immediateareas
of urbanized and, compared
theoretically,
to athe
more effective
UDI-DU
description of the
combination. dispersion
However, it ischaracteristics
quite difficultoftourbanized areasintervals,
identify value comparedsuchto the
as UDI-DU combination.
those processed for
However, it is quite difficult to identify value intervals, such as those processed for Umbria and
Umbria and shown on the right in Figure 9, that are valid also for other Italian territorial and regional shown
onscopes.
the right in Figurethe
Currently, 9, that
SPXare valid is
method also for other
being testedItalian territorial
to verify and regional
correspondences scopes.
between Currently,
range and
thedispersive
SPX method typology.
is being tested to verify correspondences between range and dispersive typology.
4. Discussion
4. Discussion
The
The above-mentionedissues
above-mentioned issuesare
arenot
noteasy
easy to
to face, especially
especiallybecause
becausethe
thecurrent
currentsituation derives
situation derives
from
from a aseries
seriesofofdecade-long
decade-long political,
political,technical, administrative
technical, administrativeand and
economic behaviors.
economic These have
behaviors. These
contributed
have contributed to forming
to forminga strongly distorted
a strongly social
distorted town-planning
social town-planning culture thatthat
culture is by now
is by nowalmost
almost
incapable
incapable of of acceptingforms
accepting formsofofmore
moreincisive
incisive planning
planning compared
comparedto tothe
theweak
weakmethods
methods implemented
implementedSustainability 2017, 9, 97 13 of 17
up to now. In light of this consideration, a debate has been launched on the actual possibility of
containing, mitigating, conforming, and/or inverting the growth dynamics of land take. In order to
proceed in this direction it is necessary to be able to record, take a census, calculate, and therefore
control the urban conversion of lands using methods and metrical systems homologated in their
definitions and processes. To date, though, this is still not technically implementable at the highest
administrative levels [37]. The national or regional structures for monitoring urbanized land are
still few and not coordinated, there are no shared protocols, and the available data are approximate.
These problems are themselves ascribable to the forms of land take. Other countries, with more
compact and homogeneous urbanized situations, can efficiently make use of European-managed
remote sensing products such as the Corine Land Cover. However, this is not possible in Italy’s case
as, highlighted above.
Nonetheless, it is important to mention that several efforts are being carried out by institutional
bodies, such as ISTAT and ISPRA (Istituto Superiore per la Protezione e la Ricerca Ambientale), to
overcome at least the obstacle of the “census-taking” of urbanized areas [35,36]. This leads us to
envisage that a standard database of the Italian artificialized surfaces will be available within a couple
of years. As regards the debate on the regulatory framework, which is already animated both at
national and regional levels, more resolute conceptual and methodological commitments are necessary
so as to overcome simple quantitative limitations. Moreover, it is important to aim for an approach
based on “balance” and controls capable of localizing constructions, taking into account obstacles and
inevitable “parasite” effects.
It cannot be disregarded that many people and entities oppose housing densification such
as infilling [38,39] because such changes are seen as causing detrimental impacts at various
levels. Furthermore, possible limitative-aggregative rules would significantly affect current social
town-planning issues, so as to require significant action in line with the European directions aimed at
zeroing the urban conversion of land [40]:
Land and soil, target: within 2020 the EU’s strategies will take into account the direct and
indirect repercussions on the use of land in the EU, while at the global level the aim is for
the percentage of land take to be zeroed by 2050, land erosion reduced and the content
of organic matter increased; at the same time, actions will be undertaken to regenerate
contaminated sites.
Table 3 summarizes a possible recovery and reorganization process of the dispersion model
described. The proposed process will realistically require a very wide timeframe, amounting to a total
of 30 years.
The national local land take models are undoubtedly conditioned by the distribution of mountain
ranges, but also by a weak implementation of plans.
Urban sprawl is not caused by weak planning, as it is generally governed by quite uniformed
rules and parameters (Table 1), and is therefore connectable to precise assessments of housing needs.
Housing assessments could be satisfied through various typologies, but in many countries the
prevailing housing request is aimed towards low density. Very often the realization of residential
areas is carried out by real estate companies that manage the entire chain of development up to the
property’s sale. Once this land take model has been chosen, the aggregative land configurations based
on surfaces between 500 and 800 m2 minimize several negative effects of urban sprawl, such as higher
energy expenditure, the lack of collective utilities and the lengthening of public and private transport
lines. Clearly the most effective answer to these problems lies in residential densification, but this is a
different topic to be faced in another context, as it depends on societies’ housing habits [41].Sustainability 2017, 9, 97 14 of 17
Table 3. Possible steps in the Italian de-sprinkling process.
ACTION TOOLS TIME HORIZON METHODOLOGIES/GOALS PATTERN
Slackening, up to the interruption, of the phenomena of further
land take according to traditional dynamics, so as not to further
burden the current conditions. It is an action reasonably falling
regulatory within the Regions’ strategic responsibilities. In this sense, the
Stopping urban
1 intervention/tax short term laws pertaining to “land consumption”, with which several
sprawl/sprinkling
deduction Regions have already complied, seem to be the main solution
for setting regulatory-fiscal regulations aimed at containing the
behaviours of Municipalities and private subjects as to further
forms of uncontrolled use of territorial surfaces.
Identification and reorganization of “key areas” in which to
carry out localization interventions of infrastructures, services
and polarizing productive functions, with the intent to
reorganize a macro urban fabric with its central areas and its
Prioritised strategic plan/
2 mid term reclassified road system. It is a key step in the de-sprinkling
functional ranking operational plan
process, as it requires an almost paradigmatic reformulation of
the current planning modalities. The aim, in fact, can be
achieved by inverting the plan reduction trajectory, giving it a
more incisive compulsoriness.
Densification intervention of the urban fabric so as to satisfy the
future needs of land take increase, but especially to guarantee
efficient public utilities, optimizing the users’ accessibility and
Densification/ Operational threshold volumes. The key areas host all the functions that in
3 mid term
infilling planning/urban project time become indispensible to guarantee the qualitative and
supply improvement of the territorial ambit (housing, utilities,
industrial, commercial, managerial) systematically using the
tools of equal distribution/compensation of land.
Incentives or managerial interventions negotiated in phase of
equal distribution/compensation (for example, through the
acquisition of public patrimony areas) aimed at the gradual
regulatory intervention/
4 Shrinking long term removal of built/urbanized areas, with local projects of
tax deduction
re-establishment/restoration of the
landscape-environmental-pedological state of the areas and of
the original use of the land, with increasing of urban density.Sustainability 2017, 9, 97 15 of 17
In areas characterized by sprinkling, being in favor of grass-roots initiatives and derogation, even
legal, with reference to planning regulations, is very common; therefore, it is more difficult to manage
land take on the basis of calculated needs. The development of sprinkling over the years has often
been the result of stochastic behavior processes in communities that have their driving force in the
actions of single individuals. Interventions escape any form of control, and are often based on the
self-construction of buildings and on the self-assessment of volumetric and distributive needs, with a
pathological lack of architectural formal references which produce the chaotic outcomes characterizing
the current Italian land take.
Therefore, sprinkling, in both its extended and linear physiognomies (Figure 6), is a
non-compactable conformation, only stoppable or perhaps functionally improvable by planning
several densified urban sections (Table 3) that can be elements of connection for the main utilities,
improving the conditions of “critical mass”. These sections, which require accurate planning, should
also host possible construction expansion deriving from normal incremental needs. All this must occur,
though, within a “planned” fabric which privileges and incentivizes the reoccupation of sections of
previously used territory (infilling).
The latter considerations have only been mentioned in the national debate while analyzing the
actual possibility to invert the land take dynamics manifested in Italy. Moreover, the issue, placed in
these terms, was substantially neglected in the text approved by the Chamber on 12 May 2016 with
reference to “Containment of land take and reuse of urbanized land”. This text shows no differences
among the various fabric and density models, which, instead, require mapping and customized actions.
The procedures to be implemented and the aims to be achieved need to be gradually inserted in a
temporal program envisaging the use of various instruments in sequence, within a line of politically
robust and continuous consistency. It will be necessary to coordinate incentive and fiscal actions with
planning and project actions at various stages and levels, with awareness that the issues are of extreme
difficulty and need sophisticated measures that will, in part, be developed through experimentation
ex novo [42]. Public bodies (municipalities, regions, states) will have to intervene in order to set and
manage the Transfer Development Right (TDR) tools [43]. The latter, in fact, will be indispensable in
order to apply techniques and rules for long-term equalization and compensation. However, consistent
and continuous results over time cannot be obtained if desired participation processes are not activated
among entrepreneurs, social representatives and non-profit associations, groups already sensitized
towards the issue.
On the other hand, Italy is a highly advanced country from the technical and cultural viewpoints,
and is therefore capable of facing this issue, despite the enormous difficulties entailed. Owing to
its methodological experience, Italy could play an important role in transferring tools to countries
which, in the past couple of years, have been following the direction pursued by Italy. For example, as
mentioned, the Balkan area is undergoing analogous processes; therefore, if it immediately applied the
measurement methods suggested in this work, together with containment and regulatory methods
based on proper territorial planning, in a 10-year period it could avoid the serious consequences that
the Italian territory has already experienced.
In light of these observations, and considering current conditions, a systematic implementation
of projects aimed at organizing urban areas and capable of reducing the typological and distributive
spontaneity typical of current expansion structures—that is, the medium-term results to be achieved
as mentioned up to point 3 of Table 3—would undoubtedly be an appreciable result.
Acknowledgments: The methodology presented was implemented in the RERU3 (Umbria Regional Ecological
Network) project (0023769-23.02.2015), and its monitoring was supported by the region of Umbria, which we
thank for the resources provided. The indicators used were developed within the SUNLIFE project (LIFE
13/NAT/IT/371—Strategy for the Natura 2000 Network of the Umbria Region).
Author Contributions: Bernardino Romano, Francesco Zullo and Lorena Fiorini conceived the model and
analyzed the data; Serena Ciabò and Alessandro Marucci processed the data.
Conflicts of Interest: The authors declare no conflict of interest.Sustainability 2017, 9, 97 16 of 17
References
1. European Commission. Urban Sprawl in Europe: The Ignored Challenge. 2006. Available online:
http://www.eea.europa.eu/publications/eea_report_2006_10 (accessed on 4 January 2017).
2. The Worldwatch Institute. State of the World, Our Urban Future. 2007. Available online: http://www.
worldwatch.org/taxonomy/term/467 (accessed on 4 January 2017).
3. Frenkel, A.; Ashkenazi, M. The integrated sprawl index: Measuring the urban landscape in Israel. Ann. Reg.
Sci. 2008, 42, 99–121. [CrossRef]
4. Jaeger, J.A.G.; Bertiller, R.; Schwick, C.; Kienast, F. Suitability criteria for measures of urban sprawl. Ecol. Indic.
2010, 10, 397–406. [CrossRef]
5. Ding, C.; Zhao, X. Assessment of urban spatial-growth patterns in China during rapid urbanization.
Chin. Econ. 2011, 44, 46–71. [CrossRef]
6. Barrington-Leigha, C.; Millard-Ballb, A. A century of sprawl in the United States. Proc. Natl. Acad. Sci. USA
2015, 112, 8244–8249. [CrossRef] [PubMed]
7. Zhang, Z.; Tu, Y.; Li, X. Quantifying the Spatiotemporal Patterns of Urbanization along Urban-Rural Gradient
with a Roadscape Transect Approach: A Case Study in Shanghai, China. Sustainability 2016, 8, 862. [CrossRef]
8. Lin, J.; Cai, J.; Han, F.; Han, Y.; Liu, J. Underperformance of Planning for Peri-Urban Rural Sustainable
Development: The Case of Mentougou District in Beijing. Sustainability 2016, 8, 858. [CrossRef]
9. Jiang, L.; Zhang, Y. Modeling Urban Expansion and Agricultural Land Conversion in Henan Province, China:
An Integration of Land Use and Socioeconomic Data. Sustainability 2016, 8, 920. [CrossRef]
10. Chen, D.; Wang, Y.; Ren, F.; Du, Q. Spatio-Temporal Differentiation of Urban-Rural Equalized Development
at the County Level in Chengdu. Sustainability 2016, 8, 422. [CrossRef]
11. Li, D.; Wang, D.; Li, H.; Zhang, S.; Zhang, X.; Tao, Y. The Effects of Urban Sprawl on the Spatial Evolution of
Rural Settlements: A Case Study in Changchun, China. Sustainability 2016, 8, 736. [CrossRef]
12. Romano, B.; Zullo, F. Half a century of urbanisation in Southern European lowlands a study on the Po Valley
(Northern Italy). J. Urban Res. Pract. 2015, 9, 109–130. [CrossRef]
13. Romano, B.; Zullo, F.; Tamburini, G.; Fiorini, L.; Fiordigigli, V. Il riassetto del suolo urbano italiano: Questione
di “sprinkling”? Territorio 2015, 74, 146–153.
14. Safirova, E.; Houde, S.; Harrington, W. Spatial Development and Energy Consumption. 2007. Available
online: http://www.rff.org/files/sharepoint/WorkImages/Download/RFF-DP-07-51.pdf (accessed on
4 January 2017).
15. Peiser, R.B. Density and Urban Sprawl. Land Econ. 1989, 65, 193–204. [CrossRef]
16. Andren, H. Effects of habitat fragmentation on birds and mammals in landscapes with different proportions
of suitable habitat: A review. Oikos 1994, 71, 355–366. [CrossRef]
17. Fahrig, L. Effects of Habitat Fragmentation on Biodiversity. Ann. Rev. Ecol. Evol. Syst. 2003, 34, 487–515.
[CrossRef]
18. Ewing, R.H. Characteristics, Causes, and Effects of Sprawl: A Literature Review. In Urban Ecology;
Marzluff, J.M., Shulenberger, E., Endlicher, W., Alberti, M., Bradley, G., Ryan, C., Simon, U., ZumBrunnen, C.,
Eds.; Springer: New York, NY, USA, 2008; pp. 519–535.
19. Bullard, R.D.; Johnson, G.S.; Torres, A.O. (Eds.) Sprawl City: Race, Politics, and Planning in Atlanta; ISBN:
1559637900. Island Press: Washington, DC, USA, 2000; p. 240.
20. Deng, F.F.; Huang, Y. Uneven land reform and urban sprawl in China: the case of Beijing. Prog. Plan. 2004,
61, 211–236. [CrossRef]
21. Kew, B.; Lee, B.D. Measuring Sprawl across the Urban Rural Continuum Using an Amalgamated Sprawl
Index. Sustainability 2013, 5, 1806–1828. [CrossRef]
22. Schneider, A.; Mertes, C.M. Expansion and growth in Chinese cities, 1978–2010. Environ. Res. Lett. 2014, 9.
[CrossRef]
23. Sargolini, M. Adriatic urban sprawl and environmental continuity. In Agricultural Management in Peri-Urban
Areas; Lardon, S., Marraccini, E., Bonari, E., Eds.; Felici Editore srl: Pisa, Italy, 2010; pp. 86–93.
24. Romano, B.; Zullo, F. The urban transformation of Italy’s Adriatic coastal strip: Fifty years of unsustainability.
J. Land Use Policy 2014, 38, 26–36. [CrossRef]
25. Cabiddu, M.A. (Ed.) Diritto del Governo del Territorio; Giappichelli: Torino, Italy, 2014; p. 494.You can also read