Research on Used Car Transaction Cycle Based on Soft Voting
←
→
Page content transcription
If your browser does not render page correctly, please read the page content below
Information Systems and Economics (2022) DOI: 10.23977/infse.2022.030103
Clausius Scientific Press, Canada ISSN 2523-6407 Vol. 3 Num. 1

 Research on Used Car Transaction Cycle Based on Soft
 Voting
 Siyu Zhao1, Kangan Qian2, Chengge Wen3
1
School of Resources and Safety Engineering, Central South University, Hunan, Changsha, 410083,
 China
 2
 College of Mechanical and Electrical Engineering, Central South University, Hunan, Changsha,
 410083, China
 3
 Bussiness School of Central South University, Hunan Changsha, 410083, China

 Keywords: used car, Soft Voting, transaction cycle.

 Abstract: In this paper, the key factors affecting the vehicle transaction cycle are mined, and
 the soft voting integrated learning algorithm model is established to solve it. Logistic
 regression, AdaBoost, gbdt, SVM and random forest are considered as base classifiers.
 Firstly, 24 candidate indexes are determined as candidate key factors affecting vehicle
 transaction cycle Then, data fitting and parameter adjustment are carried out for the five base
 classifiers, and the better parameters are selected to obtain the performance of the five base
 classifiers on the data set. The weight of each base classifier is judged by the comprehensive
 accuracy of the classifier on the overall data. Finally, through the descriptive statistical
 analysis of the candidate index data through the soft voting model, the indicators with an
 impact index of more than 90% on the vehicle transaction cycle are extracted as the result,
 which are the price adjustment time: adjusted price, exhibition time, model id, city id of the
 vehicle, transfer times, country, fuel type, new car price. Based on this, the effective means
 to speed up sales are put forward.

1. Introduction

 Used car sales are generally publicized through network channels. Used car stores sell used cars.
Online marketing and offline sales jointly form a used car market model to realize online and offline
data exchange and joint operation. The transaction cycle of used car sales is a key factor affecting the
profitability of stores. The shorter the transaction cycle, the higher the profitability, because the longer
the time [1]. The higher the depreciation of second-hand cars, the higher the maintenance costs.
Analyzing the transaction data of second-hand car stores, mining the key factors affecting the
transaction cycle of second-hand cars, and taking further measures are conducive to the development
of second-hand car market. Therefore, finding out the factors affecting the transaction cycle of
second-hand cars is also one of the key points of second-hand car market.

 10
2. The Soft Voting model 2.1 Extract candidate indicators By consulting the data and analyzing the data fields, we finally determined the following candidate indicators as the candidate key factors affecting the vehicle transaction cycle, as shown in the table. Table 1: Key factors of transaction cycle. Num Features Num Features 1 pushDate 13 transferCount 2 pushPrice 14 seatings 3 updatePriceTimeJson 15 registerDate 4 pullDate 16 licenseDate 5 withdrawDate 17 country 6 tradeTime 18 maketype 7 brand 19 modelyear 8 serial 20 displacement 9 model 21 gearbox 10 mileage 22 oiltype 11 color 23 newprice 12 cityId 24 anonymousFeature 2.2 Data preprocessing Filter the data records according to the vehicle ID, filter out the vehicle information related to the vehicle ID, and retain the involved index data. Then, compare the "off shelf time" and "transaction time" fields of all data records, and eliminate the data records with different fields (i.e. information of unsettled vehicles). Finally, preprocess the filtered data, including: abnormal value processing and missing value processing. 2.3 Establishment and solution of model 2.3.1 Establishment of voting model Voting is one of the integrated learning algorithms widely used in classification algorithms. Voting mainly includes hard voting and soft voting. Hard voting is a special soft voting, that is, the voting with the same weight of each base classifier. Its principle is the majority voting principle: if more than half of the classification results of the base classifier, Then the integration algorithm selects the result; If there is no half result, there is no output. The principle of soft voting is also majority voting, but the weight of each base classifier can be defined by itself. When the classification effect of each base classifier is quite different, soft voting should be selected to give the base classifier with better classification performance greater weight, so as to optimize the classification results. The five base classifiers selected in this paper are Logistic regression, Adaboost, GBDT, SVM and random forest. (1) Logistic regression model 1 The core of Logistic regression model is logit function, that is, ( ) = 1+ − The corresponding parameters are solved by maximum likelihood estimation, and the classification problem is transformed into a probability problem and mapped to the (0,1) interval. In the traditional factor mining, the accuracy of logistic regression can reach 54% 92%. 11
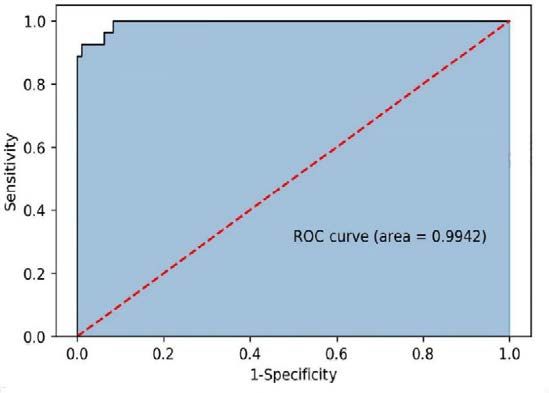
(2) Adaboost, gbdt and random forest
 Adaboost, GBDT and random forest are classifiers based on boosting algorithm. The classification
results are ideal, and the model has strong generalization ability. Adaboost first assigns the same
weight to nn training samples, so as to train a base classifier, and then carries out preset T iterations.
Each iteration increases the weight of the wrong samples in the previous classifier, make more
attention to these samples in the next iteration, so as to adjust the weight and improve the classifier.
After T iterations, T base classifiers are obtained, and finally these base classifiers are linearly
combined to obtain the final classifier model. Gbdt classification [2] first initializes a weak classifier,
calculates the negative gradient value of the loss function, and then uses the data set to fit the next
round of model, The negative gradient value and fitting process are calculated repeatedly, and the
gradient lifting tree is constructed by using m basic models. Random forest [3] selects a large number
of decision tree models, and each decision tree makes learning and classification independently.
Finally, the classification is combined into a final result, which is better than the classification result
made by a single decision tree
 (3) SVM
 SVM is a powerful traditional machine learning algorithm. It transforms low-dimensional linearly
separable space into high-dimensional linearly separable space. This paper mainly applies the
nonlinear SVM model, and its objective function is:

 s.t. � = 0
 =1
 (1)
 1
 � � � �∮( )∮� �� − � �
 2
 =1 =1 =1

 By replacing the inner product ∮( ), ∮� � with kernel function and calculating the
optimal a i , the values of w and b of the hyperplane can be obtained.
2.3.2 Solution of voting model
 Firstly, data fitting and parameter adjustment are carried out for the five base classifiers, and the
better parameters are selected to obtain the performance of the five base classifiers on the data set, as
shown in the table below. It can be seen that the closest effect between the training set and the test set
is Adaboost, and the other classifiers have over fitting phenomenon with different degrees. On the
whole, Logistic regression is obviously inferior, and the results of the last three classifiers are
relatively close, mainly because the three classifiers have good performance in the training set, and
the training set data accounts for 70% of the overall data.

 Table 2: Classification effect of base classifier.

 Classifier Test set accuracy Training set accuracy Comprehensive accuracy AUC
 Logistic regression 0.839 0.902 0.886 0.754
 Adaboost 0.903 0.913 0.911 0.822
 GBDT 0.806 1 0.951 0.942
 SVM 0.871 0.978 0.951 0.889
 random forest 0.871 1 0.967 0.953

 However, judging the result of the classification model only from the perspective of accuracy is
biased, and the purpose of this paper is to add AUC value for reference. AUC value is the area covered
by ROC curve, and its meaning can comprehensively consider various indicators of recall rate,

 12
precision and accuracy. Generally, the classification model with AUC value above 0.8 is acceptable,
from this point of view, Logistic regression does not meet the requirements
 Because the classification effect of each base classifier is different, this paper selects soft voting
to judge the weight of each base classifier according to the comprehensive accuracy of the classifier
in the overall data. The formula is as follows:
 Accuracy
 = (2)
 ∑5 =1 Accuracy
 The classification results of soft voting are shown in the table below:

 Table 3: Soft voting classification effect.

 Classifier Test set accuracy Training set accuracy Comprehensive accuracy AUC
 Soft Voting 0.903 1 0.976 0.994

 It can be seen that the performance of soft voting in classification is very perfect, very close to the
perfect classifier, indicating that the ensemble learning algorithm has excellent performance on this
data set.

 Figure 1: ROC curve of Soft Voting.

 Through the descriptive statistical analysis of each candidate index data extracted in table 1
through the voting model, select from front to back according to the size of the impact factors, and
extract the indicators with an impact index of more than 90% on the vehicle transaction cycle. The
results are shown in the following table. The learning curve during model training is shown in the
figure below.
 Table 4: Key factor extraction results.

 Num Features Num Features
 3 updatePriceTimeJson 13 transferCount
 6 tradeTime 17 country
 9 model 22 oiltype
 12 cityId 23 newprice

 13
Figure 2: Training and learning curve of Soft Voting. 3. Analysis of model results In order to speed up the sales of vehicles in stores, we put forward the following eight suggestions: First, market analysis. We need to do market segmentation analysis of second-hand cars, as well as analysis of popular models, peer inventory and several research. Today, this car is a popular car, because every second-hand car enterprise nearby puts a lot of such cars, and this model will soon be difficult to sell. There is also price prediction. There is generally a phenomenon in mature markets, Before the golden week and National Day holidays in April and September, it will be the peak season for new cars and used cars. The market will fluctuate and the price will fall. Second, target management. Target setting basis, target division of labor, target difference analysis, sales target is easy to manage, intermediate improvement methods, sales should set targets and use index management. Fourth, pricing strategy. In the future, the price of used cars will be transparent. You should know the price of the same industry, pay attention to the equipment, as well as the year analysis, competition analysis, and how to determine the price of competitors within one or two kilometers nearby. Price prediction and bargaining strategy. Fifth, the feeling of promotion. Second hand car promotion features, according to the time and place of the car, promotion theme setting, low-cost publicity methods, promotion layout and effective control of promotional vehicles. Sixth, customer management. Need to do used car flow analysis, graded card building, customer screening, strategy activation, VIP. Management, customer relationship management, success or failure is complex. Seventh, inventory. Flow analysis, depreciation analysis, purchase management, freshness management, color management, composition adjustment methods. Eighth, numerical management. Cost composition, index management, discount control, customer satisfaction, profit analysis, turnover improvement, profit analysis is very important. References [1] Dongfang fortune com.2021 Analysis on the development prospect of China's second-hand car testing market in [EB/OL]. baijiahao. baidu. com/s? id=1707777601753410628& wfr=spider& for=pc, 2021811. [2] Meng ye, Yu Zhongqing, Zhou Qiang. Stock index prediction method based on Ensemble Learning[J]. modern 14
electronic technology, 2019,42 (19): 115 118. DOI: 10.16652/j.issn. one thousand and four 373x. 2019.19.027. [3] Wang Jinzhu, Wang Xiang. Learn Python data analysis and mining from scratch[M]. Beijing: Tsinghua University Press, 2018. 15
You can also read