Renewal 2022/23 Commentary - Aon
←
→
Page content transcription
If your browser does not render page correctly, please read the page content below
PROTECTION
& INDEMNITY
Renewal 2022/23 Commentar y

                              P R O T E C T I O N & I N D E M N I T Y: R E N E W A L 2 0 2 2 / 2 3 CO M M E N TA R Y | 2
CONTENTS
Click on a section below.

Introduction                5   P&I Club Finances        General Increase History     15
Renewal: 2022/23            3   American Club       9    Supplementary Call History   16
Reinsurance                 4   Britannia           9    Release Calls                16
Clubs’ Performance          6   Gard                10   Fixed Market Review          17
                                Japan               10   Contacts                     18
                                London              11
                                North               11
                                Shipowners          12
                                Skuld               12
                                Standard            13
                                Steamship           13
                                Swedish Club        14
                                UK Club             14
                                West                15
                                                                                           P R O T E C T I O N & I N D E M N I T Y: R E N E W A L 2 0 2 2 / 2 3 CO M M E N TA R Y | 2
INTRODUCTION
We have little doubt this renewal will      We are told these pool contributions are
follow the same pattern as previous         a significant factor in seeking premium
ones, with clubs citing spiralling losses   hikes. We know from clubs’ detailed
coupled with depressed premiums as          modelling that they can forecast routine
justifications for their firm stance.       claims with good accuracy. Costly
                                            and less frequent high-profile losses
The consistent trend today is fewer         are more difficult to predict. Could
but heavier claims. The routine ones        we be optimistic and say we may see
will, of course, erode premium, but         a sequence of benign years? Sadly
from what we see, larger high-profile       this is likely to be wishful thinking as
losses are causing imbalance. Those         collisions and wreck removal incidents
that hit the pool ($100 million, in         consistently produce heavy losses.
excess of $10 million) are biting.

Pool claims have a legacy of some 10
years, and whilst not every club has
suffered losses at the pool level, none
will escape contributing. Those clubs
that have posted heavy losses will have
to dig deeper into their pockets.

“Our hope is clubs put long-term
plans in place where possible rather
than a heavy hike in premiums.”

                                                                                       P R O T E C T I O N & I N D E M N I T Y: R E N E W A L 2 0 2 2 / 2 3 CO M M E N TA R Y | 5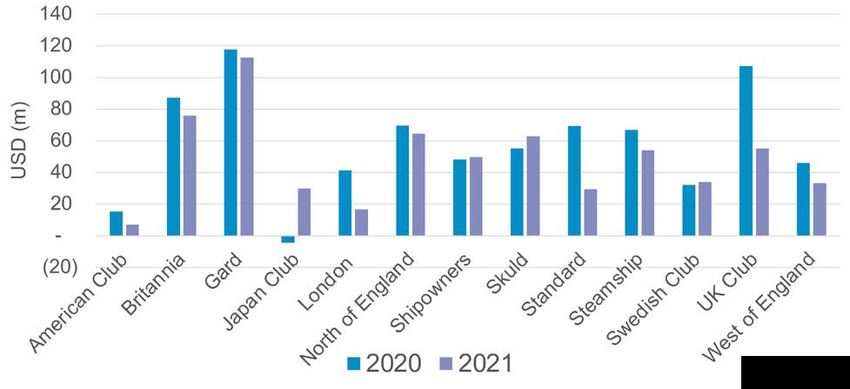
RENEWAL: 2022/23
So can the clubs use their riches to ride this storm?    The present returns on investments show a           Poor will be ever-present. There is no logic in       straightforward renewal. Leaving aside premiums, we
Whilst there is a growing financial divide between       staggering $1.3 billion over the past two policy    giving any false impression, and sadly we feel        have to consider the common cyber and pandemic
the clubs, clearly there are a number that continue to   years, against the current pool claim reserves      each and every club will be applying increases.       exclusions and what that may mean for the group.
see free reserves increase. Whilst returns of premiums   at $750-800 million for the same period.
have been well received, in truth, we believe owners                                                         Our hope is clubs put long-term plans in place        As we continue to maintain, The International
would prefer to see premiums remain stable.              In saying this, we know some lesser performing      where possible rather than a heavy hike in            Group is unparalleled in its scope of cover and
                                                         clubs will not be able to rely on the same          premiums. Once again, we have to raise the            service, but there are some challenges ahead. We
We fully appreciate that underwriting on the             reserves. However, we must raise the point          issue of underwriting discipline when new             see fewer but bigger owners as acquisitions and
expectation that the investment returns will             that many clubs are a victim of their own           tonnage is on offer. Surely existing members          mergers take place. Will that eventually lead to
balance the books is not sound judgment, yet we          success with flourishing reserves.                  should reap the benefit of their support?             some consolidation in the group? Yes we believe
have to ask why some clubs keep reserves at the                                                                                                                    it will, maybe not immediately, but it’s clearly on
level they are? If these funds are not returned,         The current indications are that most clubs will    The group reinsurance programme ends its two-         the radar. Whilst shipping is generally regarded
then they are an integral part of underwriting           again post combined loss ratios well above          year cycle shortly. It is no secret the commercial    as one of the cleanest methods of transportation,
performance and ought to be treated as such.             breakeven. The previous ‘lifeline’ of investments   insurance market has seen significant increases       the climate footprint will be a factor.
                                                         help, but not to the degree of previous years.      across all classes for the past few years. The
                                                         We know only too well the eyes of Standard and      high-profile losses we referred to earlier will not
                                                                                                             have gone unnoticed. It is too early to say what
                                                                                                             may transpire, but indications are it will not be a

                                                                                                                                                                           P R O T E C T I O N & I N D E M N I T Y: R E N E W A L 2 0 2 2 / 2 3 CO M M E N TA R Y | 3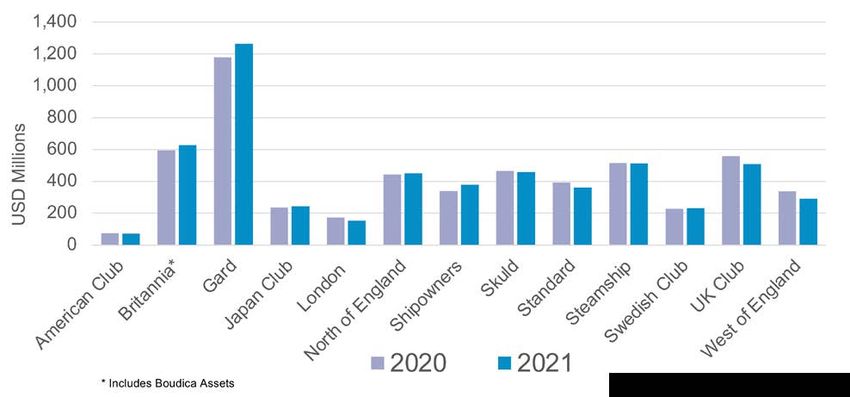
REINSURANCE
Pooling                                                                                                                 The major claims of the 2020 policy year were             “We predicted that the
In last year’s review, we stated that an increase to           The P&I clubs will tell you this trend is                the wreck removals of WAKASHIO and STELLAR
the P&I clubs’ $10 million retention was unlikely              caused by the increasing cost of major                   BANNER, each approaching $100 million in value            2020 policy year would
in the short term. This proved correct at the                  claims - due to varying factors, including:              at the time of writing. There were also a number
20 February 2021 renewal, and we anticipate                                                                             of other claims around the $50 million mark,              be the worst year for the
no change to the individual club retention
at the 20 February 2022 renewal. However,
                                                               •	governments and authorities punitively                including container ship incidents ONE APUS and
                                                                                                                        MILANO BRIDGE and VLCC fire NEW ASSURANCE.
                                                                                                                                                                                  International Group pool in a
                                                                  penalising shipowners for incidents;
as we will explain, the International Group                                                                             It is interesting to note that in an extremely            decade, which has proven to
pooling system and reinsurance placement are                                                                            bad year like 2020, no claim has yet breached
under pressure, and we could see some other                    •	technological advancement permitting                  the $100 million reinsurance inception level              be the case.”
fundamental changes at the coming renewal.                        increasingly expensive wreck removals; and            (notwithstanding that there is also a $100 million
                                                                                                                        AAD see full reinsurance structure of on page 5).         International Group Excess of Loss Reinsurance
We predicted that the 2020 policy year would                   •	a worrying trend of governments trying to break                                                                 It has been well documented that the International
be the worst year for the International Group                     limitation to which their country has signed.         The 2021 policy year has, unfortunately, started          Group reinsurance contract was placed on a two
pool in a decade, which has proven to be the                                                                            extremely badly. It is hard to say at this stage if       year deal at 20 February 2020, and therefore there
case. The below triangulation shows that, after                Almost all of the incidents are caused by human          it will be worse than 2020, but we can certainly          was no renewal at 20 February 2021. In hindsight
12 months, losses are already at $462.9 million.               error, so the focus will also be on the performance      say that the largest claims are much higher in            this looks like a masterstroke by the International
Bearing in mind that for the 2018 and 2019                     of crew and pilots, no doubt exacerbated by              value. EVER GIVEN will certainly comfortably              Group and their brokers as a negotiation in the
policy year, deterioration from the 12-month                   the pandemic and appalling way seafarers                 exceed $100 million, as will the claim for X-PRESS        middle of a hardening market and a deteriorating
point to 24-month point was over $100 million,                 have been treated in most jurisdictions.                 PEARL. We understand the claim for A SYMPHONY             loss ratio after the GOLDEN RAY claim was missed.
it is clear to see that 2020 will be remembered                                                                         is also approaching $100 million. There have              There were still some increases in the cost of the
as an extremely bad year. What is perhaps more                 Looking at the figures below, it is hard to argue with   also been a number of other major incidents               International Group reinsurance for members as
concerning than the poor performance of the                    the P&I clubs’ conclusion regarding the trend of         that will impact either the International Group           the overspill layer had to be renewed and the
2020 policy year in isolation is that the 2018,                the number of major incidents not increasing, while      pool or the individual reinsurance programmes             contribution of Hydra evaluated. However, the
2019 and 2020 policy years are all worse than any              the value of those incidents jumps significantly.        of P&I clubs when the incident involves                   larger increases from the main International Group
other year on the triangulation chart below.                                                                            charterers liability or fixed premium P&I.                contract renewal were avoided for one year.

International Group Pool Incurred Claims Based Upon Historical Thresholds ($ Millions)                                  Pool costs make up a major part of a member’s loss        Unfortunately 12 months later, the insurance
                                                                                                                        record, with all clubs except the Shipowners Club         market has not improved, and the GOLDEN RAY
 Months        2012/13     2013/14    2014/15    2015/16       2016/17     2017/18    2018/19    2019/20     2020/21    showing them in the record in one form or another.        claim has continued to deteriorate. The media
                                                                                                                        It is, therefore, key for members to understand how       tell us it is now in the region of $850 million,
 12 Months         368.6      279.8      179.6         198.4        84.0      227.2      306.1      259.2      462.9    much of their premium is allocated to the pool and        making it the second biggest P&I claim of all time
 24 Months         453.9      327.0      193.6         276.6       125.9      269.6      455.8      441.7               the percentage of the pool their club(s) is liable        after COSTA CONCORDIA. In addition, it looks
                                                                                                                        for. As the market hardens, we believe a greater          likely that at the time of writing in (September
 36 Months         467.0      364.0      204.5         284.0       145.0      289.7      490.0                          understanding of how the clubs work and allocate          2021), two claims above $100 million will affect
 48 Months         465.1      364.9      215.8         282.7       136.5      310.5                                     costs is paramount to ensuring clients achieve a fair     the reinsurance contract in the 2021 policy year.
                                                                                                                        deal. Aon’s dedicated P&I team spends a great deal        As we mention above, these claims are the very
 60 Months         446.3      411.6      221.3         291.4       140.2                                                of time and resource analysing the P&I market and         well publicised EVER GIVEN incident and the
                                                                                                                        are here to ensure our clients have a fully transparent   X-PRESS PEARL, both container ships. We are
 72 Months         418.6      408.6      212.9         295.5
                                                                                                                        view of their club(s) and the market as a whole.          only halfway through the P&I year, so there is
 84 Months         403.6      423.1      206.5                                                                                                                                    plenty of time for further incidents, particularly
                                                                                                                                                                                  in the North Atlantic Winter, which is generally
 96 Months         392.7      430.6
                                                                                                                                                                                  viewed as the worst time for major P&I claims.
 108 Months       383.4

                                                                                                                                                                                          P R O T E C T I O N & I N D E M N I T Y: R E N E W A L 2 0 2 2 / 2 3 CO M M E N TA R Y | 4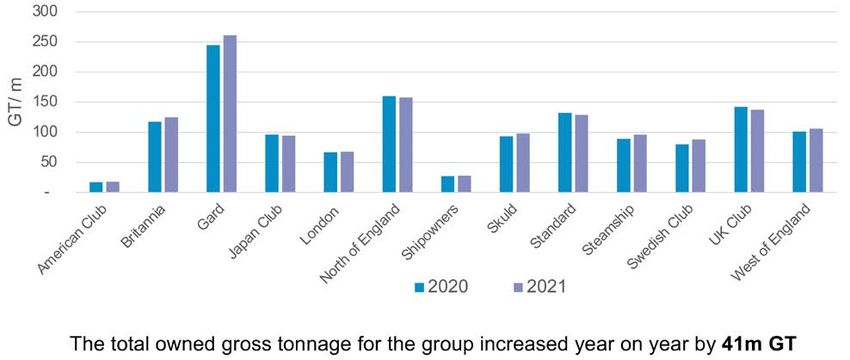
REINSUR ANCE

                                                                                                                                                           “It is certainly possible that the
                                                                                                                                                           structure of the International Group
                                                                                                                                                           reinsurance placement will be
                                                                                                                                                           amended, possibly significantly.”

Unfortunately, all of the above means we are in for        International Group Reinsurance Structure            International Group XSRI rates
a very difficult renewal of the International Group
reinsurance contract at 20 February 2022. We
                                                                                                                                                         Tanker
anticipate a reasonably significant increase in the cost                                                               $/GT         Tanker (Dirty)                  Dry                  FCC                     Passenger
                                                                                                                                                         (Clean)
of the reinsurance placement as a whole, which the
International Reinsurance sub-committee will then                                                                      2020             0.5747           0.2582             0.3971                                  3.2161
allocate across the various vessel types on a per GT                                                                   2021             0.5625           0.2619    0.4028              0.4249                       3.2624
basis as they usually do. We would expect to see an
increase in the cost of the reinsurance for all vessel                                                            Change in rate         -2.1%           +1.4%     +1.4%                +7%                          +1.4%
types, but some, such as container vessels, will be
asked to bear a heavier burden than those with a
better loss ratio, such as clean and dirty tankers.

                                                                                                                International Group XSRI Rates History
A separate category was introduced for container
vessels at 20 February 2021, so they are already
paying more per GT than other dry cargo vessels.
Further punitive increases will be a disappointment,
but a measure that the International Group may feel
is reasonable following recent major incidents.

For cruise and ferry operators, the reinsurance
rates remain extremely high, despite the passenger
sector not bringing a claim to the international
group reinsurers in nearly a decade. It should
also be noted that no return was given by the              It is certainly possible that the structure of the
IG reinsurers during the 18 month pandemic/                International Group reinsurance placement
global shut down, a time where most cruise and             will be amended, possibly significantly, as the
passenger vessels were laid up with significantly          International Group look to keep increases to a
reduced exposure above the Pool. Therefore, whilst         minimum. Any restructuring of the placement
it seems unlikely any sector will be able to avoid         would likely mean Hydra retaining more risk, which
some level of increase, we would expect those              would come with its own costs. Unfortunately,
in the passenger sector to receive recognition             whatever structure is decided, increased costs
of almost a decade of clean performance.                   for the 2022 policy year look unavoidable.

                                                                                                                                                                            P R O T E C T I O N & I N D E M N I T Y: R E N E W A L 2 0 2 2 / 2 3 CO M M E N TA R Y | 5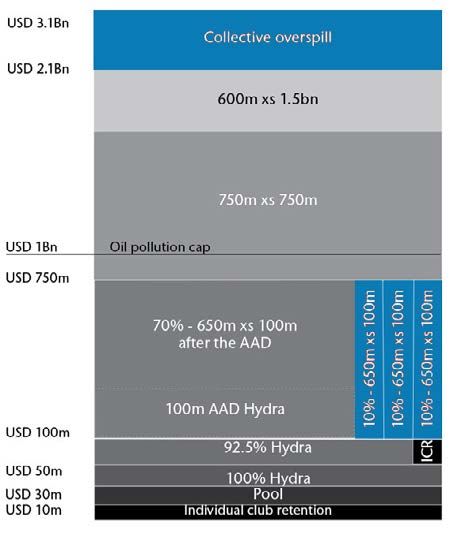
CLUBS’ PERFORMANCE
             Combined Net Ratio         Investments ($’m)                      Free Reserves ($’m)                  Gross Tonnage (GT’m)

KPI / Club

              ‘20          ‘21    ‘20                   ‘21           ‘20             ‘21             ▲      ‘20            ‘21             ▲

American     102%         112%    15             7            5.4%    75.8            72.0           ▼8.2%   17              18            ▲5%

Britannia    132%         120%    87             76           7.2%   594.4            626.9          ▲5%     118            125            ▲7%

Gard         114%         102%    118           113           5%     1,179.2         1,262.9         ▲7%     245            261            ▲7%

Japan        108%         112%    (4)            30           4.7%   235.9            243.0          ▲3%     96             95             ▼2%

London       137%         137%    41             17           5.3%   173.9            153.6          ▼12%    67             68             ▲2%

North        125%         114%    70             65           6.7%   443.8           450.3           ▲1%     160            158            ▼1%

Shipowners   105%         104%    48             50           8%     340.0            379.1          ▲12%    27.1           27.8           ▲3%

Skuld        110%         109%    55             63           9.8%   466.0            459.0          ▲2%     93             98             ▲5%

Standard     143%         127%    69             29           4.7%   393.0           360.3           ▼8%     132            129            ▼2%

Steamship    99.8%        125%    67             54           4.8%   515.3            511.1          ▼1%     89             96             ▲8%

Swedish      107%         120%    32             34            %     228.4            231.4          ▲1%     80             88             ▲10%

UK           121%         151%    107            55           5.6%   559.2            507.4          ▼9%     142            137            ▼3%

West         107%         140%    46             35           4.6%   338.1            291.1          ▼14%    101            106            ▲5%

                                                                                                                                                  P R O T E C T I O N & I N D E M N I T Y: R E N E W A L 2 0 2 2 / 2 3 CO M M E N TA R Y | 6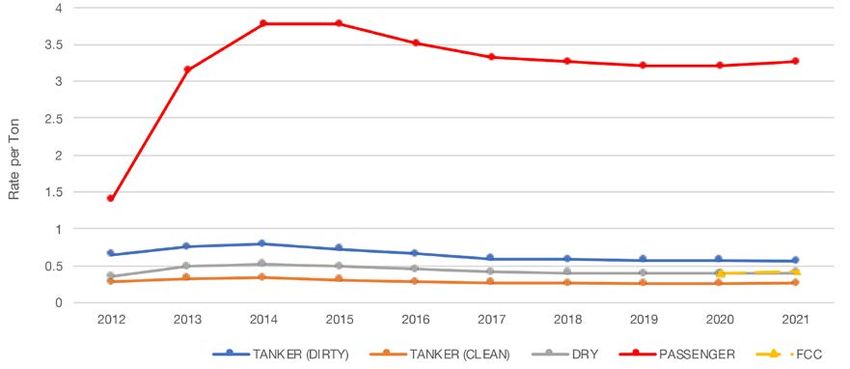
FREE RESERVES        INVESTMENT RETURNS

COMBINED NET RATIO   UNDERWRITING RESULTS
                     VS INVESTMENT RETURNS

                                             P R O T E C T I O N & I N D E M N I T Y: R E N E W A L 2 0 2 2 / 2 3 CO M M E N TA R Y | 7
OWNED GROSS TONNAGE
“The 2021 policy year has,
unfortunately, started
extremely badly. It is hard to say
at this stage if it will be worse
than 2020, but we can certainly
say that the largest claims are
much higher in value.”
P R O T E C T I O N & I N D E M N I T Y: R E N E W A L 2 0 2 2 / 2 3 CO M M E N TA R Y | 8AMERICAN
American BRITANNIA
Britannia
S&P Rating: BBB- (Stable) S&P Rating: A (Stable)
Combined Net Ratio 112% Investment Return 5.4% Entered Tonnage 21 GT Combined Net Ratio 120% Investment Return 7.2% Entered Tonnage 179m GT
Underwriting Result -USD 11m Overall Result -USD 4m Free Reserves USD 72m Underwriting Result -USD 32m Overall Result USD 36m Free Reserves USD 627
"The uniquely difficult conditions which have prevailed since the beginning of 2020 have challenged all marine
The last 12 months have been a challenge for us all. Despite long periods of remote working, our continued
insurers. But the American Club, EOM and American Hellenic Hull have worked hard to maintain undiminished focus has been to provide first class service and financial stability to our Members. We continued our strategy
customer service over the period, and have seen growth in their respective portfolios since the pandemic of returning surplus capital to our Members via another capital distribution in October 2020. We look forward to
began. The emergence of the global economy from COVID-19 will be positive for both shipping and insurance, a happier year for the industry in 2022. Mike Hall, Deputy CEO & Chief Underwriting Officer
not least for the seafarers who support both industries and have endured so much in recent times."
-Joseph Hughes, CEO & Chairman of the Managers 2020 2021
Financials (USD) Vessel Type 2020 2021
(m) (m) Financials (USD)
(m) (m)
Vessel Type
Gross Premium 141 113 Bulk Carrier/ OBO 35.0% Gross Premium 201 200
Bulk Carriers 43% Reinsurance Premium (28) (23)
Containers 26.0% Reinsurance Premium (33) (39)
Tankers (Crude) 18.0%
Tankers 38% Net Premium 113 91 Net Premium 168 161
Tankers (other) 15.0%
General Cargo/ Container/ Claims (71) (59) General Cargo 5.0% Claims (190) (161)
Passenger & RoRo 17%
Operating Expenses (44) (44)
Others 1.0% Operating Expenses (32) (33)
Tugs/ Barges/ Small Craft 2%
Total Expenditure (115) (102) Total Expenditure (222) (193)
Tonnage Management Domicile Underwriting Result (2) (11) Tonnage Trading Area Underwriting Result (54) (32)
Investments 15 7 Asia 46.80% Investments 87 76
EMEA 62%
Rest of Europe 33.40%
Greater China/ N. Tax (0.0) (0.0) Tax (2) (2)
17%
Asia Scandinavia 13.70%
Overall Result 13 (4) Americas 3.60% Overall Result 32 37
Americas 13%
Middle east 2.2%
South & S.E Asia 8%
Australasia 0.30%
CNR 106% 112% CNR 132% 120%
US$ 2015 2016 2017 2018 2019 2020 2020 US$ 2015 2016 2017 2018 2019 2020 2021
• Free Reserves (m) 56 51 58 45 54 76 72 • Free Reserves (m) 546 513 601 642 588 594 627
• Entered Tonnage (m) 18 16 17 19 21 19 21 • Entered Tonnage (m) 136 141 116 127 131 163 179
80 25 700 200
70 180
600
20 160
60
Gross Tonns (m)
US$ (m)
Gross Tonns (m)
US$ (m)
500 140
50 15 120
400
40 100
10 300 80
30
200 60
20
5 40
10 100
20
0 0 - 0
2015 2016 2017 2018 2019 2020* 2021 2015 2016 2017 2018 2019 2020 2021
*The American club changed their accounting policies in 2021, increasing their free reserve allocation
P&I ANNUAL REVIEW 2021 1 P&I ANNUAL REVIEW 2020 1
P R O T E C T I O N & I N D E M N I T Y: R E N E W A L 2 0 2 2 / 2 3 CO M M E N TA R Y | 9GARD
Gard JAPAN
Japan
S&P Rating: A+ (Negative) S&P Rating: BBB+ (Positive)
Combined Net Ratio 102% Investment Return 5% Entered Tonnage 356m GT Combined Net Ratio 111.9% Investment Return 4.72% Entered Tonnage 97m GT
Underwriting Result -USD 11m Overall Result USD 86m Free Reserves USD 1,263m Underwriting Result -USD12m Overall Result USD 9m Free Reserves USD 244m
Through the recent period with additional challenges due to Covid, our aim has always been to support our members with “Looking back on the business year 2020, it was a year at the mercy of the pandemic. The pandemic is not over yet, and I
superior service and a strong financial backing. Without complacency and acting in a way that is fair and represents our hope COVID vaccines will return life to normal soon. The net surplus after tax was JPY2.69 billion. The reserve was
mutual philosophy, we help our Members manage risk and its consequences every day. Gard has, along with the other IG JPY26.98 billion after JPY1.3 billion was added. The Club continued to maintain a credit rating of “BBB+ (Outlook:
clubs, experienced the economic consequences of the volatility of the claims shared, however, our board decided to Positive)” from S&P Global Ratings. In order to provide stable insurance services to our Members, we will endeavour to
support our members by returning excess capital through an Owners General Discount for the 2021 policy in line with improve our capital further and acquire an A rating, and will do our utmost to stay the Club of Members’ first choice.”
earlier reductions in the last instalment Bjørnar Andresen, Group CUO A Japan Club Spokesperson
2020 2021 Vessel Type 2020 2021
Vessel Type Financials (USD) Financials (USD)
(m) (m)
(m) (m)
Tanker 30% Gross Premium 755 887
Bulk Carriers 52.7% Gross Premium 183 179
Bulk 29% Container Ships 14.8%
Container Reinsurance Premium (173) (186) Reinsurance Premium (46) (44)
17% Tankers 14.2%
Gas carriers 7%
Net Premium 583 704
Car Carriers 8.1% Net Premium 137 135
Dry cargo 6%
LPG, LNG, Tankers 6.4%
MOU 6% Claims (98) (120)
Claims (586) (632) General Cargo Ships 2.2%
Offshore vessels 3%
Passenger & Cruise 2%
Others 1.6% Operating Expenses (27) (27)
Operating Expenses (80) (83)
Total Expenditure (125) (147)
Total Expenditure (665) (715)
Tonnage Trading Area Underwriting Result (83) (11) Flag State Underwriting Result 12 (12)
Investments (4) 30
Asia 28% Investments 118 113
Other 74.8%
Greece 19% Tax (4) (9)
Rest of Europe 18%
Tax (12) 105 (16)
Norway 14% Japan 16.0% Overall Result 4 9
Overall Result 22 86
Americas 11%
Asia (excl.
Germany 8% 9.2%
Japan)
Middle East 2% CNR 107.5% 111.9%
CNR (ETC basis) 114% 102%
US$ 2015 2016 2017 2018 2019 2020 2021
US$ 2015 2016 2017 2018 2019 2020 2021
• Free Reserves (m) 172 187 208 227 238 236 244
• Free Reserves (m) 969 1,017 1,135 1,249 1,159 1,179 1,263
• Entered Tonnage (m) 263 305 307 308 315 340 356 • Entered Tonnage (m) 93 92 92 94 96 99 97
1,400 400
1,400 400
300
1,200 120
350
1,200 350
300
Gross Tonns (m)
(m) (m)
300 1,000
250 100
Gross Tonns (m)
US$ (m)
1,000
250
Gross Tonns (m)
250 800
US$US$
800 200 80
200
200 600
600 150 60
150
150
400 100
400 100 100 40
200 50
200 50 50 20
- -
- -
0 2014 2015 2016 2017 2018 2019 2020 0
2015 2016 2017 2018 2019 2020 2021
2015 2016 2017 2018 2019 2020 2021
P&I ANNUAL REVIEW 2020 1
P&I ANNUAL REVIEW 2020 1
P R O T E C T I O N & I N D E M N I T Y: R E N E W A L 2 0 2 2 / 2 3 CO M M E N TA R Y | 10CLUB FINANCIAL S
LONDON
London NORTH
North
S&P Rating: BBB (Negative Outlook) S&P Rating: A (Negative)
Combined Net Ratio 137% Investment Return 5.3% Entered Tonnage 68m GT Combined Net Ratio 114% Investment Return 6.7% Entered Tonnage 248m GT
Underwriting Result -USD 37m Overall Result -USD 20m Free Reserves USD 154m Underwriting Result -USD 45m Overall Result USD 6m Free Reserves USD 450m
The result for 2020/21 policy year underlined again the need to address the discrepancy between premiums and claims costs and this together with
“The 2020/21 Policy Year saw a continuation of the recent trend of heightened severity in terms of the IG Pool claims
the development of our covers in response to Member feedback / interest – such as our new K&R facility – are central parts of our strategy. At the experience. Indeed our contribution to our Pooling partners’ claims was a significant factor behind North’s 113.7% combined
same time the importance of a sustainable approach is of increasing relevance across all parts of our operation. For example, from what we do in ratio, which nevertheless still represented a positive achievement, following the peak of 125.8% for the previous year. This
our day to day management of the Club, to our work to identify how we can most effectively support our Members with the emerging challenges in was aided by our prudent diversification strategy which saw notable premium increases achieved across the Sunderland
environmental and related arenas. Marine Hull, P&I and Aquaculture lines and the newer, diversified Owners’ Fixed Premium P&I as well as North’s Hull
facilities” Thya Kathiravel, Chief Underwriting Officer
Ian Gooch - Chief Executive
2020 2021
Vessel Type 2020 2021 Vessel Type Financials (USD)
Financials (USD) (m) (m)
(m) (m)
Gross Premium 347 406
Bulk Carriers 52% Gross Premium 117 119 Dry Bulk 40%
Tankers Reinsurance Premium (66) (80)
24% Reinsurance Premium (19) (20)
Tankers 24%
Containers 18% Net Premium 281 326
Net Premium 98 100
Container and General
22%
Gas Carries 3% Cargo Claims (274) (301)
Claims (119) (120)
General Cargo 3% Others 14% Operating Expenses (77) (70)
Operating Expenses (15) (16)
Total Expenditure (352) (371)
Total Expenditure (134) (137)
Underwriting Result (70) (45)
Tonnage Trading Area Underwriting Result (35) (37) Tonnage Trading Area
Asia Pacific Investments 69 67
Investments 42 17 35%
Southern Europe 54% Greece 17%
Pension Scheme Deficit (16) (11)
Tax (0.4) (0.1) Other Europe 16%
Asia 43% Scandinavia 12% Tax (0.5) (3.7)
Overall Result 6 (20)
Middle East 11%
North America 6% Overall Result (18) 6
Americas 3%
UK 3%
CNR 137% 137%
CNR 125% 114%
US$ 2015 2016 2017 2018 2019 2020 2021 US$ 2015 2016 2017 2018 2019 2020 2021
• Free Reserves (m) 157 161 188 195 169 174 154 • Free Reserves (m) 338 428 431 450 463 444 450
• Entered Tonnage (m) 52 54 56 62 68 67 68 • Entered Tonnage (m) 170 185 190 195 207 230 248
250 80 500 300
70 450
200 400 250
60
Gross Tonns (m)
Gross Tonns (m)
US$ (m)
US$ (m)
350 200
150 50 300
40 250 150
100 30 200
150 100
20
50 100 50
10 50
0 0 0 0
2015 2016 2017 2018 2019 2020 2021 2015 2016 2017 2018 2019 2020 2021
2020 figures include the supplementary calls announced in 2019.
P&I ANNUAL REVIEW 2020 1
P&I ANNUAL REVIEW 2020 1
P R O T E C T I O N & I N D E M N I T Y : R E N E W A L 2 0 2 2 / 2 3 C O M M E N T A R Y | 11THE SHIPOWNERS’
The Shipowners’ CLUB
Club SKULD
S&P Rating: A (Stable)
Skuld
S&P Rating: A (Stable)
Combined Net Ratio 101% Investment Return 8% Entered Tonnage 28m GT S&P Rating: A+ (Stable)
Combined Net Ratio 108% Investment Return 9.8% Entered Tonnage 98m GT
Underwriting Result -USD 9m Overall Result USD 39m Free Reserves USD 379m
Underwriting Result -USD 30m Overall Result USD 25m Free Reserves USD 459m
This has been a very challenging year across the globe and on-one has been unaffected by the global
pandemic but yes, Shipowners’ has risen to the challenge and delivered what it set out to do in terms of both
“We continue to profit from our high quality membership, and our firm diversification strategy delivers robust financial benefits
Member support and indeed financial stability.
when meeting the rising loss trend in the industry. That said, the mutual premium levels are still unsustainable, and our policy
Philip Orme, Club Chairman of strategic avoidance of imposing a general increase and seeking individual and selective, performance-based increases will
remain. Skuld maintains its leadership position through financial strength and commitment to the highest quality service and
support for our members and clients as we approach our 125th year of operation.”
2020 2021 Ståle Hansen, President and CEO
Vessel Type Financials (USD)
(m) (m)
Harbour 25%
Premium by Vessel Type Financials (USD)
2020
(m)
2021
(m)
Gross Premium 225 232
Barge 18%
Passenger 14% Reinsurance Premium (25) (25) 23% Gross Premium 391 391
Fishing 15% Offshore 18%
Offshore 11% Net Premium 200 207 14% Reinsurance Premium (47) (45)
Yachts 9% Gas/Chemical Tanker 12%
Dry Cargo 4% 11% Net Premium 343 346
Claims (156) (157)
Tankers 4% Others 10%
Claims (289) (301)
Autonomous 0.09% Operating Expenses (54) (59) 7%
Passenger 6% Operating Expenses (90) (75)
Total Expenditure (210) (216)
Total Expenditure (379) (376)
Tonnage Trading Area Underwriting Result (10) (9)
Southeast Asia… 51% Investments 48 49 Premiums by Region Underwriting Result (35) (30)
Europe 19.10% 29% Investments 55 62
Central &… 10%
Tax (1.8) (1.3) Rest of… 20%
Middle East &… 10% 19% Tax 5.6 (8)
Overall Result 36 39 Norway 11%
Australia, New… 4%
North America 4%
8% Overall Result 25 24
Germany 6%
Africa 2%
CNR 105% 101 % 4%
Greece 3%
CNR 110% 108%
US$ 2015 2016 2017 2018 2019 2020 2021
• Free Reserves (‘000) 300 279 294 342 304 340 379 US$ 2015 2016 2017 2018 2019 2020 2021
• Entered Tonnage (m) 24 25 25 25 27 27 28 • Free Reserves (‘000) 335 347 394 442 453 466 459
• Entered Tonnage (m) 74 78 85 90 89 93 98
400 30
350
25 500 120
300
Gross Tonns (m)
450
US$ (m)
20 100
250 400
Gross Tonns (m)
US$ (m)
200 15 350 80
300
150
10 250 60
100 200
5 40
50 150
0 0 100 20
2015 2016 2017 2018 2019 2020 2020 50
0 0
2015 2016 2017 2018 2019 2020 2021
P&I ANNUAL REVIEW 2021 1 P&I ANNUAL REVIEW 2020 1
P R O T E C T I O N & I N D E M N I T Y : R E N E W A L 2 0 2 2 / 2 3 C O M M E N T A R Y | 12STANDARD
Standard STEAMSHIP
Steamship
S&P Rating: A (Negative outlook) S&P Rating: A (Stable)
S&P Rating: A+ (Stable)
Combined Net Ratio 127% Investment Return 4.7% Entered Tonnage 149m GT Combined Net Ratio 125% Investment Return 4.8% Entered Tonnage 177m GT
Underwriting Result -USD 62m Overall Result -USD 33m Free Reserves USD 360m Underwriting Result -USD 59m Overall Result -USD 4m Free Reserves USD 511 m
Whilst at a relatively early stage of development, positive action taken during last renewal to materially improve premium rates and
our own claims performing better than expected for the first six months of the year, enables us to forecast an improved combined “Despite the unique challenges of the Pandemic, and the very high levels of Pool claims affecting the IG clubs
ratio for 2021/22 compared with 2020/21. However, another year of large expensive pool claims across the International Group, as a whole, Steamship Mutual is in a very strong position, with substantial free reserves and a growing
continuing low level of premium rating and some additional exposure arising from the global pandemic means that there will need membership. The Club is well positioned to provide the financial security and service which our Members
to be a further adjustment in rating at the forthcoming renewal. Jeremy Grose, Chief Executive Officer
expect and which attract new Members interested in joining the Club”. Stephen Martin, CEO,
2019 2020
Financials (USD)
(m) (m)
Vessel Type
Gross Premium 353 293 Vessel Type 2019 2020
Financials (USD)
(m) (m)
Container and general cargo 30%
Reinsurance Premium (96) (64) Bulk Carrier 35%
Tanker 29% Gross Premium 309 284
Net Premium 257 228 Tankers 24%
Dry bulk 24% Reinsurance Premium (48) (51)
Offshore 14%
Container 22%
Claims (309) (260)
Passenger and ferry
Net Premium 260 234
Passenger and ferry 2% 11%
Operating Expenses (58) (30)
Other 1% General Cargo 5% Claims (219) (253)
Total Expenditure (367) (290) Others 3%
Operating Expenses (41) (40)
Underwriting Result (110) (62)
Tonnage Trading Area Total Expenditure (260) (293)
Rest of Europe Investments 69 29
33%
Tonnage Trading Area Underwriting Result 0.5 (59)
Rest of Asia 20%
Tax (0.7) (0.7)
Greece 13% Europe Investments 67 54
40%
Americas 12% Overall Result (41) (33)
Nordic countries Far East 39% Tax (3) 1
10%
Japan 8% Norht America 15%
Rest of the World
Overall Result 65 (4)
4%
CNR 143% 127% Africa, Middle
East & Indian… 4%
Latain America 2%
US$ 2015 2016 2017 2018 2019 2020 2021
CNR 99.8% 125%
• Free Reserves (‘000) 380 390 430 461 435 393 360
• Entered Tonnage (m) 136 138 149 159 155 156 149
US$ 2015 2016 2017 2018 2019 2020 2021
500 180
• Free Reserves (‘000) 376 440 510 516 467 515 511
450
400
160
• Entered Tonnage (m) 120 129 151 158 160 156 177
140
Gross Tonns (m)
US$ (m)
350 120
300 600 200
100
250 180
80 500
200 160
60
Gross Tonns (m)
150
US$ (m)
400 140
100 40
120
50 20
300 100
0 0 80
2015 2016 2017 2018 2019 2020 2021 200 60
100 40
20
0 0
2015 2016 2017 2018 2019 2020 2021
P&I ANNUAL REVIEW 2021 1
P&I ANNUAL REVIEW 2020 1
P R O T E C T I O N & I N D E M N I T Y : R E N E W A L 2 0 2 2 / 2 3 C O M M E N T A R Y | 13CLUB FINANCIAL S
SWEDISH CLUB
Swedish Club UK
UK CLUB
Club
S&P Rating: A- (Stable) S&P Rating: A (Negative)
Combined Net Ratio 120% Investment Return % Entered Tonnage 88m GT Combined Net Ratio 150% Investment Return 5.6% Entered Tonnage 239m GT
Underwriting Result -USD 26m Overall Result USD 5m Free Reserves USD 231m Underwriting Result -USD 105m Overall Result -USD 52m Free Reserves USD 507m
” The Swedish Club - The Forward Thinking Club. With good growth, solid finances, stable results and a relentless focus on service excellence, the Club The COVID-19 outbreak has brought with it both challenges and opportunities for the UK Club and its Members alike. As a
has never been better equipped to meet future challenges. The Trade Enabling Loss Prevention (TELP) initiative – an automated and digital loss strong P&I insurer, the Club has been well placed to navigate these unusual waters. The Club places significant
prevention tool based on real-time AIS data – has continued to evolve during 2021. The Club now offers members and their vessels importance on its loss prevention and safety initiatives, which are not only beneficial to our Members’ operations but also
comprehensive, timely and tailored loss prevention advice which includes claim alerts, correspondent’s advice, piracy alerts and bunker alerts. TELP is work to protect the lives of thousands of sea-farers and passengers worldwide. We seek to form strong long-term
delivered just in time, before it happens. That makes a difference. partnerships with Members and focus on understanding the needs of each Member and meeting these needs through
Lars Rhodin, Managing Director “ exceptional service and innovative solutions.
2020 2021 Vessel Type 2020 2021
Vessel Type Financials (USD) Andrew Taylor, CEO Financials (USD)
(m) (m)
(m) (m)
Bulker 40% Gross Premium 157 174 Bulk Carrier 34% Gross Premium 306 288
Container 30% “Insert quote in here. Text to come. Grab your readers attention with a great quote from the
Tanker 28% Reinsurance Premium (60) (77)
Tanker 18%
Reinsurance Premium (39) (39) document or use this space to emphasise a key point. Text box should stay on this part of
General Cargo 5% Net Premium 118 135 the page. To be added
Gas Carrier 14%at a later date.” Net Premium 245 211
Misc. 4% Container 12%
Claims (102) (136) Claims (252) (273)
Pssengers 2%
Other 12%
Roro 1% Operating Expenses (24) (25) Operating Expenses (44) (44)
Total Expenditure (126) (161) Total Expenditure (295) (316)
Underwriting Result (8) (26) Tonnage Trading Area Underwriting Result (50) (105)
Tonnage Trading Area
Investments 32 34 Europe, Middle
Investments 106 53
Asia 54% 51%
East & Africa
Tax (6) (2) Tax (2.0) (0.3)
S Europe 27%
Asia 39%
Overall Result 18 5 Overall Result 54 (52)
N Europe 17%
Americas 10%
Mid East 2%
CNR 107% 107% CNR 120% 150%
US$ 2015 2016 2017 2018 2019 2020 2020 US$ 2015 2016 2017 2018 2019 2020 2021
• Free Reserves (‘000) 188 183 195 214 204 228 231 • Free Reserves (‘000) 548 547 558 537 505 559 507
• Entered Tonnage (m) 62 71 74 75 76 80 88 • Entered Tonnage (m) 225 234 239 239 244 242 239
250 100 600 300
90 500 250
200 80
Gross Tonns (m)
US$ (m)
Gross Tonns (m)
US$ (m)
70 400 200
150 60
50 300 150
100 40 200 100
30
50 20 100 50
10
0 0 0 0
2015 2016 2017 2018 2019 2020 2020 2015 2016 2017 2018 2019 2020 2021
2020 figures include the supplementary calls announced in 2019.
P&I ANNUAL REVIEW 2020 1
P&I ANNUAL REVIEW 2020 1
P R O T E C T I O N & I N D E M N I T Y : R E N E W A L 2 0 2 2 / 2 3 C O M M E N T A R Y | 14CLUB FINANCIAL S
WEST
West GENERAL INCREASE
S&P Rating: A- (Negative)
Combined Net Ratio 140% Investment Return 4.6% Entered Tonnage 106m GT
HISTORY
Underwriting Result -USD 80m Overall Result -USD 47m Free Reserves USD 291m
Policy Year 2011 2012 2013 2014 2015 2016 2017 2018 2019 2020 2021
“The ongoing pandemic together with a number of other factors has meant a difficult year for the industry. There
has been almost a “perfect storm" of challenges with investment market volatility, an adverse claims environment
especially around Covid-related liabilities and the severity of other Clubs’ Pool claims, plus of course concern American Club 2 5 10 10 4.5 2.5 0 0 0 0 5
around the health and well-being of our Members’ crews and our own people. Our team has been resourceful and
flexible in meeting these challenges head on and our Balance Sheet resilient in the face of this adversity, so West
stands strong and well-placed to support our Members’ future needs”. Tom Bowsher, Group CEO Britannia 5 5 12.5 2.5 2.5 2.5 0 0 0 0** N/A
Vessel Type 2019 2020
Financials (USD)
(m) (m)
Bulk cargo Carriers 37.8% Gross Premium 222 243
Gard 0 5 5 5 2.5 2.5 0 0 0 0 N/A
Tankers & OBOs (inc LPG/… 32.8% Reinsurance Premium (40) (41)
Container vessels 16.3%
Net Premium 182 202
General cargo & Reefers 9.2% Japan Club 10 3 5 7.5 3 3 0 0 0 7.5 10
Specialist vessels & misc 2.2% Claims (157) (240)
Ferries & Passenger liners 1.7% Operating Expenses (38) (43)
London Club 5 5 12.5 10 6 5 0 0 0 7.5 10
Total Expenditure (195) (282)
Tonnage Trading Area Underwriting Result (13) (80)
Asia 43.8% Investments 46 35 North of England 3 5 15 7.5 4.75 2.5 0 0 0 7.5 10
Other Europe 23.4% Tax (1) (2)
Greece 19.9%
Overall Result 31 47 Shipowners Club 0 0 5 5 0 0 0 0 0 5 5
Middle East/
Africa ect 8.0%
Americas 4.9%
CNR 107% 140% Skuld* N/A N/A N/A N/A N/A N/A N/A N/A N/A N/A N/A
US$ 2015 2016 2017 2018 2019 2020 2021 Standard 3.5 5 7.5 12.5 5 2.5 0 0 0 7.5 10
• Free Reserves (‘000) 244 277 307 308 306 338 291
• Entered Tonnage (m) 68.3 73.4 83.6 90.5 93.9 101.5 106 Steamship 0 5 7.5 10 0 0 0 0 0 7.5 5
400 120
350 Swedish 2.5 5 7.5 7.5 2.5 0 0 0 0 5 5
100
300
Gross Tonns (m)
US$ (m)
80
250
UK Club 5 3 7.5 10 6.5 2.5 N/A N/A N/A 0** 10
200 60
150
40
100
20 West of England 5 5 7.5 7.5 2.5 0 0 0 5 2.5 7.5
50
0 0
2015 2016 2017 2018 2019 2020 2021
* Skuld have not announce a General Increase in 10 years, instead they approach each risk on an individual basis.
** These clubs didn’t not announce a General Increase, but did announce they wished to increase premiums across the whole book by 7.5%
2020 figures include the supplementary calls announced in 2019.
P&I ANNUAL REVIEW 2020 1
P R O T E C T I O N & I N D E M N I T Y : R E N E W A L 2 0 2 2 / 2 3 C O M M E N T A R Y | 15SUPPLEMENTARY RELEASE CALLS
CALL HISTORY Mutual clubs need to ensure that all members
can meet their obligations in the unlikely event
that a club has to recapitalise. This applies even
to maintain a much higher level of capital to
weather unexpected economic downturns.
to members that may have already left the club. Having paid a release call, the member leaving the
Club 2011 2012 2013 2014 2015 2016 2017 2018 2019 2020 2021 Most clubs set release calls for the prior three open club is protected from the obligation to pay any
policy years, plus the current policy year, and supplementary calls later levied for policy years in
reduce the release calls as policy years near closing/ which they were club members. However, as can
American 25/25 0/0 0/0 0/0 0/0 0/22.5 0/17.5 0/0 0/0 0/0 0/0
are closed. The release call is set at a percentage be seen in our supplementary call history table
of mutual premium for each open policy year. overleaf, the only club in the past 10 years to call
Britannia 40/32.5 40/40 45/45 45/35 45/40 45/45 45/45* 45/45* 45/45* 45/45* 45/45 Leaving members can either pay in cash or put up a supplementary call is the American Club (who,
a bank guarantee or ESCROW. Generally, a bank uncoincidentally, are not subject to Solvency II).
guarantee or ESCROW is preferable; in the event
Gard 25/20 25/15 25/15 25/15 25/15 25/0 25/0 25/12.5 20/15 20/20 0/-5 that the club does not need to recapitalise, the
member will not have to exchange any real cash. Clubs now hold capital well in excess of the
regulatory requirements and have had no
Japan 40/40 40/40 40/40 40/20 40/30 40/30 40/40 40/40 40/40 40/40 40/40 supplementary calls (aside from the American
However, there is a question about whether Club) in over a decade. Whilst many clubs are
release calls are still necessary to the mutual club returning money to the membership, it has to be
system. The historical premise was to provide questioned whether release calls are still necessary.
London 0/0 0/0 0/0 0/0 0/0 0/0 0/0 0/0 0/35 0/30 0/35
financial protection to the remaining membership It will continue to be a discussion between
when owners chose to leave. However, after the members/brokers and the IG Clubs, and in time
financial crash in 2008, most clubs are subject we may see more clubs choose to do away with
North 0/0 0/0 0/0 0/0 0/0 0/-5 0/0 0/0 0/0 0/0 0/0 to Solvency II regulations which require them release calls like the SOP did several years ago.
Shipowners 0/0 0/0 0/0 0/0 0/0 0/0 0/0 0/0 0/0 0/0 0/0
Club 2016 2017 2018 2019 2020 2021
American Closed Closed 20 20 20 20
Skuld 0/0 0/0 0/0 0/0 0/-2.5 0/-2.5 0/0 0/0** 0/0 0/0 0/0
Britannia Closed Closed Nil 5 7.5 15
Gard Closed Closed 5 5 10 10
Standard 0/0 0/0 0/0 0/0 0/0 0/-5 0/-5 0/0 0/0 0/0 0/0
Japan Closed Closed 5 5 5 5
Steamship 0/0 0/0 0/0 0/-10 0/-10 0/0 0/0 0/-10 0/-7.5 0/0 0/0 London Closed Closed 5 12.5 15 15
North Closed Closed 0 5 15 15
Swedish 0/0 0/0 0/0 0/0 0/0 0/0 0/-3 0/-4 0/0 0/0 0/0 Shipowners Closed Closed 0 0 0 0
Skuld Closed Closed 7.5 10 15 15
UK 0/-2.5 0/0 0/0 0/-2.5 0/-3 0/0 0/0 0/0 0/0 0/0 0/0 Standard Closed Closed 0 0 6 12.5
Steamship Closed Closed 5 10 10 10
West of England 30/30 30/30 35/35 35/35 35/35 35/35 35/35 0/0 0/0 0/0 0/0
Swedish Closed Closed 5 12 15 15
UK Closed Closed 5 10 15 20
* Britannia announced an additional $10mil capital distribution for Oct 2020. Bringing the total dividend payments
to Membership to $85mil since 2017. A total of $30mil in 2017, $30mil in 2018 and $15mil in 2019. West of England Closed Closed 0 7.5 15 15
** Skuld returned $5mil to membership as a % of individual member contribution. *Excluding any unpaid supplementary calls
P R O T E C T I O N & I N D E M N I T Y : R E N E W A L 2 0 2 2 / 2 3 C O M M E N T A R Y | 16FIXED MARKET
any of the clubs’ facilities – do tend to have an COVID-19
advantage when it comes to stability because As detailed in our 2021 P&I Bulletin, the P&I clubs’
they provide their own security (although they mutual books have retained COVID-19 cover
REVIEW
do have reinsurance in the background). as their excess of loss reinsurance programme
is running on a two-year deal, which expires
However, both cohorts have been affected by on 20 February 2022. The clubs’ fixed books
the hardening market, with both looking for and the fixed commercial market are probably
increases of between 2.5% and 10% on clean a good indicator of what is to come.
The two Cohorts trade and do not necessarily need the coverage/
business. Although expiry renewals have been
The fixed P&I market can be broadly split into two limits offered by a full-blown mutual entry.
possible where there is strong market pressure, The clubs’ fixed books have not excluded
distinct categories. The first category is commonly
these are in the minority. These increases have COVID-19, but they have sub-limited this cover,
referred to as the fixed commercial market and The clubs provide the primary security for these primarily been sought as a result of claims inflation with limits ranging from $1 million up to a
comprises MGAs (Managing General Agents), such facilities, and aside from the additional revenue and the hardening reinsurance market, where maximum of $10 million. The fixed commercial
as EF Marine, Carina and Thomas Miller Specialty, stream, they also help the clubs diversify their these providers either purchase their primary market has tended to adopt an even stricter
alongside those with their own insurance capacity, books – which is beneficial for security rating insurance capacity when it comes to the MGAs, approach and has excluded COVID-19 absolutely,
such as British Marine (part of QBE) and MS Amlin. purposes. It is worth noting here that the clubs’ fixed or their reinsurance in the case of the clubs. as per the market wording LMA 5395 (Coronavirus
books are not aligned with the usual quirks of the Exclusion). This disparity is generally the case
The second category is the fixed P&I product International Group Agreement, such as release calls because the MGAs are fully reinsured and do
Limits
that the IG clubs provide, so the likes of West, or general increase; but there is oversight when it not have any self-retention, unlike the clubs.
The clubs and fixed commercial market can all
Standard London Class, Eagle Ocean Marine (part comes to competing against mutual placements.
provide limits up to $500 million, with a few
of American P&I Club), to name but a few. Whilst
having dedicated reinsurance in place to provide Cyber
some of these providers have been around for Market Update limits up to $1 billion where required. Over time, Both the clubs and commercial providers
quite some time, many of them were created as a Market-wise, the clubs’ fixed offerings, whilst the number of carriers providing the $1 billion have taken a very strict approach to malicious
response to the growing fixed commercial market not always showing parity from a security limit has dropped because they have tended cyber-attacks. With the notable exception of
mentioned formerly and its perceived success. They rating perspective with their commercial to be underutilised by shipowners and are also Standard and SSM, all have excluded this cover
are distinct from the clubs’ poolable/mutual book counterparts – a case in point being EF Marine expensive to place (without the volume). from their standard terms. However, some are
of business and tend to cater for vessels below with their AA- S&P rating, which is higher than looking to place these exposures at an additional
25,000 GT that operate on a local/coastal/inland
premium outside their standard covers.
P R O T E C T I O N & I N D E M N I T Y : R E N E W A L 2 0 2 2 / 2 3 C O M M E N T A R Y | 17Carrier (Fixed,
Commercial Market)
Security
S&P
Rating
Gross Written
Premium (2020)
Tonnage
Entered
Maximum
Limit
Maximum GT Location CONTACTS
(2020)
15,000 (but will consider
QBE Insurance USD 1 Angus Bell Eleanor Urry
British Marine A+ USD 98.4 million 12.2 million higher GTs with special London, England
(Europe) Ltd. billion
approval) Client Manager Client Manager
Lloyd's / +44 (0)1245 702 376 +44 (0)207 086 1846
London USD 500 angus.bell@aon.co.uk eleanor.urry@aon.co.uk
Carina A+ USD 17 million 3.9 million 6,500 London, England
Company million
Market
Lloyd's /
Sarah Lamb Jacqui Coplen
Coastal Marine London USD 500
A+ USD 5 million 1 million 5,000 Chelmsford, England Client Manager Client Manager
Services Company million
Market +44 (0)20 7086 3155 +44 (0)1245 709136
sarah.lamb1@aon.co.uk jacqui.coplen@aon.co.uk
Swiss Re
USD 500 Singapore (HQ) /
EF Marine Corporate AA- USD 12 million 3.3 million 40,000
million Rotterdam (Subsidiary)
Solutions
Chris Chadwick Julie Vine
Lloyd's / Executive Director Client Manager
London USD 1
Hydor A+ USD 25 million 4.5 million 45,000 Oslo, Norway +44 (0)20 7086 4185 +44 (0)1245 706093
Company billion
Market christopher.chadwick@aon.co.uk julie.vine@aon.co.uk
MS Amlin's
Syndicate Rotterdam,
USD 1
MS Amlin 2001 / Amlin A+ USD 32.1 million 18.2 million 40,000 Netherlands / London, David Mahoney Chris Gimson
billion
Insurance SE England Executive Director Director
(AISE)
+44 (0)1245 709 249 +44 (0)20 7086 3155
Norwegian Hull Club Lloyd's A USD 11.5 million Undisclosed
USD 750
25,000 Oslo, Norway
david.mahoney@aon.co.uk christopher.gimson@aon.co.uk
million
Dry Cargo 25,000 (up to
London, England
Thomas Miller USD 500 30,000 in a fleet) /Clean
AIG / Lloyd's A+ USD 48 million 3.1 million (HQ) / Hamburg,
Specialty million Tankers 20,000 / Dirty
Germany
Tankers 10,000
Gross Written Tonnage
Carrier (Fixed, IG S&P Maximum
Security Premium $ Entered Maximum GT Location
Club) Rating Limit $
(2020) (2020)
Skuld Skuld P&I Club A 16.4 million 2.1 million 1 billion 25,000 London, England
Eagle Ocean Marine American P&I
BBB- 17.4 million 2.9 million 500 million 25,000 New York, USA
(American Club) Club
Fish / Yachts – No Limit /
Shipowners' USD 1 London, England
Shipowners A 77 million 7.6 million Barges < 6,000 / All other
P&I Club billion (Management)
< 1,000
10,000 - some allowance
if vessel over 10,000
The Standard Club The Standard
A Undisclosed Undisclosed 1 billion GT forms part of a fleet London, England
(London Class) Club
enquiry where average
GT falls below 10,000 GT
Sunderland Marine North of 10,000 (with approval can London/Newcastle,
A 7.5 million 1 million 500 million
(North of England) England look at higher GTs) England
The London
The London P&I Club BBB 13.2 million 2.9 million 1 billion 12,500 London, England
P&I Club
West of 10,000 (can look at higher
West of England A- 10 million 1.3 million 1 billion London, England
England GTs if part of a fleet)
P R O T E C T I O N & I N D E M N I T Y: R E N E W A L 2 0 2 2 / 2 3 CO M M E N TA R Y | 18About Aon Aon plc (NYSE:AON) is a leading global professional services firm providing a broad range of risk, retirement and health solutions. Our 50,000 colleagues in 120 countries empower results for clients by using proprietary data and analytics to deliver insights that reduce volatility and improve performance. © Aon plc 2021. All rights reserved. The information contained herein and the statements expressed are of a general nature and are not intended to address the circumstances of any particular individual or entity. Although we endeavor to provide accurate and timely information and use sources we consider reliable, there can be no guarantee that such information is accurate as of the date it is received or that it will continue to be accurate in the future. No one should act on such information without appropriate professional advice after a thorough examination of the particular situation. Aon UK Limited is authorised and regulated by the Financial Conduct Authority. aon.com
You can also read