REINZ & TONY ALEXANDER REAL ESTATE SURVEY - August 2021 - ISSN: 2703-2825
←
→
Page content transcription
If your browser does not render page correctly, please read the page content below

REINZ &
        TONY ALEXANDER
       REAL ESTATE SURVEY
                                             August 2021

© REINZ - Real Estate Institute of New Zealand             ISSN: 2703-2825
DESPITE WINTER’S RAVAGES,
SENTIMENT IMPROVES
Welcome to the REINZ & Tony Alexander Real Estate
Survey. This survey gathers together the views of licensed
real estate agents all over New Zealand regarding how they
are seeing conditions in the residential property market
in their areas at the moment. We ask them how activity
levels are changing, what the views of first home buyers
and investors are, and the factors which are affecting the
sentiment of those two large groups.

The results show that both first home buyers and investors
continue to step back slightly from the market. But as
has been observed in other surveys, the period of peak
withdrawal ended 2-3 months ago and trends for most of
our measures are strengthening.                                ARE MORE OR FEWER PEOPLE ATTENDING OPEN
                                                               HOMES?
In particular, a gross 66% of agents now report seeing
FOMO on the part of buyers, up from 49% at the end of          For open home attendance, we can see the same pattern
April. A net 61% of agents feel that prices are rising – the   of response as reported above for agent perceptions of
highest result since late-February. A net 7% are seeing        attendance at auctions. We have seen five months now
fewer investors selling, not more, and only 19% of agents      of more agents reporting fewer people visiting for home
report that buyers are concerned that prices will fall. That   inspections following the tax announcement. But as with
proportion peaked at 37% late in April.                        auction attendance, we can see that peak weakness was
                                                               captured in the May and June surveys and the latest result
Each of the questions we ask agents is discussed below.        of a net 7% seeing fewer people attending open homes is
                                                               the least weak since March.
ARE MORE OR FEWER PEOPLE SHOWING UP AT
AUCTIONS?                                                      The results from these first two questions gel with those
                                                               from other surveys of mortgage advisors and consumers
For the fifth month in a row following the March 23 tax        generally showing that peak market withdrawal occurred
announcement there have been more agents reporting a           during the April – May period. But as yet, we have not
decline in numbers attending auctions than an increase.        reached the stage of the surveys in our collection showing
This is one of the developments which has contributed to a     actual increases in buyer numbers.
slowing in the pace of prices growth on average since then,
as seen in the REINZ House Price Index measures.

It has also contributed to a slowing of sales in seasonally
adjusted terms according to monthly REINZ turnover data.

But from the graph below we can see that the peak period
of withdrawal from auctions occurred over May – June
(late-April to late-May survey dates) and at a net -11% the
most recent result is equal to that of the week immediately
following March 23.

2
HOW DO YOU FEEL PRICES ARE GENERALLY
CHANGING AT THE MOMENT?
The net proportion of real estate agents reporting that they
feel prices are going up in their location has increased for
the third month in a row to sit at 61% from a low of 30% in
our May survey undertaken at the very end of April. Price
change perceptions are now stronger than in the week
after the March 23 tax announcement.
One point to be noted is that our survey this month
occurred entirely after the period of the stronger than
expected inflation outcome for the June quarter and the
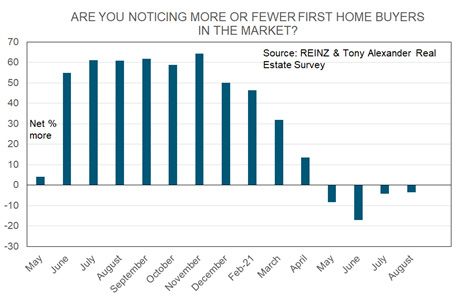
subsequent sharp lifting of expectations regarding the ARE YOU NOTICING MORE OR FEWER FIRST HOME
speed with which mortgage rates will increase this year. BUYERS IN THE MARKET?
Commensurate with the results for auctions and open
homes showing fewer people still in attendance, so too
do agents continue to report that they are seeing fewer
first home buyers in the market. But at -4% this proportion
is low and the decline since after the March 23 tax
announcement tells us that any positive feelings regarding
a shift in market share towards first home buyers have
continued to be overwhelmed by other factors in play.
Note that on average between 2011 and 2014 when this
same question was asked in a previous similar survey, a
net 31% of agents responded that prices are rising. The
nationwide pace of price increase back over that 2011-14
period of time averaged just over 5% per annum.
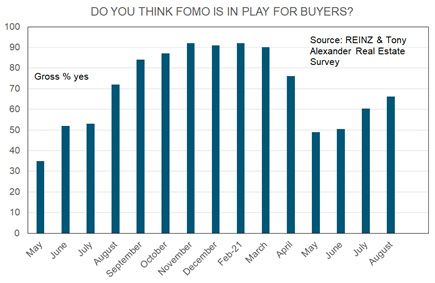
DO YOU THINK FOMO IS IN PLAY FOR BUYERS?
FOMO = Fear of missing out
Those other factors have been producing a decline in the
As has been the case for the other three measures so far number of extra first home buyers entering the market
discussed, there has been a rise in the gross proportion of since the peak in our November survey. High prices and
real estate agents around the country reporting that they lack of listings are likely to remain factors discouraging
are seeing FOMO on the part of buyers. A gross 66% of young buyers from seeking out a purchase.
agents have reported FOMO, up from 60% last month and a
low of 49% late in April. ARE YOU NOTICING MORE OR FEWER INVESTORS IN
THE MARKET?
Late in February, FOMO stood at a gross 90% so the
intensity of feeling by buyers is less than during the most There was a downward trend in the number of extra
frenzied period of market activity broadly from August investors entering the market seeking to make a purchase
to February. But as with our other measures there is an before the Reserve Bank announced the reinstatement of
upward trend in place suggesting a return of market LVRs early in June, and the Finance Minister changed the
strength as winter has been proceeding. tax regime for property investors late in March. That trend
was accelerated by the tax changes.
3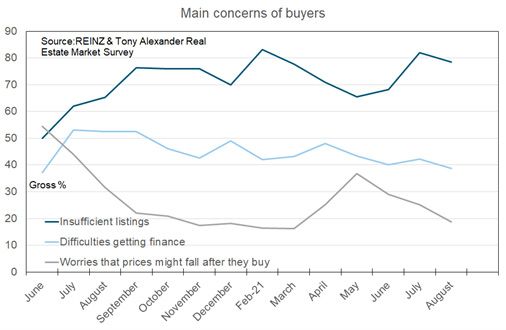
appraisals from potential sellers. This suggests that the
                                                                decline in new listings numbers in seasonally adjusted
                                                                terms reported in recent months by realestate.co.nz is likely
                                                                to continue in the near future.

But over the past two months the extent of investor
withdrawal has eased. This does not mean investors are
coming back into the market as yet and at -42% there is still
a considerable degree of market withdrawal happening for
investors.

But the development does gel with our other measures            Comments made by respondents in our various surveys
showing that peak weakness in the market happened 2-3           show that many potential vendors are refraining from
months ago.                                                     selling because they have deep worries about not being
                                                                able to find a replacement property to buy or even rent.
ARE YOU RECEIVING MORE OR FEWER ENQUIRIES
FROM OFFSHORE?                                                  WHAT ARE THE MAIN CONCERNS OF BUYERS?

We continue to find no evidence to back up a view that the      Each month we produce two graphs showing the gross
impact of the global pandemic will be to produce a wave         proportion of agents citing each of six factors which
of people (foreigners and ex-pats) coming to New Zealand.       concern buyers the most. The first graph below tells
This month a net 45% of agents have reported that they          us that the main concern of buyers continues to be a
are receiving fewer enquiries from people located offshore.     shortage of listings. There is a slight downward trend in
This is the lowest result on record and unlike all of the       concerns regarding accessing finance and worries about
other main indicators so far discussed there is no sign of a    prices falling have now declined for three months in a row.
turning point in this gauge of market strength.                 Evidence of an absence of prices falling following the LVR
                                                                and tax policy announcements has almost fully reversed
                                                                the rise in price decline worries which arose immediately
                                                                following those announcements.

ARE PROPERTY APPRAISAL REQUESTS INCREASING
OR DECREASING?

In this month’s survey a net 8% of agents have reported
that they are receiving fewer requests for property

4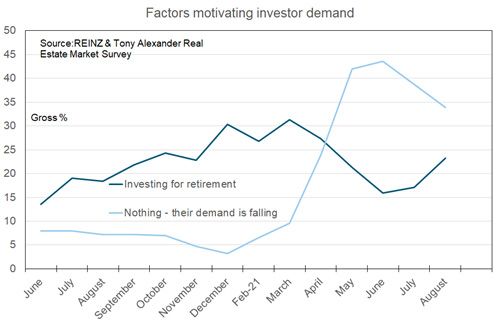
Our second graph now contains three months’ worth of
responses to the added concern of “Rising interest rates”.
We can see that this concern is still much smaller than
high prices, but it has increased strongly over the month.
It would have been very surprising had this not happened
considering that lenders have increased their mortgage
rates and the Reserve Bank is expected to start raising its
official interest rate very shortly.
WHAT FACTORS APPEAR TO BE MOTIVATING
INVESTOR DEMAND?
Concerns about income continue to trend downward in
an environment where labour demand is well in excess
of labour supply. The continued strong discussions
regarding labour shortages reveal that market wages are a
considerable way off approaching a new equilibrium where
things will be more in balance.
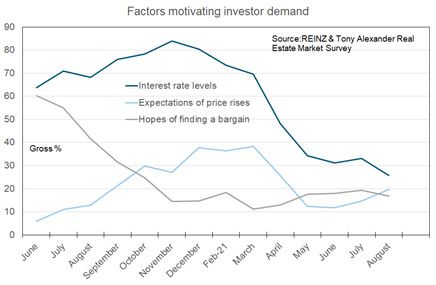
ARE INVESTORS BRINGING MORE OR FEWER With borrowing costs rising there has understandably been
PROPERTIES TO THE MARKET TO SELL THAN THREE a decline this month in the proportion of agents reporting
MONTHS AGO? that interest rates are a factor motivating investor demand.
But at a gross 26% this is still the strongest motivator. For
There is no statistical evidence in any of our surveys or in two months there has been a small rise in the proportion
any of the other measures available showing that there of agents noting price rise expectations as motivating
has been a wave of selling by investors in response to the investor buyers, but there is no trend change in readings
March 23 tax announcement. There are many anecdotes regarding hopes of finding a bargain. Those hopes were
regarding people selling. But the majority of these sellers understandably very high in the middle of last year. But
are likely to be either bringing forward in time some they quickly collapsed as prices soared and few weak
planned rationalisation of their portfolio, or the continued vendors appeared.
selling of less-desired stock which was underway ahead of
the tax announcement.
In this month’s survey a net 7% of agents have reported
that they are seeing fewer investors coming forward to sell
their properties. This is the lowest result since the end of
November last year and suggests firmly that listings will
remain in short supply.
5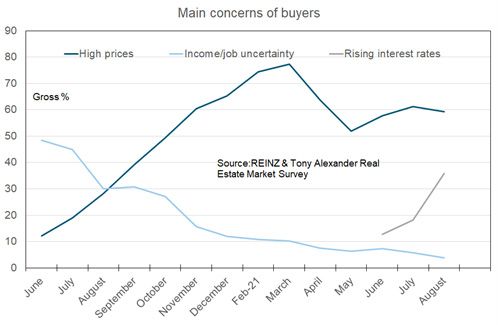
For the second month in a row there has been a decrease
in the proportion of agents reporting that investor demand
is falling. That is, a gross 34% of agents have reported that
they feel investor demand is weakening. But that is less
than 44% two months ago.

6
REGIONAL RESULTS

The following table breaks down answers to the numerical questions above by region. No results are presented for regions
with fewer than 7 responses as the sample size is too small for good statistical validity of results. Even for regions with
responses between 7 and 20, caution needs to be applied as results may prove quite volatile from one month to the next.
Nelson and Tasman results have been joined together as have those for Hawke’s Bay and Gisborne.

FOMO is least strong in Otago excluding Queenstown Lakes (Dunedin in other words), rising prices perceptions are
strongest in Canterbury followed by Taranaki and Waikato. Note the weakness across virtually all measures registered
for Hawke’s Bay. These add to the various gauges in my universe of surveys showing a turning point potentially being
close for this now highly priced region. Wellington is also highly priced and potentially moving in the same direction. Is
Canterbury starting it’s catch-up? Maybe, maybe.

    A.   # of responses
    B.   Are property appraisal requests increasing or decreasing?                 G.      Are you noticing more or fewer first home buyers in the market?
    C.   Are more or fewer people showing up at auctions?                          H.      Are you noticing more or fewer investors in the market?
    D.   Are more or fewer people attending open homes?                            I.      Are you receiving more or fewer enquiries from offshore?
    E.   How do you feel prices are generally changing at the moment?              J.      Are investors bringing more or fewer properties to the market to sell
    F.   Do you think FOMO is in play for buyers?                                          than three months ago?

                               A           B              C               D         E              F              G             H               I             J
                              #obs      Appraisals     Auctions         Open H.   Prices         FOMO            FHBs         Invest.        O/seas      Inv.selling
 Northland                     15            13           -33             13       60               80             -7           -40            -20           -20
 Auckland                      92            -8           -5               4       64               59             10           -38            -43            -9
 Waikato                       40            -3           -8              0        73               75             13           -10            -43           -30
 Bay of Plenty                 23            -4           -26             -4       48               57            -13           -70            -48           -26
 Hawke’s Bay                   17           -18           -18             -47      59               47            -6             -71           -53            6
 Taranaki                       11          -27           27              -18      73               82             9            -27            -36            18
 Manawatu-Wanganui             13            23           -38             -54       31              62            -23           -69            -85            31
 Wellington                    24            0            -46             -42      46               67            -38           -50            -46            -17
 Nelson/Tasman                  8            38            0              13       50              100            -38           -75            -50           -13
 Marlborough                    6
 West Coast                     0
 Canterbury                    48           -31           13               2       83               83             0            -33            -46            2
 Queenstown Lakes               2
 Otago exc Q’town               9            33           -22             -56      33               22            -56           -89            -56            56
 Southland                      3
 New Zealand                   311           -8           -11             -7        61              66             -4           -42            -45            -7

7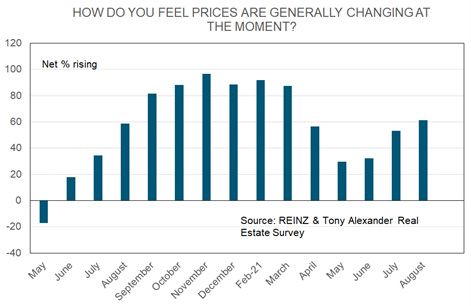
ISSN: 2703-2825

This publication is written by Tony Alexander, independent economist.
Subscribe here https://forms.gle/qW9avCbaSiKcTnBQA
To enquire about having me in as a speaker or for a webinar contact me at tony@tonyalexander.nz
Back issues at www.tonyalexander.nz

Tony’s Aim
To help Kiwis make better decisions for their businesses, investments, home purchases, and people by writing about the economy in
an easy to understand manner.

Feel free to pass on to friends and clients wanting independent economic commentary.

Disclaimer: This report is intended for general information purposes only. This report and the information contained herein is under no circumstances
intended to be used or considered as legal, financial or investment advice. The material in this report is obtained from various sources (including third
parties) and REINZ does not warrant the accuracy, reliability or completeness of the information provided in this report and does not accept liability for
any omissions, inaccuracies or losses incurred, either directly or indirectly, by any person arising from or in connection with the supply, use or misuse
of the whole or any part of this report. Any and all third party data or analysis in this report does not necessarily represent the views of REINZ. When
referring to this report or any information contained herein, you must cite REINZ as the source of the information. REINZ reserves the right to request
that you immediately withdraw from publication any document that fails to cite REINZ as the source.
You can also read