Regional Drought Monitoring and Outlook System - Servir ...
←
→
Page content transcription
If your browser does not render page correctly, please read the page content below
Regional Drought
                                                                                           Monitoring and
                                                                                           Outlook System
                                                                                           Seasonal outlook
                                                                                           December 2020–March 2021

Background                                                                                 System Model - sub-seasonal to seasonal (GEOS-S2S)
                                                                                           forecasts, downscaled using the National Center for
The Regional Drought Monitoring and Outlook System                                         Atmospheric Research (NCAR) General Analog Regression
(RDMOS) is an operational service which produces reliable                                  Downscaling (GARD) tool and quantile mapping, are then
drought indicators for the Hindu Kush Himalayan (HKH)                                      applied to drive 5-km resolution hydrological forecasts to a
region with a specific focus on Afghanistan, Bangladesh,                                   9-month forecast time horizon.
Nepal, and Pakistan. The system incorporates climatic
models with suitable Earth observation data and land                                       A web-based graphical user interface provides a user-
surface models to produce drought indices – precipitation,                                 friendly means to analyse drought indices across river
temperature, soil moisture, and evapotranspiration – and                                   basins, national administrative boundaries, or a pre-defined
vegetation conditions at 10-day intervals for near real-                                   area of interest and to aggregate results along cropping
time monitoring of droughts. The RDMOS also provides                                       seasons. This capability has been in operation since April
seasonal outlooks at four-month intervals to support                                       2019 and has provided reliable outlooks of emerging
drought management and preparedness processes.                                             seasonal water availability scenarios for the region.

This system applies the Noah-MultiParameterization                                         The following brief presents seasonal anomaly maps1
(NoahMP) Land Surface Model (LSM) in the NASA                                              from December 2020 to March 2021 in major river basins
Land Information System (LIS), driven by downscaled                                        of the HKH region based on data generated by the
meteorological fields from the Global Data Assimilation                                    RDMOS. Long-term average conditions (climate normal)
System (GDAS) and Climate Hazards InfraRed 20                                              are also given for an overall understanding of precipitation
Precipitation products (CHIRP and CHIRPS) to optimize                                      and temperature patterns in the region. Read more about
initial conditions. The NASA Goddard Earth Observing                                       the RDMOS here.

1
    Anomaly maps based on Z-score. The Z-score (anomaly) is a measure that reflects the departure from normal conditions in a particular month observed from 2001 to 2018.
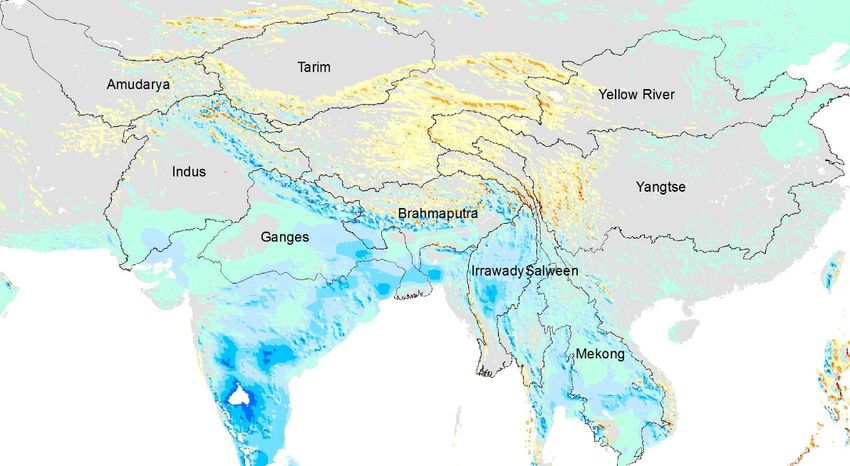
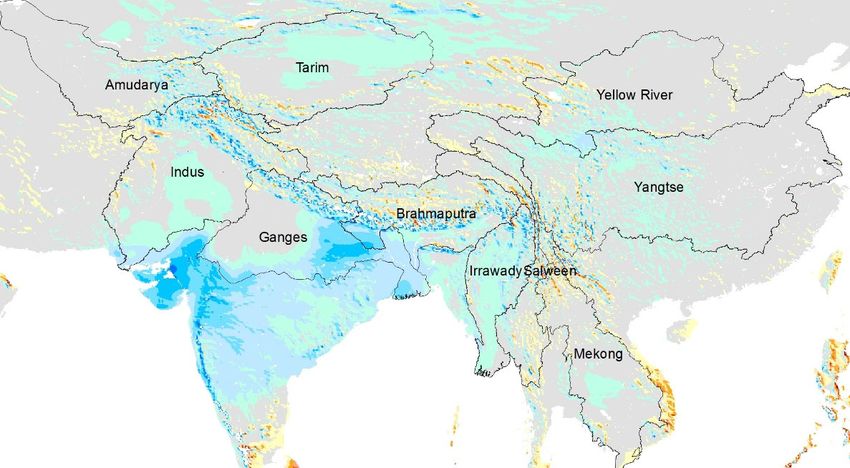
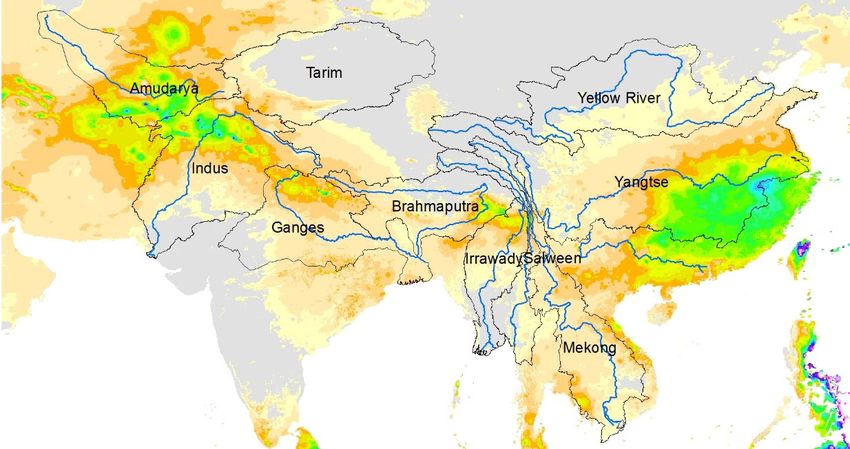
Precipitation outlook for December Monthly breakdown
2020–March 2021 The month of December exhibits deficit in the parts of the
The four-month precipitation outlook from December Amu Darya basin and the Indus basin particularly lying in
2020 to March 2021 indicates that moderate-to-high water Afghanistan while slightly favourable conditions are visible
deficit will dominate the Indus, Amu Darya, and Tarim in the Salween and Mekong basins. All other basins are
basins, while moderate-to-high precipitation is expected in expected to have nearly normal conditions. In January, well
the Brahmaputra, Mekong, and Salween basins. All other above normal conditions are expected in the lower elevation
basins are expected to have nearly normal conditions. The of the southern regions while the rest of the areas are
stated weather patterns mainly originate from the La Niña expected to have conditions similar to those in December. In
conditions present over the tropical Pacific Ocean, which February, expansion in deficit regions is expected to increase
typically bring wetter-than-normal conditions over the in the Indus basin. March shows largely near-normal
eastern regions and cause a deficit in precipitation in the conditions except for slightly favourable conditions in the
western basins and northern mountain regions. Ganges and deficits in the Yangtse basin.
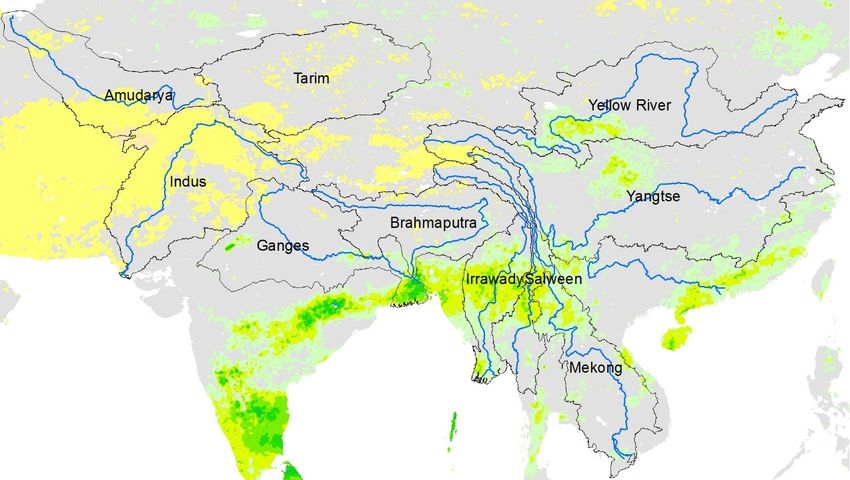
Rainfall outlook for December 2020 – March 2021
Precipitation
Rainfall
anomaly
anomaly
(Z
(Z Score)
Score)
4.5
4
3.5
Wet
3
Dec 2020 Jan 2021 2.5
2
1.5
1
Normal
0.5
‐0.5
‐1
‐1
Dry
‐1
‐2
Feb 2021 Mar 2021
Extremely
Extremelydry (3 ) wet (>3)
Average monthly rainfall from May to August based on observation during 2001–2018
PRECIPITATION OUTLOOK FOR DECEMBER 2020–MARCH 2021
Precipitation
Rainfall
(mm)
(mm)
Dec 2020 Jan 2021
Feb 2021 Mar 2021
AVERAGE MONTHLY PRECIPITATION FROM DECEMBER TO MARCH BASED ON OBSERVATION DURING 2001–2018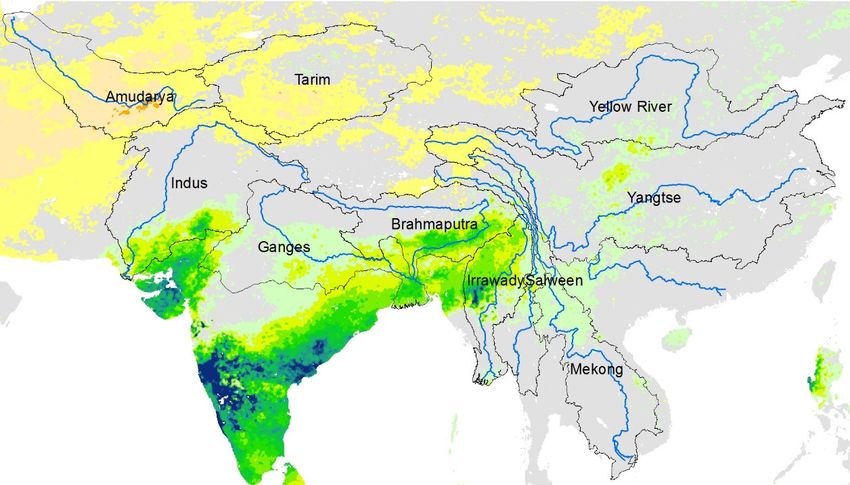
Impact on agriculture                                                     Temperature outlook for December
A continued precipitation deficit during the entire winter                2020–March 2021
period in the Amu Darya basin and upper Indus basin                       As shown in the temperature anomaly map above,
covering most of Afghanistan may result in a reduction                    most areas are expected to remain under cooler-than-
in wheat crop cultivation, particularly in rain-fed                       normal temperatures except in the Tibetan region.
areas. A decrease in rangeland productivity leading to                    Only small warm anomalies are expected in parts of
deterioration in livestock health is also likely. Similar                 the Indus and Ganges basins in January. A prolonged
impacts are expected in the western regions of Pakistan,                  winter season is expected as March is showing widespread
particularly in Balochistan Province, where livestock                     cooler temperatures in most areas except in the Tibetan
rearing on rangelands is an important source                              region.
of livelihood.

    Temperature outlook for December 2020 – March 2021

                                                                                                                   Temperature
                                                                                                                    Temperature
                                                                                                                    anomaly
                                                                                                                      anomaly
                                                                                                                    (Z(ZScore)
                                                                                                                         Score)

                                                                                                                                  Warmer
                                                                                                                                  Normal
   Dec 2020                                                    Jan 2021

                                                                                                                                   Cooler
   FebAverage
       2021   mean monthly temperature from May toMar 2021
                                                   August
   TEMPERATURE OUTLOOK FOR DECEMBER 2020–MARCH 2021
     based on observation during 2001–2018

                                                                                                                     Temp. (oC)
                                                                                                                     Temp. (°C)

   Dec 2020                                                    Jan 2021

   Feb 2021                                                    Mar 2021
   AVERAGE MEAN MONTHLY TEMPERATURE FROM DECEMBER TO MARCH BASED ON OBSERVATION DURING 2001–2018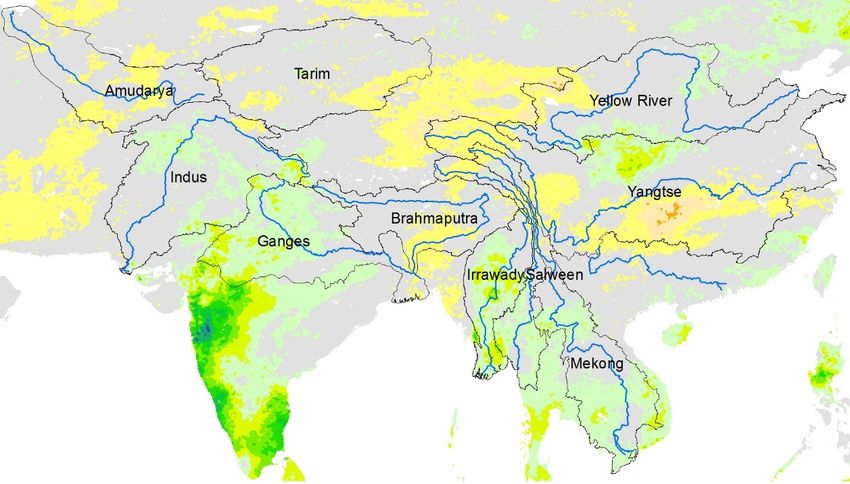
SYSTEM DESIGN WORKSHOP ON DROUGHT MONITORING SYSTEM FOR AFGHANISTAN AT THE MINISTRY OF AGRICULTURE, IRRIGATION AND LIVESTOCK IN KABUL, AFGHANISTAN

Visualization of drought outlook at the                                           The system has been further customized to generate
                                                                                  drought outlook at the provincial level for Afghanistan,
sub-basin level
                                                                                  Bangladesh, Nepal, and Pakistan and can be directly
Users can interact with the RDMOS to view and download                            accessed from the following URLs:
different snapshots; the map control element in the web-                          National Agricultural Drought Watch – Afghanistan:
based interface allows users to select different sub-basins,                      http://drought.spatialapps.net/apps/dmlocal/
indices, periodicity, and filter forecast ensemble via drop-                      outlook/?c=Afghanistan
down menus. The map/visualization and corresponding
graph are updated as per the selected variables.                                  National Agricultural Drought Watch – Bangladesh
The system can be accessed from                                                   http://drought.spatialapps.net/apps/dmlocal/
http://tethys.icimod.org/apps/regionaldrought/                                    outlook/?c=Bangladesh
                                                                                  National Agricultural Drought Watch – Nepal:
                                                                                  http://drought.spatialapps.net/apps/dmlocal/
                                                                                  outlook/?c=Nepal
                                                                                  National Agricultural Drought Watch – Pakistan
                                                                                  http://drought.spatialapps.net/apps/dmlocal/
                                                                                  outlook/?c=Pakistan

        3    Select period
        2    Select monitoring indicator
                                                                  7   Time series map visualization/animation
        1    Select basin (sub-basin)
               Regional Drought Monitoring and Outlook System

                                                    Boxplot shows monthly anomalies of selected indicator
        4    Select forecast ensemble             5 (soil moisture) from 6 different ensembles and their mean          6 Export chart data

VISUALIZATION OF DROUGHT OUTLOOK AT THE SUB-BASIN LEVEL FOR THE KOSHI SUB BASIN
http://tethys.icimod.org/apps/regionaldrought/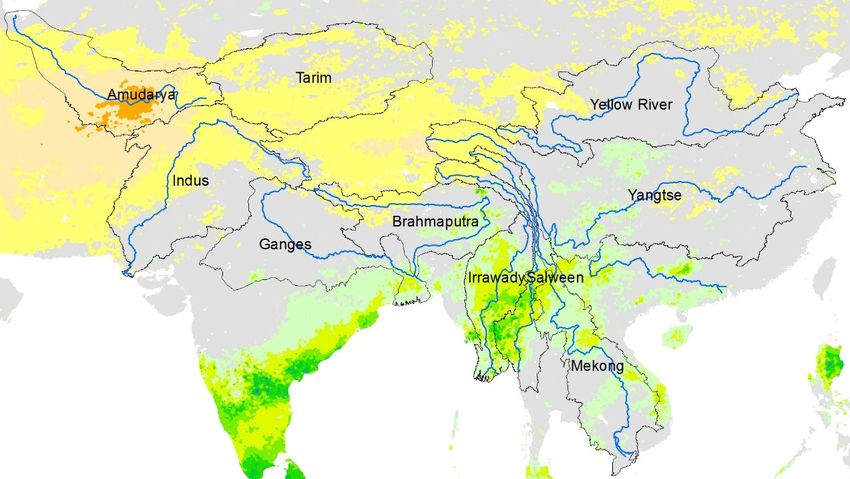
3    Select forecast ensemble
        2    Select district
                                                               6   Time series map visualization/animation                 5 Export chart data
        1    Select province
               National Agricultural Drought Watch – Nepal

                                                                                 Boxplots show monthly anomalies for four indicators from
                                                                            4
                                                                                 6 different ensembles and their mean
VISUALIZATION OF DROUGHT OUTLOOK AT THE DISTRICT LEVEL FOR PROVINCE 2 IN NEPAL
http://drought.spatialapps.net/apps/dmlocal/outlook/?c=Nepal

Disclaimer                                                                       fitness for a particular purpose of any of the materials. In
                                                                                 no event shall ICIMOD be liable for any loss or damages
This information is provided by ICIMOD “as is”. ICIMOD                           of any nature, including special, indirect, punitive, or
makes every effort to ensure, but makes no warranties –                          consequential damages, arising in connection with the
either express or implied – as to the accuracy, reliability,                     access, use, or reliance on any of the materials. Visit our
timeliness, non-infringement, merchantability, and                               website for the complete terms of use.

Acknowledgements
Development of the Regional Drought Monitoring and Outlook System was supported by the United States Agency for International Development
(USAID) and the National Aeronautics and Space Administration (NASA) under the SERVIR programme. John Hopkins University, the Climate
Services for Resilient Development (CSRD) Initiative, and the International Maize and Wheat Improvement Center (CIMMYT) collaborated on the
development of the system.

About SERVIR
SERVIR connects space to village by helping developing countries use satellite data to address challenges in food security, water resources, weather
and climate, land use, and natural disasters. A partnership of NASA, USAID, and leading technical organizations, SERVIR develops innovative
solutions to improve livelihoods and foster self-reliance in Asia, Africa, and the Americas.

ICIMOD implements the SERVIR Hindu Kush Himalaya (SERVIR-HKH) Initiative – one of five regional hubs of the SERVIR network – in its regional
member countries, prioritizing activities in Afghanistan, Bangladesh, Myanmar, Nepal, and Pakistan. For more, visit servir.icimod.org

For further information
Birendra Bajracharya servirhkh@icimod.org
			servir.icimod.org | geoportal.icimod.org

ICIMOD gratefully acknowledges the support of its core donors: the Governments of Afghanistan, Australia, Austria,
Bangladesh, Bhutan, China, India, Myanmar, Nepal, Norway, Pakistan, Sweden, and Switzerland.
© ICIMOD 2020                                                              International Centre for Integrated Mountain Development
                                                                           www.icimod.org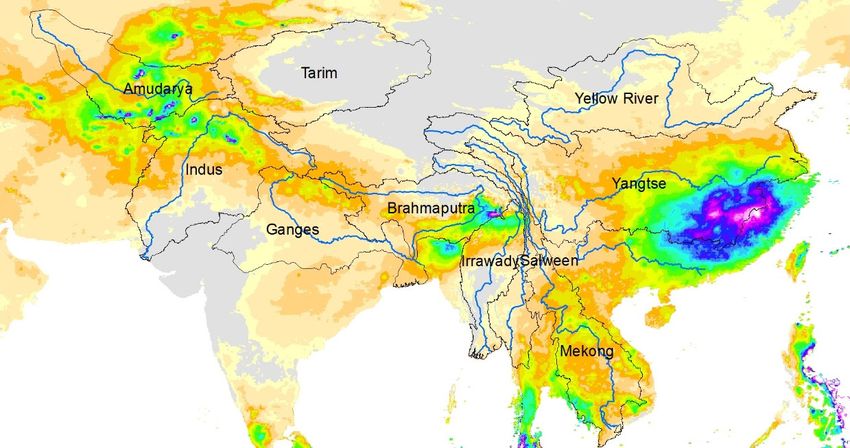
You can also read


