RAZER INC.
INVESTOR PRESENTATION | FY2021 EARNINGS
←
→
Page content transcription
If your browser does not render page correctly, please read the page content below

RAZER INC. INVESTOR PRESENTATION | FY2021 EARNINGS

AGENDA
   1          FY2021 HIGHLIGHT

            Min-Liang Tan – Co-founder and CEO

   2          FY2021 FINANCIAL PERFORMANCE

            Chong Neng Tan – CFO

  3           #GoGreenWithRazer

            Min-Liang Tan – Co-founder and CEO

  4           OUTLOOK

            Min-Liang Tan – Co-founder and CEO

© 2022 RAZER INC. ALL RIGHTS RESERVED.           2
LEGAL DISCLAIMER
          Potential investors and shareholders (the “Potential Investors and Shareholders”) of Razer Inc. (the “Company”) are reminded that information contained in
          this Presentation comprises extracts of operational data and financial information of the Company and its subsidiaries (the “Group”) for the year ended 31
          December 2021 (“FY2021”).

          The information included is solely for the use in this Presentation and certain information has not been independently verified. This Presentation has been
          prepared for informational use only and has not been prepared for the sale or solicitation in securities of the Company. No representations or warranties,
          expressed or implied, are made as to, and no reliance should be placed on, the fairness, accuracy, completeness or correctness of the information or opinions
          presented or contained in this Presentation. Potential Investors and Shareholders should refer to the FY2021 results announcement for the results of the
          Company which are published in accordance with the Rules Governing the Listing of Securities on The Stock Exchange of Hong Kong Limited.

          The performance and the results of operations of the Group contained within this Presentation are historical in nature, and past performance is no guarantee
          of the future results of the Group. Any forward-looking statements and opinions contained within this Presentation are based on current assumptions, plans,
          estimates and projections, which are subject to change and which involve risks and uncertainties. Actual results may differ materially from expectations
          discussed in such forward-looking statements and opinions. The Group, the directors, employees and agents of the Group assume (a) no obligation to correct
          or update the forward-looking statements or opinions contained in this Presentation; and (b) no liability in the event that any of the forward-looking
          statements or opinions do not materialize or turn out to be incorrect.

          Potential Investors and Shareholders should exercise caution when investing in or dealing in the securities of the Company.

          While no price-sensitive information has been included in this Presentation, Potential Investors and Shareholders are reminded not to deal, or cause a third
          party to deal, in any securities of the Company if they are in possession of such information.

© 2022 RAZER INC. ALL RIGHTS RESERVED.                                                                                                                                    3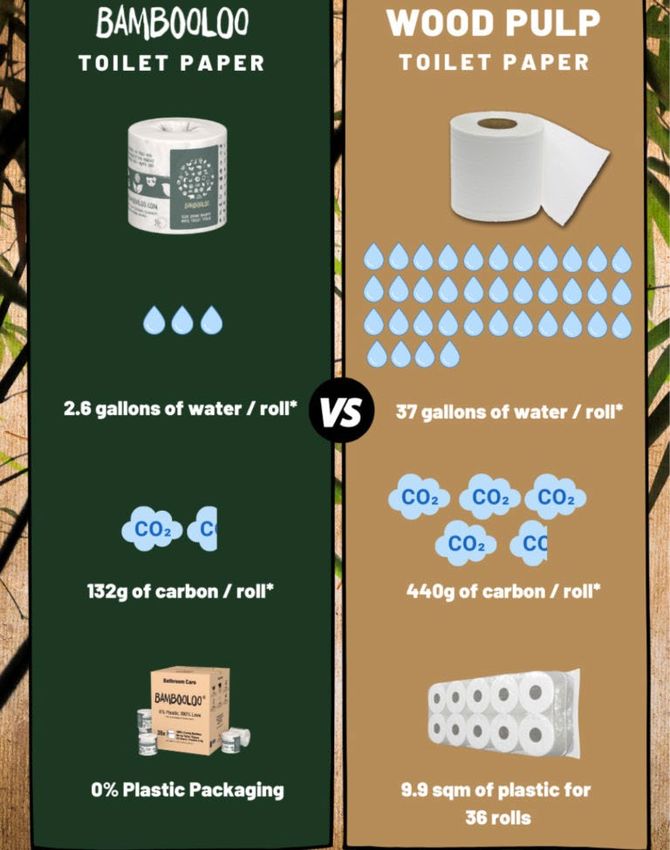
FY2021 HIGHLIGHT

© 2022 RAZER INC. ALL RIGHTS RESERVED.                      4
FY2021: KEY HIGHLIGHT
          Revenue of US$1.6B with 33.3% YoY growth, driven by demand in 1H 2021 due to the
          pandemic, market share increase for the Hardware business, and continued expansion of
          channels and content for the Services business

          Gross profit margin improved to 24.0%, as compared to 22.3% in the prior year period,
          driven by ongoing expansion of Hardware margins, partially offset by higher freight rates
          due to industry-wide supply chain and logistics challenges

          Adjusted Non-GAAP EBITDA* of US$96.1M, an increase from US$44.6M in the prior year
          period of 2020

          Net Profit of US$43.4M, compared to US$0.8M in the prior year period, driven by revenue
          growth, ongoing gross margin expansion and productivity improvement

          * We define adjusted EBITDA as profit/(loss) from operations added back with depreciation and amortisation, share-based compensation expense, restructuring expense, impairment of long-lived assets and
          merger and acquisitions expense.

© 2022 RAZER INC. ALL RIGHTS RESERVED.                                                                                                                                                                               5
THE RAZER ECOSYSTEM:
                       AND HOW IT GREW IN FY2021

© 2022 RAZER INC. ALL RIGHTS RESERVED.             6
THE WORLD’S LARGEST INTEGRATED GAMER ECOSYSTEM
                   ONE OF THE WORLD’S LARGEST
                   GAMER SOFTWARE PLATFORMS           ~178M  TOTAL
                                                             USERS
                   Enhance user experience via access
                   to integrated gamer platform        44.1% YoY
                                                             GROWTH

                        LEADING BRAND1 IN                                 PAYMENT SERVICES FOR GAMERS,
                        GAMING HARDWARE                                   YOUTH, MILLENNIALS AND GEN Z

      Leading Brand for Gaming                                Monetization for games and digital payments
      Peripherals and Premium Gaming                          enablement
      Laptops

      US$1,452.4M                                             US$162.5M
       IN FY2021                                              IN FY2021

      34.0% YoY
            GROWTH                                            26.6% YoY
                                                                    GROWTH

          1   Internal sources and external market research

© 2022 RAZER INC. ALL RIGHTS RESERVED.                                                                      7
THE RAZER ECOSYSTEM:
                                          HARDWARE

© 2022 RAZER INC. ALL RIGHTS RESERVED.                      8
34.0% YOY GROWTH IN HARDWARE REVENUE
                                             NET REVENUE

          (US$ M)

                                          CAGR
                                         +32.0%

© 2022 RAZER INC. ALL RIGHTS RESERVED.                     9
THE RAZER ECOSYSTEM:
                                          SOFTWARE

© 2022 RAZER INC. ALL RIGHTS RESERVED.                      10
44.1% YOY GROWTH IN SOFTWARE TOTAL USERS
DRIVEN BY INCREASED GAMING AND LIVESTREAMING ACTIVITIES
TOTAL USERS
CAGR ~178M
MAU
+41.5%
~123M +30.0%
YoY
~80M FY2021
~60M
~40M
Dec-17 Dec-18 Dec-19 Dec-20 Dec-21
© 2022 RAZER INC. ALL RIGHTS RESERVED. 11THE RAZER ECOSYSTEM:
SERVICES
© 2022 RAZER INC. ALL RIGHTS RESERVED. 1226.6% YOY GROWTH IN SERVICES REVENUE
DRIVEN BY RAZER GOLD USAGE AND RAZER FINTECH B2B ACTIVITY
SERVICES NET REVENUE
(US$ M)
CAGR GPM
+97.9%
38.5%
FY2021
© 2022 RAZER INC. ALL RIGHTS RESERVED. 13FY2021
FINANCIAL PERFORMANCE
© 2022 RAZER INC. ALL RIGHTS RESERVED. 14NET REVENUE
REVENUE BY SEGMENT
(US$ M)
+33.3%
YoY
* Hardware includes Peripherals and Systems
© 2022 RAZER INC. ALL RIGHTS RESERVED. 15GROSS PROFIT
GROSS PROFIT
(US$ M)
GPM
24.0%
GPM
22.3%
GPM
20.5%
FY2021 GPM improvement:
• Driven by ongoing expansion of Hardware margins
• Partially offset by sudden spikes in freight rates and other supply chain disruption issues
© 2022 RAZER INC. ALL RIGHTS RESERVED. 16OPERATING EXPENSES
OPERATING EXPENSES
(US$ M)
© 2022 RAZER INC. ALL RIGHTS RESERVED. 17P&L HIGHLIGHTS
• Revenue +33.3% to US$1.6B, driven by
(US$ M) FY2020 FY2021 Change demand in 1H 2021 due to the pandemic,
market share increase for the Hardware
Revenue 1,214.6 1,619.6 33.3% business, and continued expansion of
Gross profit 271.0 389.2 43.6%
channels and content for the Services
business
% of revenue 22.3% 24.0% 170bps
• Gross margin increased 170bps driven by
Operating expenses 278.0 337.3 21.3% ongoing expansion of Hardware margins,
% of revenue 22.9% 20.8% (210bps)
partially offset by higher freight rates due to
industry-wide supply chain and logistics
Adjusted Non-GAAP EBITDA* 44.6 96.1 115.5%
challenges
% of revenue 3.7% 5.9% 220bps • Net profit of US$43.4M, driven by revenue
Profit for the year 0.8 43.4 5,289.9% growth, ongoing gross margin expansion and
productivity improvement
% of revenue 0.1% 2.7% 260bps
* We define adjusted EBITDA as profit/(loss) from operations added back with depreciation and amortisation, share-based compensation expense, restructuring expense, impairment of long-lived assets and
merger and acquisitions expense.
© 2022 RAZER INC. ALL RIGHTS RESERVED. 18WORKING CAPITAL AND CASH CONVERSION CYCLE
WORKING CAPITAL CYCLE
(Days)
DAYS INVENTORY OUTSTANDING1 DAYS SALES OUTSTANDING2
69
46 57 51
40 39
Dec-19 Dec-20 Dec-21 Dec-19 Dec-20 Dec-21
DAYS PAYABLES OUTSTANDING3 CASH CONVERSION CYCLE 4
164
154
141 (44)
(55) (58)
Dec-19 Dec-20 Dec-21 Dec-19 Dec-20 Dec-21
Notes: 1 Days inventory outstanding equals the average of the opening and closing inventory balances divided by the cost of sales for the period and multiplied by the number of days in the period.
2 Days sales outstanding equals the average of trade receivables divided by the total revenue for the period and multiplied by the number of days in the period.
3 Days payables outstanding equals the average of payables divided by the total cost of sales for the period and multiplied by the number of days in the period.
4 Cash conversion cycle for a period equals days inventory outstanding plus days sales outstanding less days payables outstanding.
© 2022 RAZER INC. ALL RIGHTS RESERVED. 19UPDATES ON
GO GREEN WITH RAZER
OUR QUEST CONTINUES TO BUILD A SUSTAINABLE FUTURE
FOR GENERATIONS TO COME
© 2022 RAZER INC. ALL RIGHTS RESERVED. 2010-YEAR GREEN ROADMAP
RAZER IS COMMITTING TO A SUSTAINABILITY ROADMAP
SUPPORTED BY OUR FOUR STRATEGIC PILLARS
GREEN GREEN GREEN GREEN
ORGANIZATION PRODUCTS COMMUNITY INVESTMENTS
Change starts with ourselves. As part Turning our forte in Razer pledges to leverage Razer is committed towards a
of Razer’s Green Organization designing products that on both our staff and the sustainable future, and aims to
initiatives, we are focusing on making are both phenomenal to community to contribute play its part by supporting and
our offices a greener place, and on our fans and responsible and support the global investing in environment and
reducing our global carbon footprint to the environment green movement sustainability startups
© 2022 RAZER INC. ALL RIGHTS RESERVED. 21GREEN ORGANIZATION
ADOPTED GRI CORE JOINED SCIENCE BASED
STANDARDS TARGET INITIATIVE
We upgraded our upcoming We have committed to the Science
sustainability report to adopt GRI Based Targets initiative to keep the
Core standards – one of the global temperature increments to less
world's leading sustainability than 1.5 degree Celsius in order to
reporting standards. achieve net carbon neutrality by 2030.
INAUGURAL DISCLOSURE INCLUSION OF CLIMATE-
UNDER CDP RELATED RISKS IN ERM
We made our first disclosure under the We included climate-related risks in
Carbon Disclosure Project (CDP), our enterprise risk management
ensuring transparency through the process (ERM) by proactively
disclosure of environment data. recognizing and mitigating potential
impact from climate-related risks.
© 2022 RAZER INC. ALL RIGHTS RESERVED. 22GREEN PRODUCTS
PARTNERSHIP WITH UL
Kickstarted an industry level effort on identifying key indicators of environmental impact
that should be measured by all manufacturers for gaming products
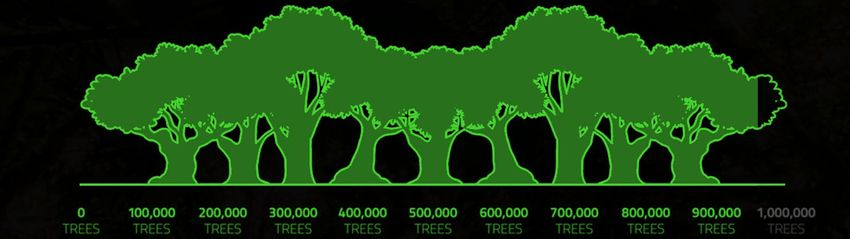
© 2022 RAZER INC. ALL RIGHTS RESERVED. 23GREEN COMMUNITY
MORE THAN
900,000 TREES
SAVED
X
© 2022 RAZER INC. ALL RIGHTS RESERVED. 24GREEN INVESTMENTS
BAMBOOLOO
First Investment of Razer Green Fund
© 2022 RAZER INC. ALL RIGHTS RESERVED. 25OUTLOOK © 2022 RAZER INC. ALL RIGHTS RESERVED. 26
OUTLOOK

                                         MACRO CHALLENGES AND UNCERTAINTIES:
                                         • Impact of industry-wide supply chain challenges on business will persist
                                         • Freight and logistics expected to remain a challenge through the year
                                         • Deceleration in growth momentum since 2H2021 to continue through 2022 due to high
                                           base effect

                                         NEW GROWTH AREAS:
                                         • Extension of Hardware offerings to furniture and other gamer lifestyle categories
                                         • Continued regional expansion for Razer Gold
                                         • Scaling of TPV and geographical expansion for Razer Fintech

                                         IMPACT ON BUSINESS PERFORMANCE:
                                         • Additional spending in operating expenses
                                         • New growth areas will require significant investments
                                         • New growth areas will take time to prove out business case

© 2022 RAZER INC. ALL RIGHTS RESERVED.                                                                                         27
APPENDIX © 2022 RAZER INC. ALL RIGHTS RESERVED. 28
KEY P&L DATA

         (US$ M)                                                                                  FY2018                   FY2019                    FY2020       FY2021

         Revenue                                                                                   712.4                     820.8                    1,214.6     1,619.6

         Gross Profit                                                                               170.1                     168.1                    271.0      389.2

         Operating Expenses                                                                       (269.7)                   (263.9)                   (278.0)     (337.3)

         Profit / (Loss) for the year                                                               (97.9)                    (83.5)                      0.8      43.4

         Adjusted Non-GAAP EBITDA*                                                                  (46.9)                    (29.4)                    44.6       96.1

            *Adjusted items exclude share-based compensation, restructuring expense, merger and acquisition expense and impairment of goodwill and other assets

© 2022 RAZER INC. ALL RIGHTS RESERVED.                                                                                                                                      29
KEY BALANCE SHEET DATA
(US$ M) Dec 2018 Dec 2019 Dec 2020 Dec 2021
Cash and bank balance 615.2 528.3 621.8 567.6
Debts 0.0 0.0 0.0 0.0
Net Cash 615.2 528.3 621.8 567.6
Inventories 68.5 74.8 124.9 186.4
Trade Receivables 144.9 158.4 223.4 233.3
Trade Payables 269.6 301.3 469.8 454.4
Net Working Capital (56.2) (68.1) (121.6) (34.7)
© 2022 RAZER INC. ALL RIGHTS RESERVED. 30You can also read


