Q3 2021 result - 29 October 2021 - Henri de Sauvage-Nolting, President/CEO Frans Rydén, CFO Nathalie Redmo, IR - Cloetta
←
→
Page content transcription
If your browser does not render page correctly, please read the page content below
Q3 2021 result – 29 October 2021

 Henri de Sauvage-Nolting, President/CEO
            Frans Rydén, CFO
            Nathalie Redmo, IR
Key messages Q3 2021
• Sales of Branded packaged products at highest Q3 levels ever

• Continued recovery of Pick & mix volumes; profitability back to pre-pandemic level

• Strong sales momentum allowed marketing spend in line with 2019 level

• Largest CandyKing media campaign ever rolled out across Scandinavia

• SBTi submission; reducing absolute greenhouse gas emissions by 46% by 2030

• Migration of ERP system to the cloud; savings and enhanced functionality

• Net debt/EBITDA below targeted 2.5x and net debt levels at an all-time low

• Pricing and other actions to mitigate surging input costs and supply chain challenges

     ”Continued strong growth and improved profitability.”
Agenda

         1. Sales results

         2. Financials

         3. Strategic update

         4. Q&A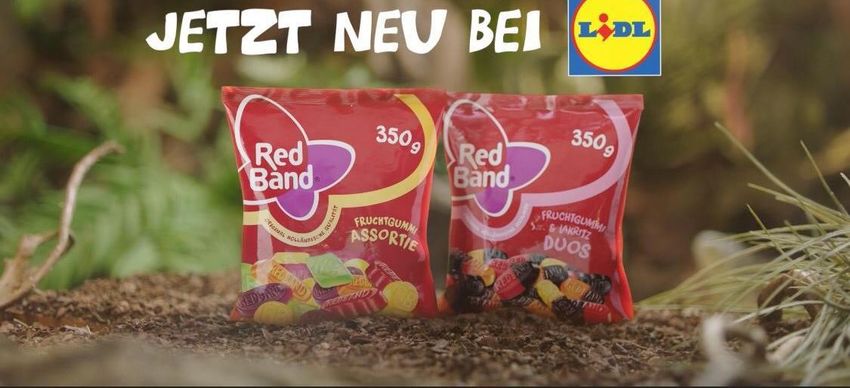
Q3 2021: Strong growth across both segments
         Total                   Branded packaged                   Pick & mix
  Organic sales growth           Organic sales growth           Organic sales growth

         +7,5%                          +4,0%                         +21,6%
       Jul:   -   0,7%                Jul:   - 4,1%                  Jul:   + 12,3%
       Aug: + 12,6%                   Aug: + 9,3%                    Aug: + 26,2%
       Sep: + 10,2%                   Sep: + 6,3%                    Sep: + 26,3%

  Monthly organic sales growth   Monthly organic sales growth   Monthly organic sales growth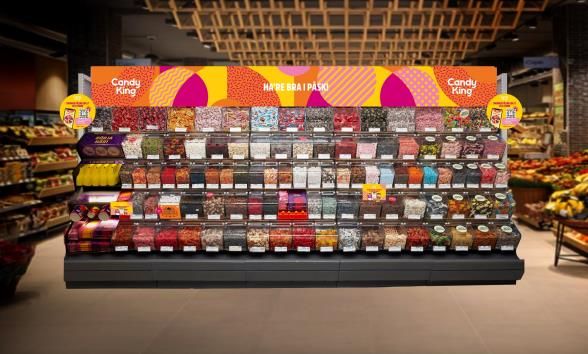
Increased mobility across markets
Q3 Google Covid-19 Mobility Report; retail sees uplift, work and transit stations still low traffic
  Sweden                   Finland                Netherlands                      UK
Retail & recreation      Retail & recreation      Retail & recreation      Retail & recreation            Retail &
                                                                                                         recreation             Significant improved mobility with some
                                                                                                                                 countries for the first time favourable.
     + 6%                     + 5%                     + 4%                     - 9%                                              Summer leisure parks and cinemas
  Compared to baseline     Compared to baseline     Compared to baseline     Compared to baseline                                opening, high street shopping rising.

 Transit stations         Transit stations         Transit stations         Transit stations               Transit
                                                                                                           stations                Mobility still down but significantly
                                                                                                                                improved compared to last year, when it
    - 24%                    - 25%                    - 24%                    - 28%                                               was down around 40-60%. People
  Compared to baseline     Compared to baseline     Compared to baseline     Compared to baseline                               travelling less public transport than prior
                                                                                                                                             to the pandemic.

   Workplaces               Workplaces               Workplaces                Workplaces               Workplaces                Return to work lagging other mobility
                                                                                                                                  measures, being largely unchanged
    - 26%                    - 23%                    - 22%                    - 28%                                                compared to previous quarters.
  Compared to baseline     Compared to baseline     Compared to baseline     Compared to baseline

  Source: Google COVID-19 Community Mobility Reports. % compared to baseline, which is the median value from the 5-week period Jan 3 – Feb 6, 2020.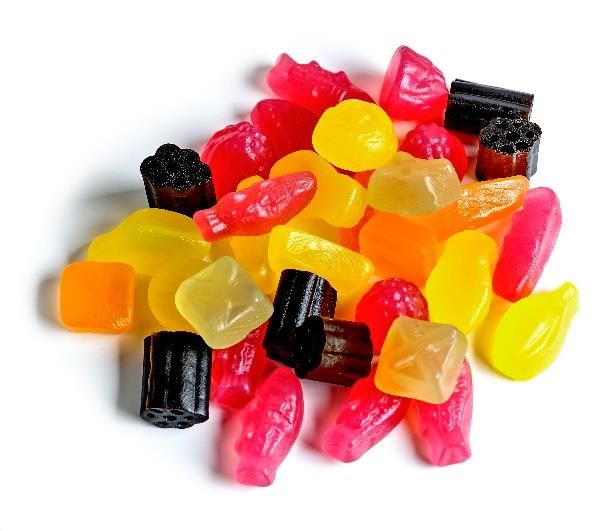
Branded packaged
2020 branded sales by channel*                                     Confectionery category trends
                                                                   •   Traffic increasing in other channels, including travel
                                                                       retail, kiosks, petrol
                25%                               Food             •   Pastilles and gums still below 2020 levels
               (30%)
                                                  Other channels
                                                                   •   Candy bags and chocolate above 2020 levels, despite
                           75%                                         tough comps and Pick & mix recovery
                           (70%)

                                                                   Actions
                                                                   ✓ Keep focus on strengthening top 25 brand positions
  Last 3 months market data**
                                                                         ▪ Clarity on all brand positionings
     PASTILLES & GUMS                         -2%
                                                                         ▪ Building stronger marketing capabilities

     CANDYBAGS                                +1%                        ▪ Increasing share of working media
                                                                   ✓ Support strategic launches like Real Fruit
 * Approximate % based on 2020 (2019) full year figures
 **Nielsen, Kesko, SOK market data, Q3, 2021. Candybags
 and pastilles; FI, DK, NO, SWE. Gums; FI.
                                                                   ✓ Penetration program for pastilles and gum brands
Pick & mix
     Channels   Consumer     Consumer   Pick & mix category trends
                activation    demand
                                        •   All channels open, including the UK
    Q1 Q2 Q3    Q1 Q2 Q3     Q1 Q2 Q3
                                        •   Growing consumer confidence (vs 2020, but
                                            below 2019), in base sales
                                        •   Slow progress of consumer price promotions
                                            across markets

                                        Actions for sustainable value growth
                                        ✓ Premium CandyKing 2.0 concept live in all markets
                                        ✓ CandyKing Premium mix Finland showing great
                                          sales and shopper results
                                        ✓ Largest CandyKing media campaign ever launched
                                        ✓ Efficiency program delivering
Agenda

         1. Sales results

         2. Financials

         3. Strategic update

         4. Q&A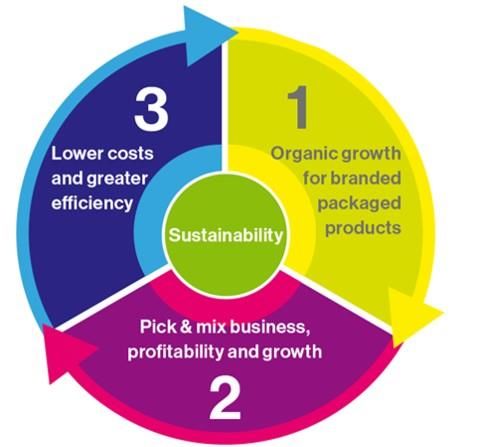
Net Sales
Branded packaged sales above pre-pandemic levels and steady volume recovery for Pick & mix

                 Third quarter                                   9 months

                                                                      +3,7%
                        +6,2%
                                                             +6,5%            -2,8%
               +7,5%            -1,3%
                                        1 566                                           4 384

                                                   4 229

    1 474

            Branded packaged: + 4,0%                        Branded packaged: + 4,5%
            Pick & mix:       + 21,6%                       Pick & mix:       + 13,8%

    2020      Organic            FX     2021       2020     Organic            FX       2021
              growth                                        growth
Sales development
 Branded, % of Q3 '21 sales

                                                                                                                 7.3%
                                                  3.6%     3.6%                                                           4.0%
                                         1.4%                                         1.7%              2.5%                       Jul:   - 4,1%
                                0.6%
                                                                                                                                   Aug: + 9,3%
                                                                    -2.5%                      -3.6%                               Sep: + 6,3%
        77%                                                                  -6.3%

                                Q1 ’19   Q2 ’19   Q3 ’19   Q4 ’19   Q1 ’20   Q2 ’20   Q3 ’20   Q4 ’20   Q1 ’21   Q2 ’21   Q3 ’21

Pick & mix, % of Q3 '21 sales                                                                                    79.6%

                23%                                                                                                       21.6%
                                         18.1%
                                                  6.4%                                                                             Jul:   + 12,3%
                                                           0.0%
                                                                                                                                   Aug: + 26,2%
                                -11.4%                              -8.0%                                                          Sep: + 26,3%
                                                                                                        -22.9%
                                                                                      -31.4%   -35.9%

                                                                             -58.5%
Operating profit, adjusted
Volume-driven gross profit brings quarter above 12% and YTD to double-digit
• Profit increase driven by Operating profit, adjusted
volume and margin-enhancing
initiatives, totaling SEK 49m. Third quarter 9 months
8,8% 12,1% 9,3% 10,1%
• Increase in costs primarily due to
last year’s release of incentive 49
-29 5 190
82
-45 12 441
programs as marketing spend kept 392
35
in line with pre-pandemic level. 130
• Phasing of SEK 35m in supply
chain cost from Q2 to Q3 in 2020
shown separately in bridge.
2020 2020 Vol./Mix Costs FX 2021 2020 Vol./Mix Costs FX 2021
phasingQ3 Operating profit, adjusted by segment
Branded profit at 15% and Pick & mix profit back to pre-pandemic level despite the lagging volume
Branded packaged
13,1% 15,0%
• Branded profit remains above 14% EBIT 3 181
154 24
despite continued unfavorable mix due to
lower sales of pastilles and gum.
• Branded underlying profit stable despite
last year’s release of incentive programs as 2020 2020 phasing var. 2021
marketing spend kept in line with pre-
pandemic level. Pick & Mix
-8,1% 2,5%
9
• Volume recovery and continued margin-
enhancing initiatives bring Pick & mix profit 22
back to pre-pandemic level.
11
-24
2020 2020 phasing var. 2021SG&A
SG&A up due to incentive program release in 2020, partly offset by items affecting comparability and FX
Third quarter 9 months
23,5% 23,1% 25,8% 25,3%
-15 -15
9
45
23 -47 -86
26
-347
-1 093
-362 -1 108
2020 Items FX Net SG&A 2021 2020 Items FX Net SG&A 2021
affecting affecting
comparability comparabilityCash flow
Healthy free cash flow driven by operating profit and working capital
Q3 ‘21
-52 238 -1 -16
81 221
209
• Operating result main driver of positive
free cash flow.
• Working capital in prior year driven by
reduction of finished goods after Q2
build-up. New European UTP legislation
not yet affecting cash flows.
• Investments in PP&E and intangibles
Q3 ‘20
lower following the completion of the -61 252 0 -19
new drying chambers. 151
233
162Strong financial position
Net debt/EBITDA below targeted 2,5x first time since pandemic start and Net debt at all-time low
2 321
1 865
505
• Unutilized access to cash of
Cash
2 071
SEK 1,9 billion.
Non-current facilities
610 Non-current facilities
750
• Net debt below SEK 2,0
Commercial papers
250 Commercial papers billion; lowest since 2012.
Utilized Unutilized
4.5 6 000
• Continued compliance with
Covenant 4.0
5 000 covenant of 4,0x and again
3.5 Net debt/EBITDA
3.0 4 000
below target of 2,5x.
Target 2.5
3 000
2.0
1.5 2 000
1.0
1 000
0.5 Net debt in SEKm
0.0 0
Q2 Q3 Q4 Q1 Q2 Q3 Q4 Q1 Q2 Q3 Q4 Q1 Q2 Q3 Q4 Q1 Q2 Q3
2017 2018 2019 2020 2021Change in Accounting for cloud solutions
Simplified example
• The IFRS Interpretations Committee
has concluded on the accounting for Impact financial Opening
reporting1 ‘20 ‘21 Q4 ‘21
balance ‘20
implementation costs related to cloud
computing arrangements. Intangible assets
Equity
• Cloetta is investigating to what extent
previously recognised assets are to Operating expenses
be retrospectively expensed and the
- Cost cloud solutions
related amortization charges are to
be reversed. - Amortisation
Operating profit
• The investigation is expected to
conclude in Q4 2021 with a negative Cash flow from operating
adjustment of the operating profit activities
not exceeding SEK 25m, to be Cash flow from investing
activities
distributed across the four quarters
of 2021. Total cash flow
1 Simplified example as no tax effects are taken into consideration.Agenda
1. Sales results
2. Financials
3. Strategic update
4. Q&ABranded growth
Increase in marketing visible to consumers
Accelerating strategic initiatives
Share of working media vs. non-working media
100%
90%
80%
70%
60%
50%
40%
30%
20%
10%
0%
2017 2018 2019 2020 2021 YTD
Working media Non-working mediaWe believe in the Power of True Joy
Opportunities for creating a positive impact within A Sweeter Future
OUR THREE PILLARS
Our business depends on the
We create joyful moments through We support our employees, our environment. We take responsibility for
our products. We aim to meet the suppliers and farmers, as well our impacts; from sourcing to
variety of consumer preferences. as our communities. packaging.
Natural flavours Living Income Science Based Targets
Q3 HIGHLIGHTS
• Nutisal launched three new • Progress made in our pilot • Submitting our suggested
flavour combinations using project with Rainforest Alliance to targets for validation to the
natural ingredients, for example improve how to close the living Science Based Targets initiative
maple syrup and sea salt, or income gap to cocoa farmers
smoky sriracha20
Scandic CandyKing 360 Halloween campaign
Cooperation with SF anytime around movie moment
ATL/OOH INSTORE
Striped city train
180 850
OOH at bus stops OOH close to stores
Main display 2nd placement display
10 Striped buses
Radio
TVC
Aftonbladet takeover
DIGITAL ACTIVATION PLATFORM
Large bag Medium bag
Website
Paid SoMe
Wobbler
HALLOWEEN CAMPAIGN 29 OKTOBER 2021Surging input costs and supply chain challenges Taking mitigating actions, including price increases starting to take effect beginning of next year Index Index includes key commodities used by Cloetta. Source; Mintec, EUWID, Kingsman.
Key business priorities
Prioritized activities for achieving organic growth and a 14% operating profit margin, adjusted

                                           •   Strong momentum from marketing and innovation initiatives
                                           •   Top 25 brands focus: marketing spend on pre-pandemic levels
                                   1       •
                                           •
                                               Focus on recovery for pastilles and gums categories
                                               Keep on developing marketing capabilities
                                           •   E-commerce growth

                                           •   Pick & mix strategy delivering sustainable value growth

                                   2       •
                                           •
                                               Recovering previously lost volumes and profitability
                                               Premium CandyKing implemented in all markets
                                           •   Largest CandyKing media campaign ever launched
                                           •   Voted “Supplier of the year” by biggest customer in Norway

                                           •   Perfect Factory and VIP+ cost Program continue to deliver
                                   3       •
                                           •
                                               ERP system to the cloud; savings and enhanced functionality
                                               Healthy free cash flow; net debt levels at an all-time low
                                           •   Actions to mitigate surging input costs and supply challenges
Agenda
1. Sales results
2. Financials
3. Strategic update
4. Q&AQ&A
Disclaimer

•   This presentation has been prepared by Cloetta AB (publ) (the “Company”) solely for use at this presentation and is furnished to you solely for your information and may
    not be reproduced or redistributed, in whole or in part, to any other person. The presentation does not constitute an invitation or offer to acquire, purchase or subscribe for
    securities. By attending the meeting where this presentation is made, or by reading the presentation slides, you agree to be bound by the following limitations.
•   This presentation is not for presentation or transmission into the United States or to any U.S. person, as that term is defined under Regulation S promulgated under the
    Securities Act of 1933, as amended.
•   This presentation contains various forward-looking statements that reflect management’s current views with respect to future events and financial and operational
    performance. The words “believe,” “expect,” “anticipate,” “intend,” “may,” “plan,” “estimate,” “should,” “could,” “aim,” “target,” “might,” or, in each case, their negative, or
    similar expressions identify certain of these forward-looking statements. Others can be identified from the context in which the statements are made. These forward-looking
    statements involve known and unknown risks, uncertainties and other factors, which are in some cases beyond the Company’s control and may cause actual results or
    performance to differ materially from those expressed or implied from such forward-looking statements. These risks include but are not limited to the Company’s ability to
    operate profitably, maintain its competitive position, to promote and improve its reputation and the awareness of the brands in its portfolio, to successfully operate its
    growth strategy and the impact of changes in pricing policies, political and regulatory developments in the markets in which the Company operates, and other risks.
•   The information and opinions contained in this document are provided as at the date of this presentation and are subject to change without notice.
•   No representation or warranty (expressed or implied) is made as to, and no reliance should be placed on, the fairness, accuracy or completeness of the information
    contained herein. Accordingly, none of the Company, or any of its principal shareholders or subsidiary undertakings or any of such person’s officers or employees accepts
    any liability whatsoever arising directly or indirectly from the use of this document.
You can also read