Capital Market Presentation Q3 2021 Daimler AG
←
→
Page content transcription
If your browser does not render page correctly, please read the page content below

Capital Market Presentation Q3 2021
             Daimler AG

Daimler AG
Daimler: Key messages

▸ Business development Q3: strongly influenced by supply constraints due to
  semiconductor shortage; resilience of business further improved

▸ Favorable development of Net Industrial Liquidity & Free Cash Flow supporting
  financial flexibility

▸ Strategy execution: ramp-up of EV portfolio in all divisions

▸ Project Focus: 99.90% of shareholders in favour of Daimler Truck spin-off and
  renaming of Daimler AG. First stock-exchange listing of Daimler Truck Holding AG
  planned by end of 2021

Daimler AG                                                                           2

Q3/Q4 Reporting Changes
              Group P&L (Financial Statements)1                                                                                            Segment P&L

                                    Q3/Q4/FY                                                                               Until Q3 2021 (unchanged)
    Continued     Mainly: Mercedes-Benz Cars & Vans,                                                 Mercedes-Benz                    Daimler                Daimler Trucks Reconciliation
  Operations (CO) Daimler Mobility², Reconciliation
                                                                                                      Cars & Vans                     Mobility                  & Buses

                             Presented as usual line item

   Discontinued Mainly: IB Daimler Trucks & Buses                                                                          Q4 2021 (expected structure)
  Operations (DO)                                                                                            Mercedes-Benz                          Daimler                     Reconciliation
                  Presented as separate single line item                                                      Cars & Vans                           Mobility³                      (incl. Daimler
                  ”Discontinued operations”, covering EBIT,                                                                                                                      Trucks & Buses)
                  interest and taxes
                                                                                                              Internal and external reporting of Q4 2021 changes to reflect Group structure post spin-off

1 InConsolidated Balance Sheet mainly IB Daimler Trucks and Buses business including DMO spin off is shown as assets/ liabilities held for distribution/ sale
² DMO incl. Trucks DMO
³ Scope changes over time, Trucks DMO Portfolio successively carved out or ramped down
Disclaimer: This page is for illustration purposes only. It shows schematically the upcoming structural changes within Daimler’s financial statements. More detailed information is provided in the interim report

 Daimler AG                                                                                                                                                                                                          3
Daimler: Key figures
                                                                                                   Free Cash           Net Industrial
     Sales                          Revenue                   EBIT            EBIT adj.
in thousand units                  in billion euros     in billion euros     in billion euros
                                                                                                    Flow (IB)            Liquidity
                                                                                                   in billion euros      in billion euros

                                  40.3         40.1                                               5.1
 773
                                   8.7         8.4                   3.6    3.5          3.6                                           23.5
                                                        3.1                              0.4                             17.9
               578                                                   0.7     0.6
        -25%                             -0%            0.6 +17%                   +4%                                          +31%
                                                                                                        -56%
                                                                                                               2.2

                                  31.6         31.7     2.5          2.9     2.9         3.2

Q3 2020       Q3 2021            Q3 2020    Q3 2021   Q3 2020    Q3 2021   Q3 2020    Q3 2021   Q3 2020    Q3 2021    12/31/2020 9/30/2021
       discontinued operations
       continued operations

 Daimler AG                                                                                                                                   4
Mercedes-Benz Cars & Vans: Highlights

▸     Strong demand for Mercedes-Benz products in all markets. Especially electric and
      high-end vehicles with high growth rates

▸     Sales significantly restricted by ongoing semiconductor shortage

▸     Favorable mix and net pricing offset semi-driven supply constraints and raw material
      headwinds

▸     Acquisition of 33%-equity stake in battery cell JV ACC

▸     Transfer of compact and mid-size transmissions activities to Magna

▸     EV ramp-up: Introduction of 4 new EV products and concepts at IAA underlines focus
      on luxury and tech

▸     Successful Digital World Premiere of new Citan and eCitan. Start of sales Sprinter 4x4
      and new battery variant for eVito Tourer

Daimler AG                                                                                     5
Mercedes-Benz Cars & Vans: Financials
       Sales           Revenue                 EBIT adj.            CFBIT adj.
 in thousand units    in billion euros        in billion euros     in billion euros

 673
                                                                   4.8
                      25.8          25.6                                        4.1
                                               2.4
               471
                                                            2.2

       -30%                  -1%                     -10%                -14%

Q3 2020    Q3 2021   Q3 2020       Q3 2021   Q3 2020    Q3 2021   Q3 2020   Q3 2021

  Daimler AG                                                                          6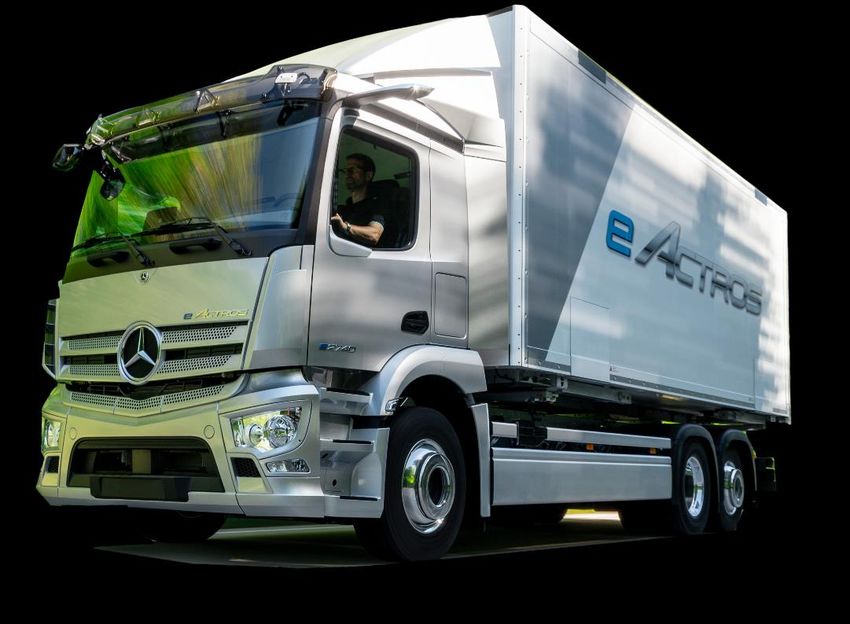
Mercedes-Benz Cars & Vans: EBIT & RoS
                                                                                                       Favourable product mix
                                                                                                       Improved net pricing
in million euros                                                                                       Significantly lower unit sales due to worldwide shortage of semiconductor components
                                                                                                       Disruptions in production network and supply chain due to shortage of semiconductor
                                                                                                       components
                                                                                                       Higher raw material prices
                                                            Gross profit +396                          Selling expenses Q3 2020 positively impacted by amendment of Pension-Plan &
                                                                                                       Healthcare MBUSA

                                                     +1,374        -154         -823
                                                                                            -290
                       +299               2,417                                                          -23          -155          -173
      2,118                                                                                                                                       2,175          -171               2,004

                   • Restructuring +297                             Mainly                                                                                  • Restructuring   -97
        RoS:                               RoS:                                                                                                    RoS:                             RoS:
                   • Legal                                          • RUB                                                                                   • Legal
        8.2%         proceedings     +2    9.4%                     • USD                                                                          8.5%       proceedings     -74
                                                                                                                                                                                    7.8%

        EBIT         Adjustments            EBIT      Volume/       Foreign    Industrial    Selling      General Research & non-    Others         EBIT   Adjustments               EBIT
       Q3 2020                            adjusted   Structure/    exchange   performance   expenses   administrative capitalized                 adjusted                          Q3 2021
                                          Q3 2020    Net pricing     rates                               expenses developm. costs                 Q3 2021

Daimler AG                                                                                                                                                                                    7
Mercedes-Benz Cars & Vans: Reconciliation from EBIT to CFBIT
in million euros

                                                                                                                                                             +475                     4,128
                                                                                                                      +487                     3,653
                            +1,170                       -228             -1,360In gespannt
                                                                                     +1,580 :-D

         2,004

                       t/o                               t/o                                                    t/o                                      • Legal Proceedings   +215
                       • New vehicle stock     +2,093    • YASA   -220                                          • BBAC Dividend         +732             • Restructuring        +40
                       • Unfinished products   -1,535                                                           • Result at-equity BBAC -209             • M&A                 +220

              EBIT            Change in                 Net financial    Net investments     Depreciation and            Other                  CFBIT       Adjustments                CFBIT
             Q3 2021        working capital             investments         in pp&e and       amortization/                                    Q3 2021                                adjusted
                                                                         intangible assets     impairments                                                                            Q3 2021

Daimler AG                                                                                                                                                                                       8
Daimler Trucks & Buses: Highlights ▸ Q3 sales significantly impacted by semi-conductor shortages with shortfall mostly felt in heavy duty markets North America and Europe; significant amount of trucks awaiting completion ▸ Order Book for 2022 opened for North America with record incoming orders during the first days reflecting strong continued demand ▸ Headwinds from raw material, partly offset by increased net pricing ▸ World Premiere of DTNAs newest addition to its purpose built vocational line-up, the all-new Western Star 47X ▸ Launch of the all new Mercedes-Benz Tourrider coach for North America ▸ Start of series production of battery-electric eActros Daimler AG 9
Daimler Trucks & Buses: Financials

        Sales             Revenue              EBIT adj.           CFBIT adj.
 in thousand units       in billion euros     in million euros    in million euros

                         9.2         8.9                         1,142
               106.4
 99.3

                                             603
                                                          489

        +7%                    -4%                 -19%                  -1,670

                                                                              -527

Q3 2020    Q3 2021     Q3 2020    Q3 2021   Q3 2020    Q3 2021   Q3 2020    Q3 2021

  Daimler AG                                                                          10
Daimler Trucks & Buses: EBIT & RoS Net pricing
Positive contributions from used vehicle business and from aftermarket
Positive one-time effects from BFDA Impairment reversal
Unfavorable regional heavy duty sales mix due to supply chain constraints in
North America and Europe
in million euros Higher costs, mainly related to raw material
Gross profit -83
+150 -27 -206
+62 603
541 -77 +34 489 -7
+13 -1 482
• Restructuring
RoS: RoS: RoS: measures -16 RoS:
• t/o Restructuring
5.9% measures +61 6.5% 5.5 % • M&A transactions +9 5.4%
EBIT Adjustments EBIT Volume/ Foreign Industrial Selling General Research & non- Others EBIT Adjustments EBIT
Q3 2020 Q3 2020 Structure/ exchange performance expenses administrative capitalized adjusted Q3 2021
adjusted Net pricing rates expenses developm. costs Q3 2021
Daimler AG 11
11Daimler Trucks & Buses: Reconciliation from EBIT to CFBIT
in million euros
482 -1,128
-576 -527
• Restructuring measures +9
• M&A transactions +40
+276 -10 +49
-45 -151
t/o
• Unfinished goods -928
EBIT Change in Net financial Net investments Depreciation and Other CFBIT Adjustments CFBIT
Q3 2021 working capital investments in pp&e and amortization/ Q3 2021 Q3 2021
intangible assets impairments adjusted
Daimler AG 12
12Daimler Mobility: Highlights
▸ Reduced portfolio due to semi-conductor shortage and lower dealer
stock
▸ Support for EV-sales at level comparable to ICEs
▸ Interest result benefitting from lower refinancing cost
▸ No new credit risk provisions required in Q3 due to high portfolio quality
▸ Improved operative business performance at mobility services and fleet
management
Daimler AG 13Daimler Mobility: Financials
New Contract
EBIT adj.
business volume in million euros
in billion euros in billion euros
943
18.7
150.6 148.1
14.6
601
-22% -2% +57%
Q3 2020 Q3 2021 12/31/2020 9/30/2021 Q3 2020 Q3 2021
Daimler AG 14Margin benefiting from lower refinancing costs
Daimler Mobility: EBIT & RoE Improved operative business performance at Mobility Services and Fleet
Management
Negative impact in Q3 2020 due to impairment of software in context of
streamlining IT Architecture
in million euros Gross profit* 315
+294 -8 -21 +41 943 0 943
590 +12 601 +15 +21
RoE: RoE: RoE: RoE:
16.2% 16.5% 23.3% 23.3%
EBIT Adjustments EBIT Foreign Cost of risk Volume/* Selling* General* Others* EBIT Adjustments EBIT
Q3 2020 adjusted exchange Margin expenses administrative adjusted Q3 2021
Q3 2020 rates expenses Q3 2021
* excluding FX effects
Daimler AG 15Daimler Q3 2021: Group EBIT (incl. Discontinued Operations – DO)
in million euros
+409 3,479 -242 +342 +146 3,611 -32 3,579 -680
+559 3,070 -114 Mercedes-Benz Cars & Vans:
• Legal proceedings -74
2,899
2,511 • Restructuring
measures -97
Daimler Trucks & Buses:
• Restructuring
measures -16
• M&A Transactions +9
• Legal Reconciliation:
proceedings +2 • Restructuring
• Restructuring measures -4
measures + 407 • M&A Transactions +150
EBIT DO EBIT Adjustments EBIT Mercedes-Benz Daimler Trucks Daimler* Reconciliation EBIT Adjustments EBIT t/o DO EBIT
Q3 2020 Q3 2020 adjusted Cars & Vans Mobility adjusted Q3 2021 Q3 2021
CO (CO & DO) Q3 2020 Q3 2021 (DO & CO) CO*
*Incl. Truck DMO, to be gradually carved out or ramped down
Daimler AG 16Daimler Q3 2021: Reconciliation from CFBIT to Free Cash Flow*
in million euros
3,653 -576
-613
+583 2,832
-251 +142 -105 2,249
• Legal proceedings +215
• Restructuring measures +51
• M&A transactions +316
CFBIT CFBIT Income Interest Effects from Other Free cash flow Adjustments Free cash flow
Mercedes-Benz Daimler taxes paid Pensions reconciling (industrial business) (industrial business)
Cars & Vans Trucks & Buses paid items adjusted
*before DO restatement
Daimler AG 17Daimler: Net Industrial Liquidity*
in billion euros
+1.7 -1.6
+2.4 +0.0 -0.3 +0.4 23.5
20.9
Free cash flow industrial business
Q3 2021: € 2,249 million
Net industrial Earnings and Working Depreciation and Additions to Investments in Other Net industrial
liquidity other cash capital impact amortization/ property, plant, and disposals of (mainly exchange liquidity
6/30/2021 flow impact impairments equipment and shareholdings rate effects) 9/30/2021
intangible assets *before DO restatement
Daimler AG 18Outlook
2021
Daimler AG 19Market Guidance 2021
Assumption
The economic conditions for worldwide demand are likely to remain favourable during the rest of the year. One must assume, however,
that strained supply chains and bottlenecks for key components will continue to have a considerable impact on worldwide vehicle
production in the fourth quarter.
Furthermore, we assume in Q4 an improved semiconductor supply situation vs. Q3, despite the still limited visibility and high volatility.
Global slight increase
Europe at prior-year level
Car Markets
USA slight increase
China at prior-year level
EU30 significant increase
Van Markets
USA at prior-year level
North America significant increase
Heavy-Duty Truck EU30 significant increase
Markets Japan at prior-year level
Brazil significant increase
Daimler AG 20Divisional Guidance 2021
Assumption
The economic conditions for worldwide demand are likely to remain favourable during the rest of the year. One must assume, however,
that strained supply chains and bottlenecks for key components will continue to have a considerable impact on worldwide vehicle
production in the fourth quarter.
Furthermore, we assume in Q4 an improved semiconductor supply situation vs. Q3, despite the still limited visibility and high volatility.
Cars slightly below
Unit Sales Vans at prior-year level
Trucks & Buses1 significantly above
Mercedes-Benz Cars & Vans 10 to 12%
Return on Sales
Daimler Trucks & Buses1 6 to 8%
(adjusted*)
Daimler Mobility (RoE) 20 to 22%
Cash Conversion Cars & Vans 0.8 to 1.0x
Rate** (adjusted) Trucks & Buses1 0.8 to 1.0x
1 Shown as Reference only, includes Daimler Trucks & Buses activities for 12 months (assumed without any effect of
the Spin-off) and is in line with previous Segment structure.
* The adjustments include material adjustments if they lead to significant effects in a reporting period. These material
adjustments relate in particular to legal proceedings and related measures, restructuring measures and M&A transactions (e.g. Spin-off).
** AdjustedDaimler
Cash FlowAGbefore Interest and Taxes (CFBIT) divided by adjusted EBIT. 21Daimler Group Guidance 2021
Assumption
The economic conditions for worldwide demand are likely to remain favourable during the rest of the year. One must assume, however,
that strained supply chains and bottlenecks for key components will continue to have a considerable impact on worldwide vehicle
production in the fourth quarter.
Furthermore, we assume in Q4 an improved semiconductor supply situation vs. Q3, despite the still limited visibility and high volatility.
Reference Guidance1 Group Guidance²
Daimler Group Revenue significantly above significantly above
Daimler Group EBIT significantly above significantly above
Free Cash Flow (industrial business) at prior-year level slightly below
Investment in PP&E slightly below significantly below
R&D expenditure slightly above slightly above
CO2 emission (g/km)* significantly below significantly below
1 TheReference Guidance covers Daimler Group incl. Daimler Trucks & Buses for 12 months (assumed without any effect of the Spin-off), is in line with
previous Group structure and shown as reference only.
² The Group Guidance covers Daimler Group for the full year incl. Daimler Trucks & Buses until expected spin-off in December for all KPIs. After Spin-off the
respective 35% equity share is accounted for at-equity. We expect to have considerable positive effects on Group EBIT in the fourth quarter, especially from
deconsolidation due to Spin-off, which cannot be reliably determined at present and is therefore not included in the Group Guidance so far.
* vs. the comparable figures for the previous year calculated according to WLTP (probably between 130 to 140 g/km, based on preliminary figures for fuel
consumption in 2020 taking into account the statutory regulations of 2021)
Daimler AG 22
22Appendix Daimler AG 23
Daimler Q3 2021
      Unit sales by division
      in thousand units

                                         Q3 2020             Q3 2021                      % change

     Daimler Group                           773                     578                         -25

     of which

             Mercedes-Benz Cars & Vans       673                     471                         -30

             Daimler Trucks & Buses           99                     106                          +7

Daimler AG                                         Capital Market Presentation Q3 2021 / October 29, 2021 / 24
Daimler Q3 2021
Revenue by division
in billion euros
Q3 2020 Q3 2021 % change
Daimler Group 40.3 8.7* 40.1 8.4* 0 -3*
of which
Mercedes-Benz Cars & Vans 25.8 25.6 -1
Daimler Trucks & Buses 9.2 8.9 -4
Daimler Mobility 6.9 6.9 0
* thereof discontinued operations
Daimler AG Capital Market Presentation Q3 2021 / October 29, 2021 / 25Daimler Q3 2021
Revenue by region
in billion euros
Q3 2020 Q3 2021 % change
Daimler Group 40.3 8.7* 40.1 8.4* -0 -3*
of which
Europe 17.5 15.0 -15
of which Germany 7.0 5.8 -18
North America 10.9 11.5 +5
of which United States 9.6 10.0 +4
Asia 10.0 11.0 +10
of which China** 5.5 6.2 +12
Other markets 1.8 2.5 +41
* thereof discontinued operations ** excluding revenue of not fully consolidated companies
Daimler AG Capital Market Presentation Q3 2021 / October 29, 2021 / 26Daimler Q3 2021
EBIT by division
EBIT in million euros; RoS/RoE in %
Q3 2020 Q3 2021
EBIT RoS/RoE** EBIT RoS/RoE**
Daimler Group 3,070 559* 7.4 3,579 680* 7.9
of which
Mercedes-Benz Cars & Vans 2,118 8.2 2,004 7.8
Daimler Trucks & Buses 541 5.9 482 5.4
Daimler Mobility 589 16.2 943 23.3
Reconciliation --178 – 150 -
* thereof discontinued operations ** Return on sales for automotive business, return on equity for Daimler Mobility; Daimler Group excluding Daimler Mobility.
Daimler AG Capital Market Presentation Q3 2021 / October 29, 2021 / 27Daimler Q3 2021
Reconciliation of EBIT reported to EBIT adjusted
in million euros
Mercedes-Benz Daimler Trucks & Daimler Mobility Reconciliation Daimler Group
Cars & Vans Buses
EBIT as reported Q3 2021 2,004 482 943 150 3,579 680*
Legal proceedings and related
74 - - - 74
measures
Restructuring measures 97 16 - 4 117
M&A transactions - -9 - -150 -159
EBIT adjusted Q3 2021 2,175 489 943 4 3,611
* thereof discontinued operations
Daimler AG Capital Market Presentation Q3 2021 / October 29, 2021 / 28Daimler Q3 2021
EBIT adjusted by division
EBIT in million euros; RoS/RoE in %
Q3 2020 Q3 2021
EBIT RoS/RoE* EBIT RoS/RoE*
Daimler Group 3,479 8.6 3,611 8.0
of which
Mercedes-Benz Cars & Vans 2,417 9.4 2,175 8.5
Daimler Trucks & Buses 603 6.5 489 5.5
Daimler Mobility 601 16.5 943 23.3
Reconciliation -142 – 4 -
* thereof discontinued operations ** Return on sales for automotive business, return on equity for Daimler Mobility; Daimler Group excluding Daimler Mobility.
Daimler AG Capital Market Presentation Q3 2021 / October 29, 2021 / 29Daimler Q3 2021
Key balance sheet and financial figures
in billion euros
Daimler Group Dec. 31, 2020 Sep. 30, 2021
Equity ratio 21.3% 26.0%
Gross liquidity 29.4 31.6
Funded status of pension obligations -11.0 -5.2
Funding ratio 72.4% 81.8%*
Industrial business
Equity ratio 37.3% 44.9%
Net liquidity 17.9 23.5
Free cash flow (January-September) 3.5 6.6
* change in Funding ratio driven by rising discount rates and the spin-off of Daimler’s commercial vehicles business.
Daimler AG Capital Market Presentation Q3 2021 / October 29, 2021 / 30Daimler Q3 2021
Financial flexibility over a 12-month period
in billion euros
65.8
ABS potential Other incl. Net industrial liquidity at €23.5 billion improved significantly
47.4 Fin. Lease
Commercial
paper Gross industrial liquidity at €27.0 billion
Credit facility Bank loans
Financial flexibility supported by €11 billion revolving credit facility,
Liquidity
Daimler which is unutilized
Mobility
Bonds
Liquidity
industrial
business
Account
deposits
Available or Maturities
accessible over next
liquidity 12 months
Daimler AG Capital Market Presentation Q3 2021 / October 29, 2021 / 31Mercedes-Benz Cars: unit sales by segments
in thousand units
567
10
3
242
383
6 smart
2 Sports Cars
14
83 186 SUVs
84 26 S-Class
53 E-Class
42 C-Class
131
68 A-/B-Class
Q3 2020 Q3 2021
Daimler AG / 32Mercedes-Benz Cars: unit sales by regions
in thousand units
567
71
146 383
71 Rest of world
84 Europe
88
52 excl. Germany
45 Germany
46 United States
214
133 China
Q3 2020 Q3 2021
Daimler AG / 33Mercedes-Benz Cars: Unit sales in China
758
in thousand units
678 694
imported 619 147
127
locally produced 193 540
488 196
135
400
171
293 150 611
567
485
147 423 405
317
250
146
2014 2015 2016 2017 2018 2019 2020 2021 YTD
Daimler AG / 34Mercedes-Benz Vans: Unit sales by regions
in thousand units
107
8
3 88
19 9 Asia
5 Latin America
18 North America
69
52 EU30
8 4 Rest of world
Q3 2020 Q3 2021
/ Page
Daimler AG 35
35Mercedes-Benz Vans: Unit sales by segments
in thousand units
107
88
58
53 Sprinter
29
21 Vito
14
2*4
12 V-Class
2 Citan
xx
*X-Class Q3 2020 Q3 2021
Daimler AG / 36Daimler Trucks: Unit sales by regions
in thousand units
102
94 8 Rest of world
7
22
31 Asia
8
16 Latin America
42
34 North America
15 13 EU30*
Q3 2020 Q3 2021
* European Union, UK, Switzerland and Norway
Daimler AG / 37Daimler Trucks: Incoming Orders*
in thousand units
162
12 Rest of world
35 Asia
100 20 Latin America
9
25
8 67 North America
42
27 EU30**
16
Q3 2020 Q3 2021
* Net order intake, adjusted for cancellations
** European Union, UK, Switzerland and Norway
Daimler AG / 38Daimler Buses: Unit sales by regions
in thousand units
5.1
4.7
0.9 0.4 Rest of world
0.5 0.6 Latin America
(excl. Brazil and Mexico)
1.6 1.4 Brazil
0.2 0.6 Mexico
1.9
1.7 EU30*
Q3 2020 Q3 2021
* European Union, UK, Switzerland and Norway
Daimler AG / 39Daimler Mobility: Contract volume
in billion euros
150.6 XX.X
148.1
26.0
17.7 18.8 China
16.8 16.2 Africa & Asia-Pacific
59.6 XX.X
51.2 50.9 Americas
38.9
41.3 XX.X
37.5 Europe
(excl. Germany)
25.9
25.9 24.7
XX.X Germany
12/31/2020 09/30/2021
Daimler AG / 40Daimler Mobility
Net credit losses*
0.89%
0.83%
0.68%
0.61%
0.50% 0.51%
0.43%
0.36% 0.37%
0.34% 0.33%
0.31% 0.31%
0.26% 0.26%
0.24%
0.21% 0.20%
2004 2005 2006 2007 2008 2009 2010 2011 2012 2013 2014 2015 2016 2017 2018 2019 2020 per Sep
2021
* as a percentage of portfolio, subject to credit risk
Daimler AG Capital Market Presentation Q3 2021 / October 29, 2021 / 41YOUR NOW Joint Ventures Q3 2021
1. FREE NOW & REACH NOW 2. SHARE NOW 3. CHARGE NOW
09/2021
YTD
Interactions
in millions 109.8 97.3 0.4 10.7 1.4
Customers*
in millions
55.4 51.6 0.3 3.3 0.2
Cities* 172 152 4 16 n/a
* Partially, data summation w/o consideration of possible redundancies
Daimler AG Capital Market Presentation Q3 2021 / October 29, 2021 / 42Daimler Q3 2021
Disclaimer
This document contains forward-looking statements that reflect our current views about future events. The words “anticipate,” “assume,”
“believe,” “estimate,” “expect,” “intend,” “may,” ”can,” “could,” “plan,” “project,” “should” and similar expressions are used to identify forward-
looking statements. These statements are subject to many risks and uncertainties, including an adverse development of global economic
conditions, in particular a decline of demand in our most important markets; a deterioration of our refinancing possibilities on the credit and
financial markets; events of force majeure including natural disasters, pandemics, acts of terrorism, political unrest, armed conflicts, industrial
accidents and their effects on our sales, purchasing, production or financial services activities; changes in currency exchange rates, customs
and foreign trade provisions; a shift in consumer preferences towards smaller, lower-margin vehicles; a possible lack of acceptance of our
products or services which limits our ability to achieve prices and adequately utilize our production capacities; price increases for fuel or raw
materials; disruption of production due to shortages of materials, labor strikes or supplier insolvencies; a decline in resale prices of used
vehicles; the effective implementation of cost-reduction and efficiency-optimization measures; the business outlook for companies in which we
hold a significant equity interest; the successful implementation of strategic cooperations and joint ventures; changes in laws, regulations and
government policies, particularly those relating to vehicle emissions, fuel economy and safety; the resolution of pending governmental
investigations or of investigations requested by governments and the outcome of pending or threatened future legal proceedings; and other
risks and uncertainties, some of which are described under the heading “Risk and Opportunity Report” in the current Annual Report or in the
Interim Report. If any of these risks and uncertainties materializes or if the assumptions underlying any of our forward-looking statements
prove to be incorrect, the actual results may be materially different from those we express or imply by such statements. We do not intend or
assume any obligation to update these forward-looking statements since they are based solely on the circumstances at the date of publication.
Daimler AG Capital Market Presentation Q3 2021 / October 29, 2021 / 43You can also read