Q1 Report 2022 Wallenius Wilhelmsen ASA
←
→
Page content transcription
If your browser does not render page correctly, please read the page content below
Wallenius Wilhelmsen ASA

Q1 Report 2022
Highlights – Q1 2022

• Strong EBITDA of USD 309m driven by the shipping segment

• Some margin pressure due to fuel prices and supply chain issues

• Cash position increased to USD 759m driven by solid EBITDA

• Limited direct impact on business from war in Ukraine

• Issue of NOK 1.25bn sustainability-linked bond

• AGM approved the USD 63.5m dividend, and appointed Hans Åkervall and
  Yngvil Eriksson Åsheim as new members of the board

                                                                         2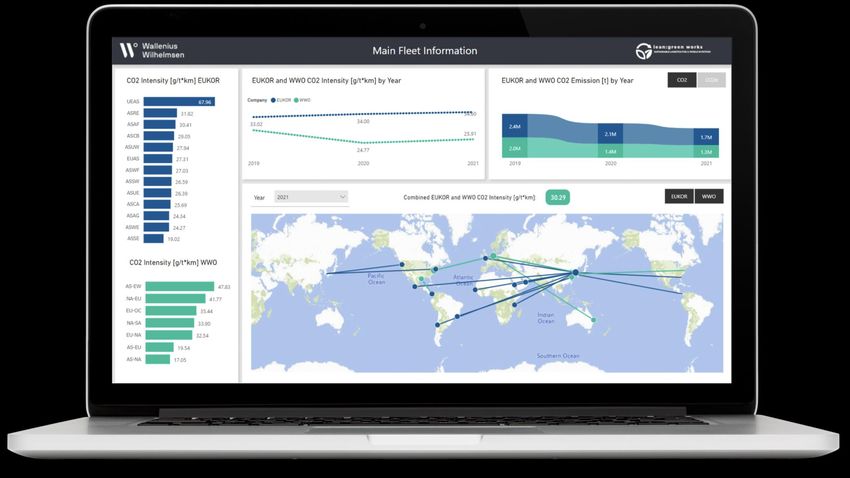
Agenda

         1. Shipping update
         2. Logistics update
         3. Financial update
         4. Prospects and Q&A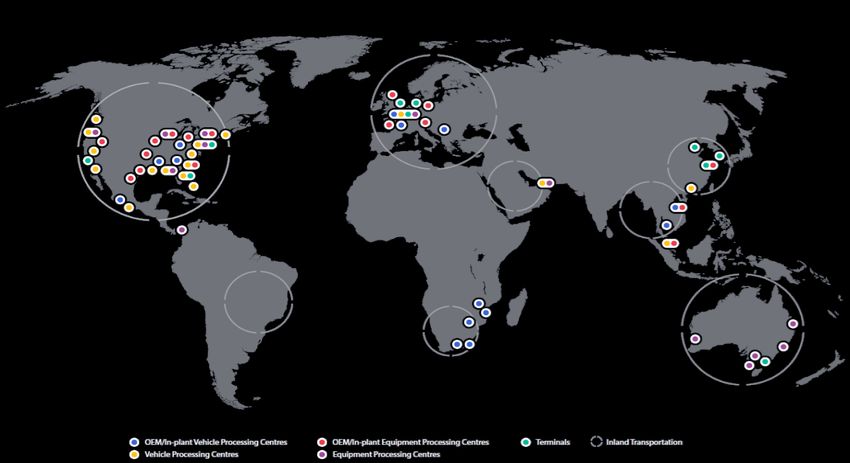
Shipping update
Shipping volumes up 1% QoQ despite seasonality and operational disruptions

                       Shipping services volumes and cargo mix
Million CBM
                                                                                                      +8%                 +1%           %          • Continued solid volumes in most trades, except EU-Asia
                                                                                                                                            40
18
       15.5
                    16.6
                              15.6
                                                                                                  16.2                                               mainly due to less sailings
16                                       15.3                                                                       15.3        15.5
                                                                              14.8                        14.6                              35
                                                                                          14.3
14                                               12.6
                                                                   11.9
                                                                                                                                            30     • Port congestions creates further operational disruptions,
12
                                                                                                                                            25       we work hard to mitigate impact
10                                                        9.0
                                                                                                                                            20
  8                                                                                                                                                • Cargo mix and contract renewals drive net freight rate to
                                                                                                                                            15
  6                                                                                                                                                  USD 52.2 per cbm, up from USD 49.7 in Q4
                                                                                                                                            10
  4
  2                                                                                                                                         5      • Cargo mix (H&H share) at 31% Q1, up from 30% in Q4 on
  0
      Q1’19         Q2’19    Q3’19       Q4’19   Q1’20   Q2’20    Q3’20      Q4’20        Q1’21   Q2’21   Q3’21    Q4’21        Q1’22
                                                                                                                                            0        positive volume development
              Prorated volumes in million CBM (lhs)1                               H&H share, unprorated in % (rhs)2

         EU/NA – Oceania                                                Atlantic                                         EU - ASIA                                   Asia - EU                        Asia - NA
                    +13%          +25%                                 +9%         +20%                                  -23%         -23%                           +22%         +3%                +3%         +2%

                                         1.3                     2.4                      2.6                      2.0          2.0                                         2.8         2.9    2.9         3.0         3.0
              1.1           1.0                                              2.2                                                                               2.4
                                                                                                                                             1.6

         Q1’21          Q4’21        Q1’22                      Q1’21     Q4’21       Q1’22                       Q1’21     Q4’21           Q1’22             Q1’21     Q4’21       Q1’22     Q1’21     Q4’21      Q1’22

1) Total volume based on prorated volume in Shipping services (ex. Government services), i.e. volumes are split between months based on the sailing period onboard the vessel
                                                                                                                                                                                                                             5
2) H&H share calculated based on unprorated volumes, i.e. volumes loaded onto vessels during the quarter
Stable fleet development in Q1
Fleet capacity Controlled fleet + net short-term charters in # of vessels1
• Total fleet at 129 vessels 136
132 129 131 129 130 129
127
123 122
• One vessel sale from the 117
government segment
74
• Less usage of short-term 81
77 82 83 83 83 82
charters 84
73
75
• No further newbuildings on order
• Time charter market remains tight 28
28 32 35
28 36 42 42 42
18 42
38 5
10 13
15 16 16 10 1
1 8 3 6 4 5 5
-1
Q1’20 Q2’20 Q3’20 Q4’20 Q1’21 Q2’21 Q3’21 Q4’21 Jan’22 Feb’22 Mar’22
Owned Long-Term Charter Net Short-Term Charter Cold Layup
1 Vessels in cold layup included owned and chartered vessels 6High underlying auto demand from consumers not reflected in Q1 LV sales, 2022FY
sales growth still expected
LV SALES LV DEEPSEA LIGHT VEHICLE SALES OUTLOOK
+8%
+3% +2%
YoY Q1-22
(unit growth) -5.4% -5.9%
o We still expect increased sales figures o Semiconductor shortage holding back
despite the unrest in Eastern Europe, production as: -14%
however inflation might reduce consumer o Vehicles more advanced over the past 5- 2020 2021 2022 2023
confidence 10 years
o Global LV sales do not reflect the high o Increased competition from consumer
underlying demand from consumers electronics
o On the supply side production does not hold o Long lead-time to ramp up capacity
up
o Supply chain constraints prevent increased
production
7
Source: IHS Markit / Market Insight Wallenius Wilhelmsen. Arrows indicate YoY growth compared to last quarter.Strong H&H demand despite additional headwinds on both supply and demand side
CONSTRUCTION MINING AGRICULTURE EQUIPMENT PRODUCER SALES OUTLOOK3
+25%
+14%
+7%
YoY Q1-221,2
(unit growth) +24% N/A +2%
o Increasing construction activity o Metal prices significantly o Strong farm income from food
above pre-pandemic peaks prices at all-time high -13%
o Solid builder sentiment
o Strong machinery demand o Miner profits at all-time high o Farm margins under pressure 2020 2021 2022 2023
o Accelerating machinery prices o Positive miner capex from cost inflation
o Moderating order growth guidance revisions o Moderating industry sentiment
o Depleted machinery o Uncertain Chinese demand o Positive but moderating
inventories and robust order prospects equipment demand
backlogs o Strong machinery demand – o Depleted inventories and
still well-below prior highs strong order backlogs
Source: 1IHS Markit | World construction & agriculture equipment exports (avg. equipment value >20 kUSD ) (Units last 3 months, YoY) per January 2022. Data is limited to countries having reported customs
data as per April 3rd, 2022. Arrows indicate YoY growth compared to last quarter. 2Parker Bay | Large Mining Equipment Deliveries (Units last quarter YoY). N/A: Q1-22 data not yet available. 3Factset Data and
Analytics (April 25th, 2022) | OEM revenue consensus estimates per calendar year (USD). Constituents: Volvo, Caterpillar, CNH, Hitachi, Deere, Terex, Doosan, Sandvik, Epiroc and AGCO. Estimates include sales 8
of constr./mining/agri. equipment onlyTight tonnage situation - limited recycling and still moderate orderbook
New orders have a lead time of 3-4 years. Easing of current supply chain inefficiencies will add capacity
GLOBAL FLEET*
End Q1
(end Q4)
#43 (43) #51 (39) 94% (96%)
vessels built between fleet utilization rate in
vessels in orderbook
1983 and 1997 2022
Source: Clarksons Platou, *for vessels above 4000 CEU, Utilization rate calculated on the basis of total global fleet (supply) and vessel capacity (demand)
9Agenda
1. Shipping update
2. Logistics update
3. Financial update
4. Prospects and Q&ALogistics update
11Volumes improved as customers experienced fewer chip related shut-downs
• Increased auto volumes as production
plants experienced fewer disruptions
• H&H revenue largely up on lower
margin inland transportation business
• Terminals positively impacted by shipping
volumes and seasonality
• EMEA/APAC revenue up on stronger
volume and fumigation seasonality
Solutions America (Auto) Solutions America (H&H) Terminals EMEA/APAC
Revenues (USDm) Revenues (USDm) Revenues (USDm) Revenues (USDm)
+19% +10% +19% +7% +7% +3%
-16% +5%
95 33 49 53 43 45 46
80 27 29 45
76
Q1’21 Q4’21 Q1’22 Q1’21 Q4’21 Q1’22 Q1’21 Q4’21 Q1’22 Q1’21 Q4’21 Q1’22
Illustration shows WW Logistics locations: OEM/In plant VPC VPC OEM/In plant EPC EPC Terminals Inland Transportation 12Chip shortage continues to impact key logistics market, while end-user demand
remain solid despite increased inflation
LOGISTICS – key markets for Light Vehicles
North America LV Volume Europe LV Volume
5.1 4.9 6.1
4.4 4.2 4.2 5.1
4.8 4.4 4.7
Units per
quarter in
millions
Q1 2019 Q1 2020 Q1 2021 Q4 2021 Q1 2022 Q1 2019 Q1 2020 Q1 2021 Q4 2021 Q1 2022
o Consumer confidence high as job figures o Partial lock-down in selected markets due to
solid and interest rates low Covid dampen off some sales
o Supply is tight due to semiconductor shortage o Major sourcing issues leading to low
o OEMs prioritize most profitable vehicles and production and dealers unable to meet
average price is record high consumer demand
o Inventories record low o OEMs focusing on low-emission vehicles
leading to a change of sales mix rather than
increased volume
13
Source: IHS Markit. Volumes include all North American and European light vehicle production, both for domestic sales and for export abroad, plus imports.Agenda
1. Shipping update
2. Logistics update
3. Financial update
4. Prospects and Q&AFinancial highlights Q1 2022
RESULTS (USDm) KEY FINANCIAL METRICS
Total revenue Adjusted EBITDA Adj. ROCE* (%)
Q4-21 Q1-22
1 078 1 149 306 301 +6.5
7.8
Group
838
+2.1
132
Net profit 98 177
862 930 279 278
623
Adj. EBITDA
Shipping
28.4% 26.2% Equity ratio (%)
100
margin
+3.2
203 199 211 29 37.4 +1.4
24 22
Logistics
Cash 710 759
60 58 10 ND/Adj. EBITDA** (x)
54
7 8
3 418 3 294
Gov’t
Net debt
-3.3
3.2 -0.8
Q1’21 Q4’21 Q1’22 Q1’21 Q4’21 Q1’22
* ROCE calculated as last twelve months average, based on adj. EBIT
** Based on last twelve month adj. EBITDA 15Shipping continues to deliver high EBITDA, government flat QoQ, while logistics
margins come under pressure
Shipping – Adj. EBITDA 1 Logistics – Adj. EBITDA 1 Government – Adj. EBITDA 1
USDm USDm USDm
+178% 0% -23% -7%
-22% +10%
279 278 35
300 50% 35 20% 20 40%
32 10 29 8 35%
250 30 15
40%
24 12 11
195 25 22 15% 10 30%
200 21 10 7 25%
163 30% 20 16
150 35 10% 5 20%
100 247 268 20% 15
100 0 15%
10 5% 10%
50 128 10% -5 -8
5 5%
0 0 0 0 -10 0
Q1’21 Q2’21 Q3’21 Q4’21 Q1’22 Q1’21 Q2’21 Q3’21 Q4’21 Q1’22 Q1’21 Q2’21 Q3’21 Q4’21 Q1’22
• QoQ EBITDA1) up due to solid freight • QoQ EBITDA decreased mainly due to • QoQ EBITDA1) grew moderately; improved
rates, volume growth, and efficient increased fuel cost (H&H) and shift charter results partially countered by lower
operations towards low-margin services U.S. flag cargo activity
• YoY EBITDA1) significantly up due to • YoY EBITDA fell as Americas (auto) • YoY EBITDA1) dropped, negatively impacted
return of demand and volumes volumes dropped due to chip shortages by significantly higher fuel prices
1) Adjusted for extraordinary items. Q4-21 and Q1-22 shipping and government adjustments related to vessel sales Extraordinary items EBITDA EBITDA margin 16Revenues increased QoQ, while adjusted EBITDA was flat on cost pressure
+71
• Revenue up USD 71m QoQ 12
-1 -2
22 0
• Higher rates per CBM driven -7
by cargo mix and 38
renegotiated contracts 9 1 149
USDm
• Fuel surcharges increase on
rising global oil prices 1 078
Revenue Volume effect Revenue per CBM Fuel surcharges Charter income Other Revenue
Q4 2021 Q1 2022
• EBITDA1) down USD 5m QoQ
-5
6
• Increase in revenues 306
-32
countered by increasing cost 68
-40
across the business 9 -5 -3 -1
-2 12 -7 -13 3 309
USDm
• Fuel cost increases more 306 301
than outweigh surcharges
Adj. EBITDA Revenue Cargo/Voyage Fuel Cost Vessel opex Charter SG&A Other Other Adj. EBITDA
Q4 2021 effect cost expenses Logistics Government Q1 2022
1) Adjusted for gain on vessel sale, USD -8m Shipping Logistics Government Elimination Holding 17Cash increased by USD 49m driven by solid EBITDA
Comments +28
• Working capital includes payment of
-24 -7 0 -6
USD 26m in customer settlements and 0 -44 329
fines 349 301 -172
• Net capex includes i.e.: -1
• USD 21m for the sale of an older
vessel to the US government
USDm
• USD 10m investment in our
710 759
subsidiary ALS
Operating cash flow Investing cash flow Financing cash flow
• Approximately USD 10m in
drydocking 270 -5 -216
• Net debt flows include prepayment of
deferred debt and a bond maturity, on Liquidity Adj. Δ Taxes Other Net Other Interest Net Debt Other Liquidity
top of regular instalments during the Q4 2021 EBITDA Working paid operating CAPEX investing paid financial Q1 2022
cap. items items items
quarter
Undrawn credit facilities Cash
18Solid balance sheet and strong liquidity position
COMMENTS BALANCE SHEET 31.03.2022 Debt Maturity Profile
USD billion USD million
• Equity ratio at 37.4% Assets Equity & Liabilities
1 013
7 929 7 929
• Net debt down to USD 3.3bn
• USD 49m of deferred debt 789
instalments in WW Ocean prepaid 2 965 70
2.8 597
627
• EUKOR facility refinanced with USD
6 290 40 233
20m increase in drawn debt 128
6.3
• Intragroup vessel sales have 402
3 477 117
triggered debt prepayment and 3.6 306
203
new debt uptake
416
342
• 2022 bond maturities covered by SLB
1 639 1 487 180 199
• 2022 lease and bank maturities planned
refinanced during the next 12 months 2022 2023 2024 2025
Credit facilities (drawn)
Non-current assets Equity Bonds
Current assets Non-current liabilities Balloons (bank loans and leases)
Current liabilities Installments (bank loans and leases) 19In April we successfully issued our first sustainability-linked bond of NOK 1,250m
Sustainability-linked financing framework
• Target to reduce CO2 intensity by 27.5%
from 2019-2030
• Pricing mechanism linked to achieving the
CO2 intensity target
First Sustainability Linked Bond Issue
NOK 1,250m
Our target implies a 52% reduction in our CO2 intensity from 2008- 2x oversubscribed
2030, exceeding our IMO 2030 obligation for a 40% reduction
20Agenda
1. Shipping update
2. Logistics update
3. Financial update
4. Prospects and Q&AProspects
• We continue to expect the supply-demand balance in shipping to remain favorable over the mid-term due to
the overall global fleet situation. Logistics volumes will benefit from gradual improvement of automotive
semiconductor chip supply expected during the latter part of 2022. This is expected to allow us to consolidate
financial flexibility and help drive shareholder value creation in the absence of further volatility. Current
disruptions to the global supply chains negatively impact the group and its customers.
• Potential risks include further disruptions to the global supply chains, operational impact from further Covid-
19 outbreaks, fuel supply disruption, labor cost and availability, further escalation of the war in Ukraine and
negative global economic developments.
22Q&A
You can also read