PUBLIC REPORT Smart wind barriers for traffic and bridge protection
←
→
Page content transcription
If your browser does not render page correctly, please read the page content below

City, University of London Department for Transport

 Smart wind barriers for traffic and bridge
 protection

 PUBLIC REPORT

 Dr Alfredo Camara

 September 2018

 1
City, University of London Department for Transport

Author: Dr Alfredo Camara September 2018

Smart wind barriers for traffic and bridge
protection

Executive summary
The Department for Transport (DfT) awarded a T-TRIG to Dr Alfredo Camara (PI) and Dr Chetan Jagadeesh (Co-
I), both academics at City, University of London (CUoL). The study is designed as a proof-of-concept for a new
type of bridge wind barriers that are composed of horizontal rails connected to vertical posts. The novelty is that
the rails can rotate and adapt the shielding to protect both the traffic and the structure. The objective of this
project is to study the aerodynamic response of an isolated rail of the barrier for different angles of attack of the
wind and to use this information in a numerical model that accounts for the mechanical properties of the rail and
its connection to the posts of the barriers.

The experimental and the analytical results showed the benefits of the proposed aerodynamic section for the
rails of the barriers, which can efficiently block the wind when they are in vertical position and minimise the drag
force transmitted to the bridge when they are horizontal. The wind forces are defined through aerodynamic
coefficients that are used in a new analysis methodology that accounts for the capacity of the rails to rotate. The
results of an extensive parametric analysis conducted with this methodology showed that it is possible to
optimise the mechanical properties of the rails in order to achieve the required level of traffic and bridge
protection. A preliminary design of the adaptable barriers in the Queen Elizabeth II Bridge in Dartford was
conducted in cooperation with Highways England (HE) and Connect Plus Services (CPS). The results showed that
certain configurations of the barriers can increase the wind speed for which the traffic is closed in this important
bridge by 15%, which could reduce the number of traffic closures by 70% without compromising the driving safety
and the structural integrity. Further studies are required to confirm these results and to test the integrated
prototype, first in the wind tunnel and then in a real bridge.

2
City, University of London Department for Transport

Table of Contents
Executive summary ...................................................................................................................................................... 2
List of symbols and abbreviations .............................................................................................................................. 4
1. The problem ..........................................................................................................................................................5
2. The proposed solution......................................................................................................................................... 6
 2.1 Concept and potential ............................................................................................................................... 6
 2.2 Conception and intellectual property ....................................................................................................... 6
3. Work done .............................................................................................................................................................7
 3.1. Assumptions and limitations ..............................................................................................................................7
 3.2. Technology and equipment used ......................................................................................................................7
 3.3. Aerodynamic coefficients of the rails ...............................................................................................................7
 3.3.1. Wind tunnel testing .................................................................................................................................... 8
 3.3.2. Computational fluid dynamic analysis ...................................................................................................... 10
 3.3.3. Analytical results ....................................................................................................................................... 13
 3.3.4. Comparison and selection of the aerodynamic coefficients .................................................................. 13
 3.4. Proposed analysis method for the smart barriers.......................................................................................... 14
 3.5. Implementation to the Queen Elizabeth II Bridge ......................................................................................... 15
4. Implementation to the UK transport network.................................................................................................. 17
5. Next steps ........................................................................................................................................................... 17
6. Conclusions ......................................................................................................................................................... 18
References .................................................................................................................................................................. 19
Appendix: Further research works ........................................................................................................................... 20

3
City, University of London Department for Transport

List of symbols and abbreviations
Symbols

 B Chord of the rail
 CD Drag coefficient
 CL Lift coefficient
 CM Moment (pitch) coefficient
 g Gravitational constant
 L Length of the rail
 FD Drag force
 FL Lift force
 Kt Torsional stiffness of the rail-post connection
 M Pitching moment
 Mr Mass of the rail per unit length
 Uwind, ∞ Mean wind speed
 α Angle of attack of the wind
 ρ Density of the air
 θ Rotation angle of the rails.

Abbreviations

 CFD Computational Fluid Dynamic
 Co-I Co-Investigator
 CPS Connect Plus Services
 CUoL City, University of London
 DfT Department for Transport
 HE Highways England
 PI Principal Investigator
 T-TRIG Transport Technology Research Innovation Grant
 TRL Technology Readiness Level
 WT Wind Tunnel.

4
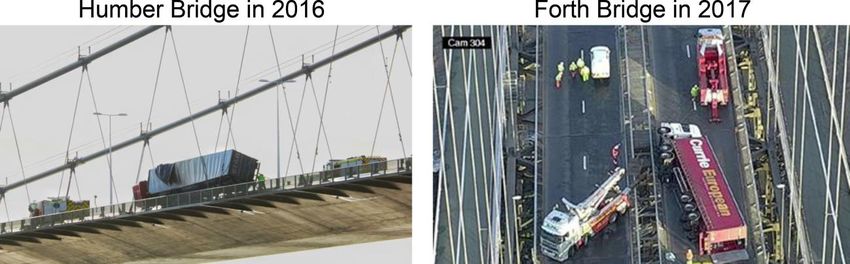
City, University of London Department for Transport

 1. The problem
The UK road infrastructure is backboned by more than 30 long-span bridges that often represent the only link
between population and industry in miles around. These vital structures are prone to vibrations and are usually
placed in locations very exposed to strong winds. Unfortunately, the combination of these factors causes
accidents in important UK bridges every year as shown in Figure 1, posing a great risk to the vehicle users and to
the integrity of the structure.

Figure 1. Examples of wind-driven traffic accidents in two major UK Bridges.

Today, the most effective solution is the installation of wind barriers that protect the traffic at the expense of
increasing the wind load on the bridge. The design of conventional wind barriers for bridges tries to find a
compromise between the wind pressure that is admissible on the vehicles and that on the deck for a certain
wind speed. Previous research works on wind barriers proposed wind tunnel (WT) testing or computational fluid
dynamic (CFD) analyses to optimise the barriers in order to protect the vehicles without increasing significantly
the wind forces on the deck. However, these barriers provide the same blockage under moderate and strong
winds. Consequently, only the bridges designed or retrofitted to resist the large forces transmitted by the
barriers under high cross-winds can be equipped with the current wind-proofing technology. There are many
bridges in the UK that are not prepared for the conventional wind barriers and the alternative solution in these
cases is to establish traffic restrictions or closures when the wind speed exceeds certain limits, which lead to
frequent congestions and, sometimes, to vehicle accidents (as shown in Fig. 1).

To have an idea of the magnitude of the problem some of the main UK bridge operators were surveyed. In the
last two decades the Humber and the Severn Bridges were closed to traffic due to high winds an average of 192
hours (i.e. 8 completes days) every year. This type of interruptions represents a real problem in the UK because
there are dozens of long-span bridges and hundreds of smaller bridges located in areas very exposed to wind
across the country. These interruptions result in significant vehicle diversions, queues, operation costs and
external costs such as noise emissions, air pollution, risk of accidents and other externalities associated with the
diverted traffic. Even more important than these are (1) the human costs related to vehicle accidents that can
occur before the bridge is closed to traffic, and (2) the downtime and the retrofit costs associated with the
structural damage in the case of wind-driven vehicle impacts on the supporting elements of the bridge.

5
City, University of London Department for Transport

 2. The proposed solution

 2.1 Concept and potential
This T-TRIG project proposes a wind barrier that can protect both the vehicles and the bridge by adapting its
aerodynamic properties for different wind speeds. It will be achieved by allowing the rails of the barrier to rotate
in order to offer an adequate shielding to the vehicles and reduced aerodynamic forces on the deck for different
wind speeds (Uwind). The concept is illustrated in Figure 2. For moderate wind speeds the aerodynamic forces
transmitted from the wind barrier can be resisted by the deck. In this case the rails are in ‘closed’ position to
minimise the direct aerodynamic pressure on the vehicles. Vehicles are not expected to cross the bridge in the
event of an extremely large storm and, in this case, the barriers are ‘open’ to reduce the lateral pressure on the
deck. This type of barrier could be installed in both new and existing bridges because when the rails are open
the obstruction to the wind flow is minimum and the forces transmitted to the structure are also reduced.

Figure 2. Concept of the proposed smart barriers.

The proposed wind barriers have the potential to protect the road users in windy days and to extend the
operability of the UK transport network, reducing the number of traffic interruptions in bridges and the
significant cost that it represents every year in the UK. It is worth noting that there will be no need for external
power supply to rotate the rails of the barriers, with the consequent improvement in robustness and the
reduction of installation and maintenance costs in this new type of wind proofing.

The results presented in Section 3.5 show that the proposed adaptable rails could effectively increase the wind
velocity above which the Queen Elizabeth II (QEII) Bridge in Dartford (one of the most important UK bridges) is
currently closing to traffic. This proves the potential of the proposed smart barriers and the need for further
research and development.

 2.2 Conception and intellectual property
The idea of the smart barriers proposed in this study was conceived by the PI after a meeting with Highways
England (HE) and Connect Plus Services (CPS) in which the current problems of traffic interruptions in bridges
were discussed, along with the need for an adequate wind-proofing technology in the UK. There are recent
proposals of wind barriers in which the rails can rotate due to the wind action, particularly from China. However,
these solutions include rails that are not optimised from an aerodynamic point of view and the connection with
the posts is not designed to control the movement of the rails. As a result, these barriers cannot be tuned to the
specific needs of the bridge in which they are to be installed.

6
City, University of London Department for Transport

As opposed to the previous adaptable barriers, the proposed solution is innovative in terms of (1) the
aerodynamic shape of the rails, and (2) the control of the rotation of the barriers through the mass and the
flexibility of the rails and their connections to the posts.

These novelties will allow the development of a smart barrier that can be designed to the specific structural and
operational needs of the bridge to be protected. This gives a significant technical and commercial strength to
the proposed idea. In order to protect it the authors are working with CUoL on further developing and patenting
the proposed smart barriers.

 3. Work done

 3.1. Assumptions and limitations
This project is designed as a proof-of-concept of the smart barriers and it is focused on its main components: the
rails and their connection to the vertical posts. However, it does not consider the barrier as a whole and the
interaction of the wind flow between different rails, which will be included in a future stage of the work. The rail
proposed in this project has an aerofoil section to minimise the drag when it is in open position. Among the large
variety of aerofoils, a standard symmetric NACA 0013 was chosen as a reasonable option given its symmetry and
aerodynamic properties for low angles of attack. This choice also facilitated the WT testing because two NACA
0013 aerofoils models were available in the Aeronautics Laboratory at CUoL. The next stage of the project will
consider different rail sections. Another limitation of the study is that the connection between the shafts of the
balance that measures the forces in the WT and the aerofoil did not allow to test angles of attack above 30 o. This
limitation was overcome with CFD analysis and analytical results.

 3.2. Technology and equipment used
This project is based on the accurate calculation of the wind forces acting on the rail of the barrier for different
angles of inclination. To this end, the aerodynamic coefficients of the aerofoil rail section are obtained using
three different methods that will be discussed and compared in the following Sections.

The first method to obtain the aerodynamic coefficients of the aerofoil was the wind tunnel (WT) testing. The
experiments were conducted from the 18th to the 22nd of June 2018 in the T2 Low Speed Wind Tunnel at the
Handley Page Aeronautics Laboratory at CUoL. The WT is of a recirculating type and the test section is octagonal
in shape, with dimensions of 1.12 m x 0.8 m x 1.78 m.

The aerodynamic coefficients were also obtained by means of computational fluid dynamic (CFD) analysis
conducted in ANSYS Fluent [1] by Ms Chrysanthi Stroumpouli, a MSc student at CUoL working in this project. The
third way to obtain the coefficients for different angles of attack was XFLR5 [2], a specialised software for the
analysis and design of aerofoils based on the two-dimensional panel method.

The analysis method for the rail-connection response that is presented in Section 3.4 has been implemented in
MATLAB [3].

 3.3. Aerodynamic coefficients of the rails
The first stage of the project involved the study of the wind flow around the cross-section of the proposed rails
of the barriers. The rail is considered as a static obstacle to the wind in this work due to the difficulties in testing
the rail movement with connections to the posts. The aerodynamic wind forces and moments obtained were

7
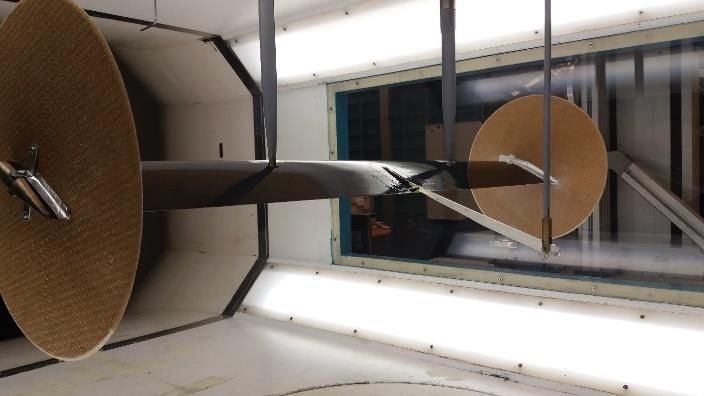
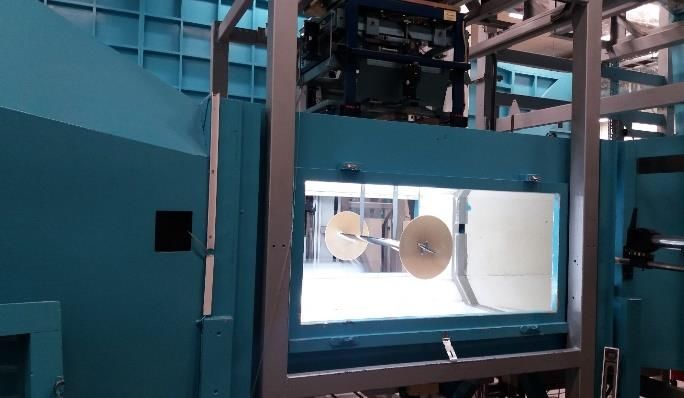
City, University of London Department for Transport

then converted to non-dimensional aerodynamic coefficients for different angles of attack of the wind (α). These
angles are related to the rotation of the rails (θ) and they are subsequently input in the analysis method
described in Section 3.4 to consider the flexibility of the rail-post connection and the effect of the weight of the
rail. Three different methods are used in the study of the aerodynamic coefficients of the rail, namely
experimental, numerical and analytical methods. These will be compared and discussed in the present Section.

 3.3.1. Wind tunnel testing
Two timber aerofoil sections of the NACA 0013 family with different aspect ratios were tested in the WT: L/B =
6.3 and L/B = 8.6, where L is the length (across-wind dimension) of the aerofoil and B its chord (along-wind
dimension). The chord of the aerofoil was B = 0.1 m in both cases. The longest aerofoil was equipped with end
plates to promote the two-dimensionality of the flow, but it was also tested without these elements to observe
their effect. Figure 2 shows the longest aerofoil (L/B = 8.6) installed in the WT for the testing.

Figure 2. Long aerofoil model installed in the T2 WT at CUoL for this project. Pictures taken by Ms Stroumpouli.

The two vertical shafts in gray colour that can be seen in Fig. 2 connect a 6-component force balance on top of
the WT with the model that is being tested. The connection with the model is established at two hinges that
allow free rotation in a range of angles (α) of ±30o with respect to the horizontal plane. Achieving angles above
this value was not possible because of the contact between the aerofoil and the vertical shafts. The hinges are
spaced from the leading edge of the aerofoil a distance of 25% of the chord (B), which corresponds to its
aerodynamic center. The angle of attack of the wind, defined as the inclination between the chord of the aerofoil
and the horizontal plane (α) is controlled by means of a sting connected to the center of the model (spanwise),
as shown in Fig. 2 (right). The drag force was corrected to account for the wind forces on the shafts, the sting
and the end plates (when installed), as well as for the blockage effects according to [4].

The aerodynamic coefficients were obtained as:

 = 1 2
 (1)
 ∞
 2

 = 1 2
 (2)
 ∞
 2

 = 1 2
 (3)
 2 ∞
 2

Where CD, CL and CM are the drag, the lift and the moment coefficients, respectively, and FD, FL and M represent
the time-averaged drag (corrected), the lift and the pitching moment measured in the force balance during the
testing. The density of the air ( ) was measured every day of testing in order to obtain the aerodynamic
coefficients and it ranged from = 1.195 to 1.210 kg/m3. ∞ is the mean wind velocity applied during the test.

8
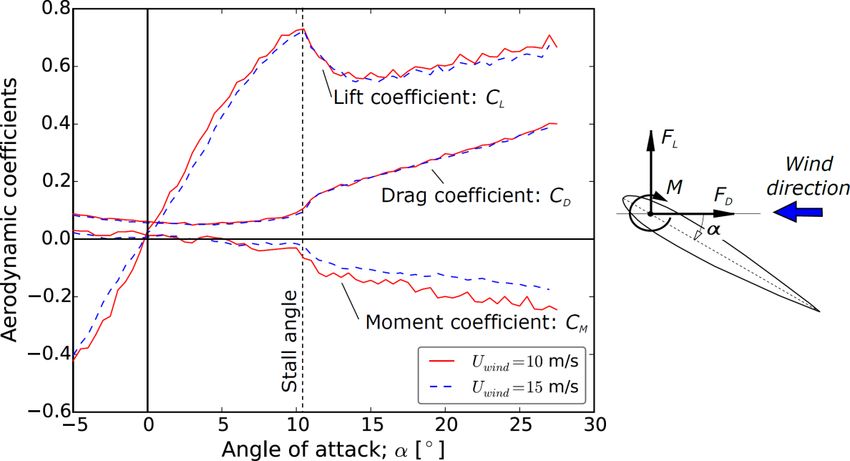
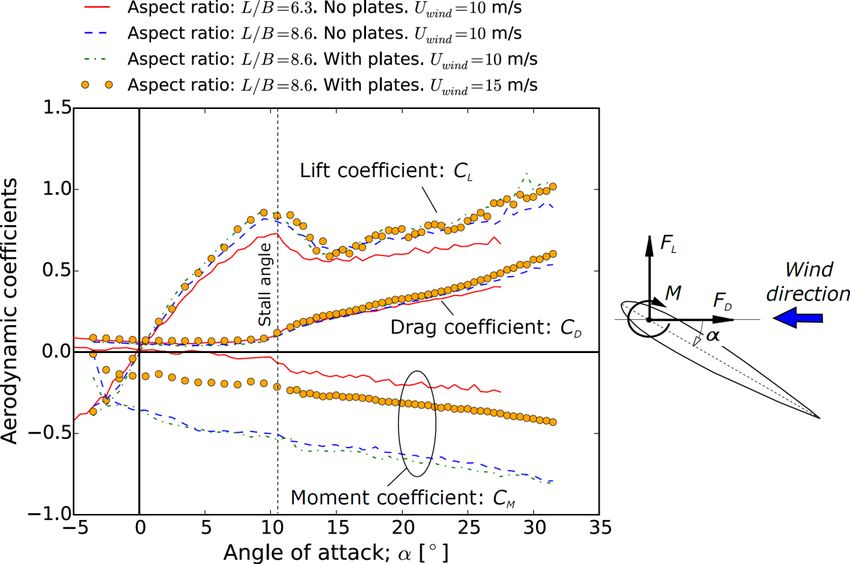
City, University of London Department for Transport

Two values were considered: ∞ = 10 and 15 m/s. Fig. 3 shows the influence of the wind speed on the
aerodynamic coefficients obtained in the shortest aerofoil along with the positive directions of the angle of
attack and the wind reactions measured in the balance. The results show a small effect of the wind speed, and
therefore of the Reynolds number, on the results. This gives confidence on the applicability of the aerodynamic
coefficients to different wind velocities.

Figure 3. Influence of the wind speed on the aerodynamic coefficients. Aerofoil model L/B = 6.3.

In the tests, a range of angles of attack of the wind (α) between -5 and 27-32o is considered. As it was mentioned,
the upper bound of α is limited by the stroke of the shaft-aerofoil connection in the setup of the WT, which allows
angles up to 27o in the shortest aerofoil and up to 32o in the longest one. The spacing between consecutive angles
during testing is 1o for angles below 12o, and 0.5o above 12o. The closely spaced data points aims at providing
detailed information about the aerodynamic effects of the aerofoil for large angles of attack. This range of angles
is not usually reported in previous works on aerofoil sections but it is essential in this study because the rails will
normally operate in these conditions.

Fig. 4 compares the results obtained with the two aerofoils. It is known that the aspect ratio affects the WT
results [5] and this influence is observed in the lift and in the moment coefficients. The latter is unreasonably
large for the longest aerofoil tested under 10 m/s. This is attributed to a testing problem and those results were
not considered. Fig. 4 also indicates that the effect of the end plates in the longest model is not significant.

9
City, University of London Department for Transport

Figure 4. Influence of the aspect ratio and the end plates on the aerodynamic coefficients. Aerofoil model L/B = 6.3.

The experimental results presented in Figs. 3 and 4 show that there is an angle of attack of the wind beyond
which the aerodynamic forces in the rail change significantly. This angle corresponds to the stall point and it is
approximately α = 11o in the NACA section tested. For lower angles of attack the flow streamlines next to the
aerofoil are predominantly attached to its contour and for this reason the drag is reduced whilst the lift increases
almost linearly by increasing α. However, increments of the angles of attack above the stall point and below α =
15o result in significant flow separations and turbulence downwind that reduce the lift but increase the drag and
the moment. For angles of attack between α = 15o and 30o the drag, lift and moment increase their magnitude
almost linearly by increasing α.

 3.3.2. Computational fluid dynamic analysis
A detailed CFD model was developed in the commercial software ANSYS Fluent [1] in order to visualize the wind
flow around the aerofoil rail for different angles of attack. This is based on the numerical solution of the fluid
dynamic equations in the wind domain. The domain is discretised with a mesh dominated by quadrilateral
elements to improve the accuracy of the results. The rail has been idealised as a static bi-dimensional obstacle in
this study. Fig. 5(a) shows the window in which the wind domain is defined, with the left vertical line being the
inlet where the flow velocity is imposed (the wind goes from left to right in these plots). The refined
discretisation downwind with respect to the obstacle is introduced to capture the effect of the vortices that may
be developed. The mesh is also refined around the perimeter of the rail in order to represent the boundary layer
developed in this region, as shown in Fig. 5(b). The size of the mesh and the window width was determined from
a sensitivity study conducted prior to the final analysis for different angles of attack (presented in Section 3.3.3).

10
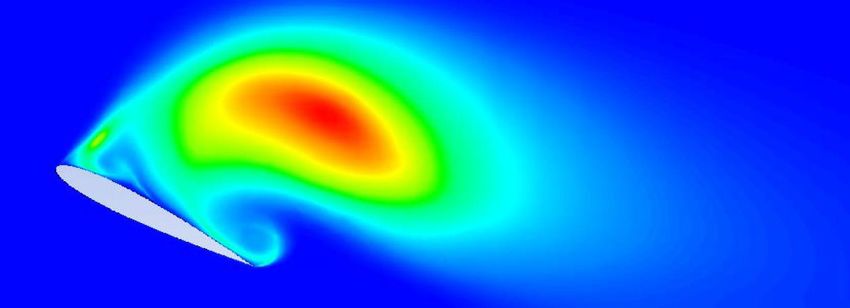
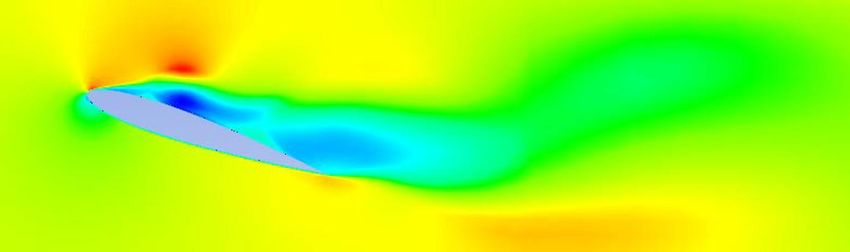
City, University of London Department for Transport

(a) General view of the CFD mesh and the wind domain.

(b) CFD Mesh around the aerofoil for a certain angle of attack of the wind.

Figure 5. CFD mesh defined in ANSYS Fluent.

The analysis was conducted considering the NACA 0013 aerofoil and a density of the air and wind speeds that
resemble those measured in the WT testing. Fig. 6 shows the velocity contour close to the aerofoil when the
angle of attack is 0o, i.e. when the barrier is fully open. It has been observed that for this angle of attack (and
generally below the stall point) the field of wind velocities in the entire domain is not dependent on the instant
of time that is considered. This is because the flow is not separated from the aerofoil when the angle of attack
is small and therefore there is no vortex shedding. However, the results obtained in ANSYS when α = 20o or 30o
clearly show flow separation and a frequency of vortex shedding, as it is illustrated in Figure 6(b) and (c),
respectively. This affects the aerodynamic coefficients of the rail and ultimately the response of the barrier. The
CFD results helped understanding the behaviour of the flow around the proposed wind barrier and they will be
developed further to include the movement of the rail and its interaction with the wind for different speed levels.

11
City, University of London Department for Transport

(a) Angle of attack α = 0o.

(b) Angle of attack α = 20o.

(c) Angle of attack α = 30o.

Figure 6. CFD results for different angles of attack. Figures (a) and (b) represent the normalised wind velocity fields
around the aerofoil. Figure (c) illustrates the turbulence field. In both cases the red colour represents the largest
value of the parameter measured in the wind flow, and the blue colour the lowest one. The results correspond to a
certain instant of the simulation.

12
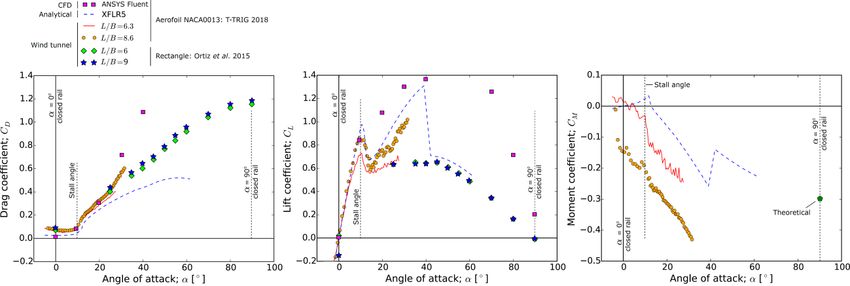
City, University of London Department for Transport

 3.3.3. Analytical results
The third method employed to obtain the aerodynamic coefficients is XFLR5 [2], which is valid if the flow is not
strongly separated from the aerofoil, i.e. for low angles of attack. However, the analysis is completed for angles
of attack ranging from –5 to 60o, to obtain a broad view of the aerodynamic forces and moments. Due to the
nature of the analysis conducted in XFLR5 these results are deemed to be accurate for angles of attack below
20o, whilst they represent an estimation above this value. The results are presented in the next Section.

 3.3.4. Comparison and selection of the aerodynamic coefficients
Fig. 7 includes the aerodynamic coefficients obtained in the experimental, numerical and analytical studies of the
NACA 0013 aerofoil. A close agreement is observed in the results obtained with the three methods for angles of
attack below the stall point, which occurs approximately at the same angle: α = 11o. XFLR5 captures reasonably
well the wind forces on the airfoil, even beyond the stall point, for which it was expected to be less accurate.
Due to the computational cost of the CFD analysis its results are only available with a spacing of 10o. The CFD
gives relatively large values of the drag and the lift for angles of attack between 40 o and 80o, compared to the
experimental and the analytical results. This may be due to the limitations of the solver employed to model the
turbulence shed by the rail for large angles of attack (the k-ω method was used). This will be explored further in
the future stages of the project by using other turbulence models. Nevertheless, the CFD results show that the
coefficients change significantly when α is between 40o and 50o, which is also observed in XFLR5 and needs to
be verified with experimental testing.

Figure 7. Comparison between the experimental (WT), numerical (CFD) and analytical (XFLR5) aerodynamic
coefficients. The WT results obtained by Ortiz et al. [5] are also included.

Figure 7 also includes the aerodynamic coefficients obtained experimentally (WT) in [5]. These results
correspond to panels of different aspect ratios with rectangular cross-section and were focused on large angles
of attack, above 25o. Despite the rectangular section is not streamlined as the aerofoil, the results are consistent
with those obtained experimentally and analytically in this work for the NACA 0013 aerofoil. This was expected
in the range of very large angles of attack because in that case the flow is fully separated regardless of the shape
of the section. However, the aerofoil section shows an interesting increment of the lift coupled with a reduction
of the moment coefficients for angles of attack close to 40 o, which is not observed in the rectangular section.
This has a significant impact in the traffic and in the bridge shielding with the proposed wind barriers, as it will
be explained in Section 3.4. In addition, the experimental results reported by the Sheldahi and Klimas [6] for
large angles of attack in different aerofoil sections of the NACA family were compared to the results obtained in
this work. Despite the NACA sections tested in [6] were not identical to the one considered in this work, the drag
and the lift coefficients match reasonably well.

13
City, University of London Department for Transport

Based on the results, the proposed relationship between the drag coefficient of the rail and the angle of attack
is taken from the experimental results obtained in the longest aerofoil (L/B = 8.6) up to α = 25o, beyond which
the results obtained in [5] are adopted. Likewise, due to the similarity between the experimental and the
analytical observations for the lift, the XFLR5 results are considered for CL when α is between 0 and 60o, and then
it is connected linearly with the theoretical result of CL = 0 when α = 90o. Finally, the moment coefficient obtained
in XFLR5 is considered below α = 60o and above this angle the moment is assumed to change linearly with α up
to a theoretical value of CM = CD (α = 90o) x 0.25 for α = 90o, where CD (α = 90o) = 1.18.

 3.4. Proposed analysis method for the smart barriers
Following the definition of the wind effects on the rail by means of its aerodynamic coefficients for different
angles of attack of the wind (α), the effect of the weight of the rail and the stiffness of the rail-post connection
were integrated in a novel analysis method based on the equilibrium of moments. For convenience, we define
the rotation angle of the rails θ as the inclination of the chord of the aerofoil with respect to the vertical, and
therefore:

 θ = 90o - α (4)

The analysis of a rail that can rotate with the wind pressure, as it is proposed in this study, needs to be iterative
because the rotation of the barriers under a predefined wind speed is initially unknown and it affects different
terms in the equilibrium equations that are required to obtain it. This represents a clear difference with the
analysis and design of conventional barriers. The analysis method that has been developed for this project is
summarised in Fig. 8.

Figure 8. Main steps in the algorithm developed to analyse the response of the rails in the proposed smart barriers.

14
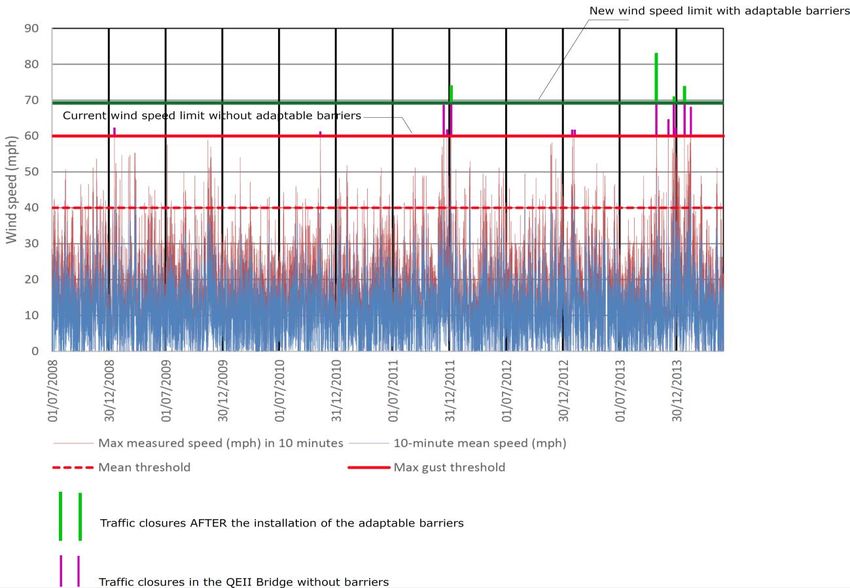
City, University of London Department for Transport

The algorithm described in Fig. 8 was implemented in MATLAB [3] and it was used to study the aerodynamic
forces in a 25-cm chord rail for different wind speed levels. An extensive parametric analysis using the proposed
methodology has been conducted to explore the influence of the mechanical properties of the rail (NACA 0013)
section on the aerodynamic response for different wind speeds. In total, more than 5,000 different rail-post
configurations have been considered in this study. It has been observed that by increasing the stiffness of the
rail-post connection (Kt) the rotation of the rail is reduced significantly and it makes the response closer to a
conventional barrier. The mass of the rail (Mr) has an analogous effect to Kt. The strong influence of these design
parameters suggests that it is possible to design the rail-post connection to achieve almost any critical wind
speed that may be required, which allows to satisfy the operational requirements of the bridge in which they are
equipped. This observation will be directly applied to the QEII Bridge in the next Section.

 3.5. Implementation to the Queen Elizabeth II Bridge
The application of the proposed barriers to the Queen Elizabeth II Bridge in Dartford is considered in this Section
by means of a tentative design based on the previous results. This bridge is a key part of the M25 that is used by
an average of 130,000 vehicles per day and it suffers from wind-driven traffic interruptions every year. The
authors liaised with HE and CPS, the QEII Bridge operator, to obtain information about the existing traffic
protocols in the structure. According to the information provided the traffic restriction protocols (vehicle speed
limitation and buffer lanes) are activated when the 3-s gust wind speed is 50 mph, and the Bridge is completely
closed to traffic when this speed exceeds 60 mph (regardless of its direction).

Fig. 9 presents the wind coefficients in two possible designs of the rails of the smart barriers in this structure.
Both solutions have 25-cm chord rails and different values of Kt and Mr that lead to critical wind speeds above
the current limit for which the Bridge is closed. Extending the maximum admissible wind velocity to the critical
wind speed of the barrier may be possible given the large shielding effect of the rail for lower speeds. In
particular, the second proposed solution could increase the operational limit of the QEII Bridge to wind speeds
of 31 m/s (69 mph). This represents an increment of only 15% in the wind speed limit, but according to the history
of traffic interruptions in the QEII Bridge it could reduce the number of traffic restrictions significantly.
 Sol. 1
 Sol. 2

Figure 9. Tentative application of the smart barriers to the QEII Bridge.

In order to explore the impact of these barriers in the traffic operation of the Bridge, the wind data reported by
the engineering firm COWI (former Flint & Neil) on this structure [7] was used. The records of wind speed and
direction were collected at the Bridge by the pair of anemometers at midspan for the period of 1st July 2008 to
31st May 2014. These records are shown in Fig. 10. Over the six years for which data was available, there were a

15
City, University of London Department for Transport

total of 14 storms in which the gust wind speed exceeded 60 mph and the Bridge was closed to traffic. However,
if the proposed adaptable barriers would have been installed in the Bridge the wind speed limit would be 69 mph
(or above) and this could have reduced the number of traffic closures from 2018 to 2014 by 70% (i.e. from 14 to
only 4 interruptions), as shown in Fig. 10. And more importantly, this benefit in the traffic operation of the Bridge
would be achieved without the need for strengthening the deck or the supports.

The disruption to the operation in the Bridge is not only due to the complete traffic closures. According to the
statistical analysis conducted in [7], the introduction of buffer lanes (at wind speeds of 55 mph) and the
restriction of the vehicle speed to 40-mph (at wind speeds of 50 mph) are 2.8 and 7.5 times more frequent than
the complete traffic interruptions in the Bridge, respectively. This leads to a significant number of days in which
the traffic is restricted in this important structure every year. If the smart barriers are installed there could be up
to 3 and 11 times per year in which the introduction of buffer lanes and the restriction of the vehicle velocity is
avoided, respectively, and this can be achieved ignoring the shielding effects of the smart barriers at
intermediate wind speeds levels (which have been observed in this study and could lead to further
improvements in the traffic operation).

More studies will be conducted to express the benefits of the barriers in terms of their potential increase of the
annual traffic capacity in the Bridge, which will be then translated to a revenue increase prediction. Nevertheless,
it is already clear that the smart barriers can represent a substantial improvement in the current operation of the
QEII Bridge with a minimum investment cost. This is because the cost of the adaptable barriers would be similar
to that of a conventional road barrier, and there is no need for strengthening the deck which represents the
largest component of the cost of wind-proofing in existing bridges.

Figure 10. QEII Bridge wind data records from 2008 to 2014 and effect of the application of the adaptable barriers.

16
City, University of London Department for Transport

Furthermore, it should be observed that the previous limit of 69 mph could be increased even further if, after
additional studies, the shielding effect provided by the barriers to the vehicles under relatively large rail rotations
is found to be acceptable from the point of view of the traffic stability. However, it needs be noted that this is a
preliminary study and the application of the smart barriers to the QEII Bridge needs detailed research on the
stability of the traffic and the structure under different wind speeds. To this end the authors will continue
working with HE and CPS on the wind-proofing of the QEII Bridge.

 4. Implementation to the UK transport network
The potential of the implementation of the proposed barriers to the UK transport network was demonstrated
in the previous section by means of a preliminary study in the QEII Bridge. The large-scale application of this
technology will target both new and existing bridges. Consequently, it can have a significant and positive impact
on the road safety and on the resilience of the UK infrastructure. The current collaboration developed in this
project with HE and CPS, major stakeholders involved in the wind-proofing of bridges in the UK, is likely to speed
up the development and the implementation of the proposed barriers in UK bridges. The following section
presents the route that is proposed to achieve this goal.

Regarding the costs related to the implementation of the smart barriers, the results obtained in this project show
that a detailed design of the rail cross-section along with special connections to the posts would allow to achieve
the required adaptability of the barriers without the need for any additional technology. Consequently, the cost
of manufacturing a smart barrier will be similar to that of a conventional barrier with fixed rails. The cost of
maintenance will be reduced but periodic inspections of the rail-post connections would be required.

 5. Next steps
This T-TRIG project was conceived as a proof-of-concept and, although important conclusions and knowledge
was gained from it, the technology readiness level of the technology is still low after its completion (TRL 3).
Before the barrier can be installed in real bridges the study should be continued with the following steps:

 1. Testing different section shapes for the rail and for a wider range of angles of attack. The authors were
 recently awarded (27th of June 2018) the first prize in the 2018 Enterprise Showcase Competition at CUoL
 to conduct this work. The award includes economical support (£25k) and collaboration with the
 Research and Enterprise Team towards the development and patenting of the barriers. The authors are
 very grateful to the T-TRIG team and to the DfT for their support to the current project, which was
 essential to win the Enterprise competition.
 2. Test the integrated rails-post system in the WT at CUoL and conduct numerical analysis on the vehicle
 driving stability and the bridge aerodynamic response. The work, to be conducted in 2019-2021, will be
 part of a larger project in which support from Innovate UK will be sought.

More details about the future steps to be completed in this project are included in the Appendix.

17
City, University of London Department for Transport

 6. Conclusions
This T-TRIG project concluded with a successful proof-of-concept for a new type of wind barriers in which
aerodynamic rails can rotate and adapt their shielding to different environmental scenarios. The work was
divided in three segments.

First, the wind forces on the rails were obtained experimentally, numerically and analytically, and these were
compared with experimental results obtained elsewhere in different sections. Very low drag forces were
observed when the proposed rails are in open position due to the aerodynamic shape of their aerofoil section.
However, when the rail is fully closed the response is analogous to that in rails with rectangular cross-sections.

The quasi-static wind forces were characterised by means of aerodynamic coefficients that were used in a novel
analysis methodology developed in this study. This methodology accounts for the stiffness of the rail-post
connection and the mass of the rail. It was implemented in MATLAB to conduct an extensive numerical analysis
of more than 5,000 different rails. The results demonstrated that the rail rotates adequately in a wide range of
wind speeds and there is a critical value of this velocity for which the wind force on the rail drops significantly.
Beyond the critical wind speed the barrier protects the bridge efficiently, as it was intended, and therefore it
needs to be established in relation to the wind speed limit beyond which the bridge equipped with the smart
barriers should be closed to traffic. It was observed that an optimum value of the critical wind speed can be
achieved by combining the effect of the rail-post connection and its mass.

Finally, the application of the smart barriers to the Queen Elizabeth II Bridge in Dartford was considered. Two
feasible designs of the rails of the barriers were proposed and the initial results indicated a potential increase of
the wind speed limit of 15% or more, which could reduce by 70% the traffic closures in this bottleneck point of the
UK road network with a relatively low investment.

Further development of the smart barriers is needed, including (1) wind tunnel testing of more sections and to a
wider range of angles of attack of the wind, (2) testing of the integrated rail-post prototype, and (3) numerical
analysis of the bridge and the traffic stability with the proposed smart barriers, among others. To this end, the
award received from CUoL in July 2018 will be used and support from Innovate UK will be sought. More details
about the further research projects derived from this work are included in the Appendix.

18
City, University of London Department for Transport

References
[1] ANSYS Fluent (2018). ANSYS Engineering Analysis System User's Manual. Houston.

[2] XFLR5 (2018). User Manual. http://www.xflr5.com/xflr5.htm

[3] MATLAB (2018), The MathWorks, Inc., Natick, Massachusetts, United States.

[4] Simiu E. and Scanlan R.H. (1996). Wind effects on structures: Fundamentals and applications to design. Third
Edition. John Wiley and Sons.

[5] Ortiz X., Rival D. and Wood D. (2015). Forces and moments on flat plates of small aspect ratio with application
to PV wind loads and small wind turbine blades. Energies, 8, 2438-2453; doi:10.3390/en8042438.

[6] Sheldahi R.E. and Klimas P.C. (1981). Aerodynamic characteristics of seven symmetrical airfoil sections
through 180-degree angle of attack for use in aerodynamic analysis of vertical axis wind turbines. Sandia National
Laboratories Energy Report. New Mexico (U.S.).

[7] Flint & Neill (2014). QEII Bridge closures under high wind. Report commissioned by Connect Plus Services.

[8] Camara A, Kavrakov I, Nguyen K and Morgenthal G. Influence of the road irregularity surface on the driving
safety and comfort in bridges under wind and traffic actions. To be submitted to Journal of Wind Engineering
and Industrial Aerodynamics in September 2018.

[9] Camara A, Jagadeesh C, Husain S, Polec P and Bush S (2018). Driving stability in the Queen Elizabeth II Bridge
under high winds. In 13th UK Conference on Wind Engineering, Leeds (UK).

[10] Kavrakov I, Camara A and Morgenthal G (2016). Influence of model assumptions of aerodynamic models on
the wind-vehicle-bridge interaction. In IABSE-2016 Symposium, Stockholm.

19
City, University of London Department for Transport

Appendix: Further research works
The present work demonstrated the feasibility and the potential of the smart wind barriers in the wind-proofing
of new and existing bridges. It also opened different research lines that will be explored in further research
works. These are listed below:

 a. Cross-sectional optimisation of the rails

A new connection between the rail and the wind tunnel is being developed to test the model at angles of attack
of up to 90o. A wide range of rail cross-sections will be first analysed with CFD and the best candidates will be
tested in the T2 wind tunnel at CUoL in 2018-2019.

 b. Material optimisation of the rails

In parallel with the previous cross-sectional study of the rails, the material(s) employed in their manufacturing
will also be considered from the points of view of structural performance, cost, sustainability and construction.

 c. Wind tunnel testing of the integrated rail-post prototype

The largest environmental wind tunnel at CUoL will be used to test the prototype of the barriers including the
optimised rails connected to a vertical post in which the special-purpose rail-post connection is modelled. This
will allow to explore the effect of the interaction between rails and the gust loading. The tests will also comply
with code provisions towards the future commercialisation of the barriers.

 d. Numerical analysis of the bridge and the traffic stability with the proposed smart barriers

Detailed dynamic analysis of the bridge and the traffic stability will be performed to assess the suitability of the
barriers in a wide range of wind speeds. To this end, the wind-vehicle-bridge interaction framework proposed by
the authors in [8,9,10] will be used in the QEII Bridge.

 e. Cost analysis of the smart barriers

The benefits of the wind barriers obtained in (d) will be compared with a thorough analysis of the costs of
equipping the QEII Bridge with this technology. These will include material, manufacturing, installation,
maintenance and possible deployment costs. The authors will liaise with Highways England and with CPS to this
end.

 f. Acoustic effects

The possibility of noise generation or absorption by the barriers needs to be considered for different wind speeds
and different orientation of the barriers.

 g. Energy harvesting

The natural wind-induced rotation of the barriers offers an excellent opportunity to harvest energy in a
considerable length of the bridge, whilst protecting it and the traffic from the environment. This will be explored
in the future.

 h. Application to railway bridges

The proposed technology is directly applicable to railway bridges. The effects of the smart barriers on the trains
and the bridges will be explored in the future.

20
You can also read