PROFITING FROM LIQUIDITY SHOCKS IN EQUITY MARKETS - March 2022 Dr Joseph Lai, CIO and Principal
←
→
Page content transcription
If your browser does not render page correctly, please read the page content below

PROFITING FROM
LIQUIDITY SHOCKS IN
EQUITY MARKETS

March 2022
Dr Joseph Lai, CIO and Principal

                                   1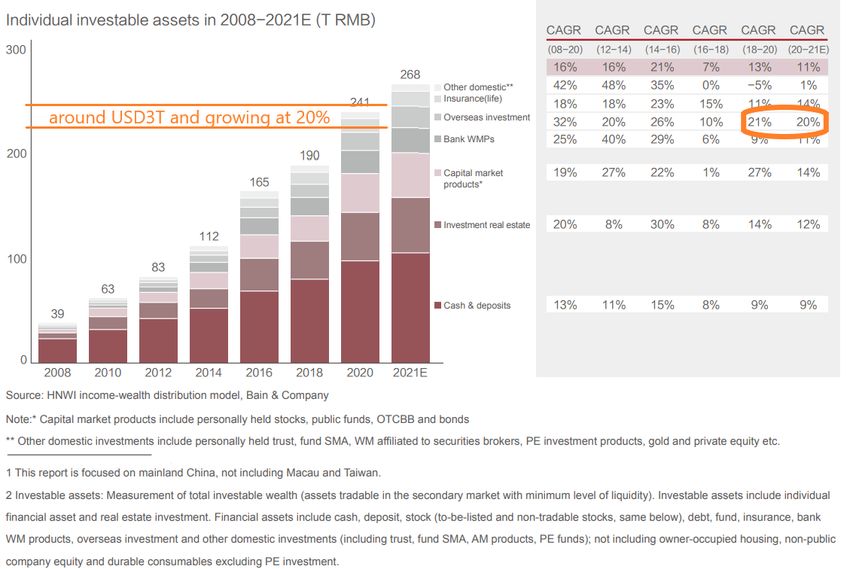
PROFITING FROM LIQUIDITY SHOCKS IN EQUITY
MARKETS

Executive Summary
Liquidity shocks in financial markets are pervasive and yet often misunderstood by
investors. As they are short term, are often self-correcting and regulators have
powerful incentives and tools to underwrite stability, having a robust understanding
of what causes them and how to recognize when they are occurring can lead to
powerful buying opportunities in equity markets.

This article will go through some of the recent history of liquidity shocks in both
developed and emerging markets. We will then present an in-depth case study of
why the recent volatility of the Hong Kong stock exchange and large cap Chinese
technology stocks – widely presumed to be about fundamental investor sentiment
towards China and Chinese government policy – has all the hallmarks of a classic
liquidity crunch. Similar analysis can be applied to ructions in the Chinese property
market. In both cases, the buying opportunity stemming from these situations is
compelling as short-term liquidity conditions stabilise, and markets are coming to
recognise this as well.

Contents
  A brief history of modern liquidity shocks in equity markets ............................................... 3
  March 2022 Hong Kong Stock Exchange price action: a classic liquidity crunch in
  disguise? ........................................................................................................................... 5
  The Chinese property market: a model deleveraging? ....................................................... 9
  The ‘realpolitik’ of sanctions and the outlook for China .................................................... 10
  How has Ox Capital responded throughout this period? .................................................. 12

                                                                                                                                       2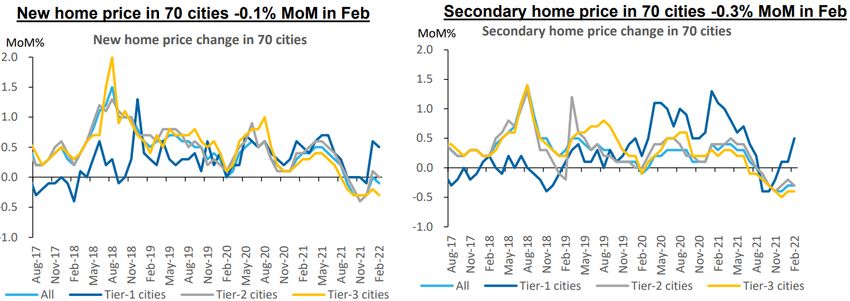
A brief history of modern liquidity shocks in equity markets
One of the major functions of the markets is price discovery. The interaction of supply and demand
leads to price equilibrium. In financial markets, the result is that prospective assets enjoy superior
valuations, while inferior ones are given lower valuations. A higher price obviously bestows asset
owners’ greater wealth, and more importantly, it reduces cost of funding for businesses. For example,
a stock on 30x price to earnings multiple can raise capital with significantly less dilution impact
compared to one that is on 10x price to earnings.

The price signal is crucial in markets, but it does not always operate perfectly. When it does not, it
means the market is not operating efficiently and does not drive the most optimal economic outcome
and therefore can be termed “market failure”.

Market failures in financial markets are often driven by too much or too little liquidity. The price
discovery mechanism is broken, and asset values diverge significantly from intrinsic values. When
liquidity is plentiful, as too many dollars are chasing after too few assets, the assets get overvalued.
The more sinister situation is when liquidity is scarce, all sellers and no bidders, leading to a collapse
of asset prices.

As noted by the Reserve Bank of Australia 1, in the ideal financial market all financial investors can
hedge all risks and liquidity can be priced in properly irrespective of economic situations. It then noted
that real world markets fall short. While liquid markets exist in normal times, liquidity can disappear on
short notice. Further, the availability of financial institutions willing to fund asset purchases can
evaporate quickly. As a result of these limitations, distressed or fire sales of assets can occur
leading to dramatic volatility. The price discovery mechanism can well and truly be broken.

In my experience, liquidity-driven panic is more common than one would expect. Negative news or
regulatory moves can dramatically raise the level of uncertainty for market participants. They then
change the way they participate in the market. Large investors that normally sell down positions
gradually to minimise price impact, may individually decide to fully exit positions at the same time.
This imposes huge sell pressure on the market, driving prices far below fundamental values. If the
assets are funded by debt, a significant movement in prices can trigger further selling (or margin
calls), and hence we see a self-reinforcing loss spiral. The buy liquidity can suddenly disappear even
in a highly liquid market.

In the global financial crisis of 2008, many financial markets were for all intents and purposes frozen.
Banks and other market participants simply did not know who they could trade with and who would be
solvent given the huge asset value decline linked to the housing market collapse in the US. The price
function was broken in modern piping of global finance.

The solution was a big bailout by the Central Banks to restore solvency and liquidity to the global
banking system. They purchased bad assets at high prices to make the system solvent, which was
needed to unseize the financial markets, giving much needed time for the system to heal. My belief
then was that it would work, and the banking system would function again, and the economy would
escape from an almost certain economic disaster.

The Indian demonetisation was another episode of illiquidity, except this time, the illiquidity played out
in the real economy. In 2016, the Indian Government decided to swap out old money notes circulating
in the economy with new notes. The aim was to fight counterfeit notes and flush out “black money” or
corrupt money from the system. The locals had to go to a bank, deposit the old money and withdraw
the new money. There was a limit as to how much new money could be withdrawn.

India was predominantly a cash economy and demonetisation meant that there was not enough cash
for the economy to function. Businesses could not pay wages, or purchase inventories and services.
The economy grinded to a halt as prognostication of a deep multi-year recession became widespread.
The negative sentiments further fed onto themselves, worsening business and consumer confidence.

1
  Allen F and E Carletti (2007), ‘Banks, Markets and Liquidity’, in C Kent and J Lawson (eds), The Structure and Resilience of
the Financial System, Proceedings of a Conference, Reserve Bank of Australia, Sydney, pp 201–218

                                                                                                                                 3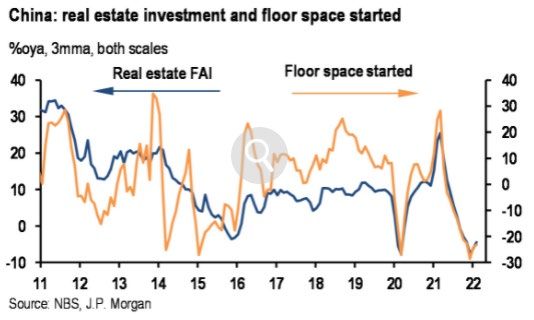
Associated with this was a fire-sale of the Indian stock market. I believed at the time that this would be
short-lived, as it was purely a liquidity crisis. As new legal tenders continued to be disbursed into the
real economy, and economic activity should eventually snap back along with the share market. India
just needed a bit more time.

Another episode of liquidity driven market failure took place recently in the nickel price market of the
London Metal Exchange (LME). The nickel price shot up from USD25,000 a ton to as high as
USD100,000 a ton within hours.

It was reported that the world’s biggest nickel producer, Tsingshan Holdings, got a USD1 billion
margin call for its hedging activities. It is not unusual for metals producers to participate in the futures
market to lock in prices, but in this case, the position Tsingshan had taken was very big.

One can imagine that with rocketing nickel prices, as Tsingshan and perhaps other nickel producers
tried to close off their hedge positions (by buying back their exposure), this pushed the prices even
more, a self-reinforcing loop.

Our work has led us to believe that there is a structural shortage of electric vehicle(EV) battery grade
nickel, and we are positioned for this outcome. However, we do not think nickel prices going from
USD25,000 to USD100,000 within hours is how markets normally operate. It simply does not reflect
the fundamentals.

In a well-functioning market, there would be sellers taking advantage of the inflated prices. But in this
case, the traders smelled blood knowing there are lots of operators trapped in scary and widening
loss making positions, looking to close their exposures by buying nickel futures.

This was a liquidity problem in the sense that the availability to sell vanished. The LME ended up
cancelling USD4 billion worth of trades and suspended trading. It is likely that not only has Tsingshan
Holding lost a lot of money, but other nickel producers or traders who were short these futures and
their associated brokers also lost billions. As the market has re-opened and the LME has
implemented ‘stop-loss’ measures to even-out the price readjustment, liquidity has returned and is
driving forward Nickel prices back down to more reasonable but still elevated levels.

                                                                                                           4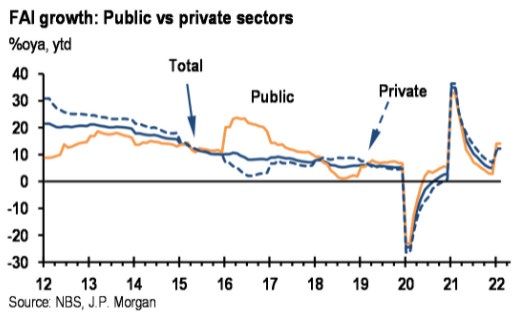
March 2022 Hong Kong Stock Exchange price action: a classic liquidity
crunch in disguise?
This brings us to the recent collapse in the Hong Kong market, the main topic of discussion here. The
Hong Kong market in recent weeks suffered a major liquidity crunch.

The Hong Kong Stock Market is normally a liquid market, with market capitalisation of around USD4
trillion. The Hong Kong market these days is predominantly made up of big Chinese companies. Big
internet companies like Tencent, Alibaba, Meituan have been local and foreign investor favourites on
the exchange.

The peculiar characteristic for the Hong Kong Stock Market is that the stocks are denominated in
Hong Kong Dollars which are pegged to the US Dollar. However, the corresponding businesses are
largely Chinese businesses that earn Chinese RMB. This appears a bit anachronistic and is ripe for
reform as China evolves with its capital account arrangements in the Greater Bay Area (GBA) which
contains China’s key trade and financial linkages with the rest of the world.

The GBA comprises nine cities in Guangdong and includes Hong Kong and Macau, all located around
the Pearl River Delta of China. If viewed as a country, GBA would be the world’s 11th largest
economy. It has a population of over 86 million, which is more than the UK and twice that of Canada
to put its size in perspective. The GBA is one China’s most economically vibrant regions, and it is in
fact home to the most Fortune 500 companies in the world at 135. Combining the unique financial
services capabilities of Hong Kong, Shenzhen’s innovative and technology focussed environment,
and Guangdong hinterland’s vast industrial prowess, it is shaping up to be a major technology and
finance hub of China, and perhaps the world. The capital account opening is a key piece of the long
term GBA plan. Easy access is provided for foreign investors to purchase Chinese assets, and GBA
residents to foreign financial products via various Connect programs that are expanding all the time.

The GBA plan will vastly transform the players in the Hong Kong equity market in the long term. For
now, the main participants in the Hong Kong market are mainly people with ready access to the HKD
or USD. These include US and global institutional investors, HK investors and Mainland Chinese
investors participating officially through the “Southbound Connect”, the official program that allows
Mainlanders to buy Hong Kong stocks through the HK Stock Exchange. Conceptually, this program
converts the investor’s Chinese RMB into HKD, and then buys Hong Kong stocks which are
denominated in HKD. There is an official limit on how much Chinese trade can go through the
Southbound each day. Southbound has been reasonably popular for Chinese investors in recent
years. Despite that, Southbound ownership of Hong Kong stocks is only about 10%.

Apart from the official Southbound channel, it is very likely that Mainlanders with money already
outside of China are participating in the Hong Kong market in a big way. This unofficial Chinese
wealth is immense. According to Bain and Co, Chinese overseas assets is a sizable USD3 trillion,
growing at 20% a year. With money already outside of China, they can easily access the Hong Kong
market.

                                                                                                       5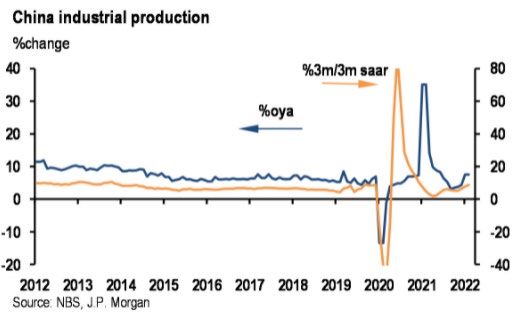
Total size of personal investable assets in 2008-2021E

As the RBA paper suggested, liquidity, or lack thereof, in financial markets can be a result of a
sudden rise in uncertainty. Sellers of assets who would normally sell down gradually can decide to
sell entire positions, at the same time. Further, not enough buyers exist to bid up the prices to their
true fundamental level.

There has been a lot of fear in the HK market recently, and not entirely unfounded. Fear that the
Chinese economy was slowing down, the authorities tightening on a range of industries in 2021
dampening business confidence, and more recently, there was looming concern over US sanctioning
China for their lack of position on Ukraine, and the potential for the Chinese American Depository
Receipts (ADRs) to be kicked out of the US markets. The fear of holding assets that they may have to
sell quickly because of US sanctions is fresh in the minds of institutional investors after recent the
Russian experience.

The market started collapsing mid-March as the mood turned pervasively negative. A US bulge
bracket broking firm downgraded all Chinese internet stocks with a title “China Internet: Unattractive,
with no valuation support in the near term but potential multi-baggers2”, basically saying valuation is
very cheap, but it matters not because they will keep falling.

As a result, US fund managers wanted to sell, and not enough Chinese Mainland investors were able
to buy.

As stock prices dropped roughly 10% a day, it generated a negative spiral. Investors not initially
wanting to sell, sold to cut their losses. Investors who owned stocks on margins got big margin calls
and were forced to sell. This negativity fed onto itself, leading to shrinkage of buy liquidity and
ultimately a fire sale of Chinese assets.

Tencent, a crowd favourite and an extremely strong Chinese internet company, fell to low of 19x
earnings, and Alibaba fell to 9x earnings. Very low valuations for such bellwether stocks!

2
 Alex Yao, China Internet: Unattractive, with no valuation support in the near term but potential multi-baggers, J.P. Morgan,
March 2022

                                                                                                                                6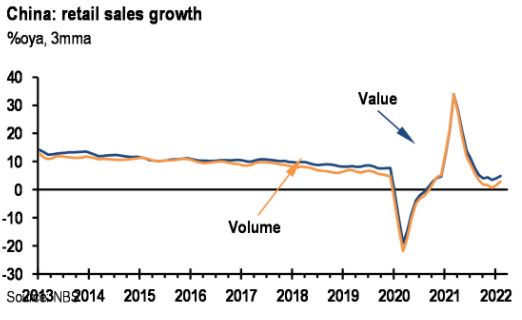
Tencent

Alibaba

We have come up with a table of Chinese internet companies. Many of the market capitalisations of
these companies can be covered in part or entirely by their net cash and investments (not marked to
market) on their balance sheets! If we revalue these investments to market, these stocks will look
even cheaper. Most have significant growth prospects, and most have fallen to single digit or even
negative EV/EBITDA.

                                                       Latest (USD)                       Growth    EBITDA                       EV/EBITDA
18/03/22             Comparable        Price   MV $bn Cash (Net) Investments Associates                  2021    2022    2023          2023
Alibaba              Amazon            100.4      270           57        41         34       12%         20.2    21.1   24.3            8.7
Tencent              Electronic Arts   381.0      466          -10        74         59       16%         27.3    29.3   33.0           14.4
JD.com               Amazon             61.9        96          24         3         10       17%          3.1     4.9     6.9          10.5
VIPS                 TJ Maxx             7.8       5.3         2.9       0.4        0.4        4%          1.2     1.2     1.4           1.7
Weibo                Twitter            24.2       5.7         0.7       1.2        0.5        9%          0.9     0.8     0.9           5.7
Tencent Music        Spotify             4.2       7.1         1.6       1.8        0.6        5%          0.7     0.6     0.8           6.8
Dada                 Doordash            8.7       2.3         0.2       0.1          0       45%        -0.31   -0.12   0.13           15.7
Hello Group          Match Group         7.0       1.4         1.4       0.9        0.1        1%         0.39    0.27   0.34           -0.1
Ping An Healthcare   Teladoc            19.5       2.8         1.6       0.5        0.1       12%         -0.3    -0.2    -0.1         -10.6
AK Medical           Stryker             4.5       0.6       0.14        0.0        0.0       24%
3sBio                Amgen               6.0       1.9         0.3       0.1        0.1       16%          0.4     0.4     0.5           3.1
Chinasoft            Accenture           6.6       2.5         0.1         0        0.0       28%         0.28    0.35    0.44           5.4
OneConnect           Verisk/Temenos      1.3       0.5         0.5       0.1        0.0       15%         -0.2    -0.1     0.0          -0.5
Bairong              Upstart             9.5       0.6         0.6         0          0       29%         0.05    0.05    0.07          -0.1
Chanjet              Intuit              7.4       0.3         0.2         0          0       30%        -0.04   -0.03   -0.03          -4.0
360 Digitech         Upstart            15.5       2.4           1         0          0        5%
PagSeguro            Fintech            14.6       4.9         0.4         0          0       29%        0.56    0.70    0.93            4.8
Hypera               EM consumer        34.5       4.2        -0.9         0          0       15%        0.40    0.46    0.53            9.6
Americanas           Walmart online     24.6       4.4        -1.8       1.4          0       23%        0.59    0.84    1.04            5.9
Source: Ox Capital Research. Prices as of 17 Mar 2022

                                                                                                                                          7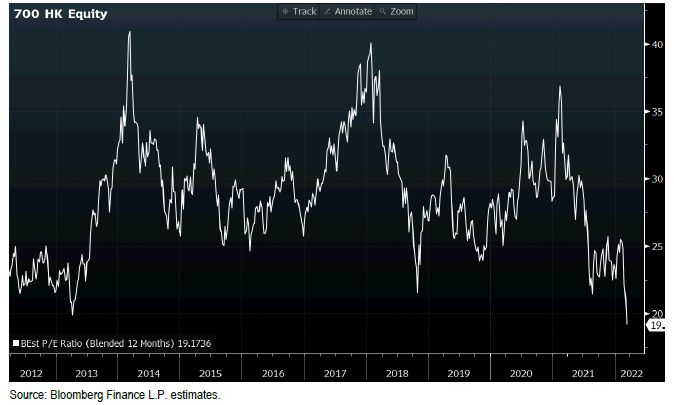
Further, the fundamentals of the Chinese economy were worlds apart from what was suggested by
the stock prices. While the Chinese economy is not booming, it is far from entering into a major
economic bust.

Industrial production is steady.

The services index is also steady.

Investment is picking up gradually after tightening in 2021.

                                                                                                   8
Retail has been weak because of the 2021 credit tightening, but credit is gradually getting relaxed
again in 2022.

The Chinese property market: a model deleveraging?
The Chinese property market went through a “stress-test” in 2021. The authorities cracked down on
indebted developers by denying bank funding and presale proceeds to them. For instance, it took
banks around six months to disperse their mortgage loans to developers and credit limit for
developers was extremely tight. This led to very tight cashflow situations for all developers. Despite
this episode of ultra-tightening, only a handful of major developers ran into serious financial troubles.
In spite of significant tightening on mortgages, the Chinese property prices only went back to roughly
pre-COVID levels. One could perhaps argue that squeezing out the COVID stimulus-driven property
bubble was good policy.

The authorities have started to loosen again. This is obviously welcomed by developers, but this time,
no one is under the illusion that the intention is to trigger another property price boom. The initial
result is encouraging. Property transaction volumes is yet to pick up significantly, but prices have
stopped their decline and is in fact picking up in the bigger, more economically vibrant cities.

Source: NBS, Macquarie Research

                                                                                                            9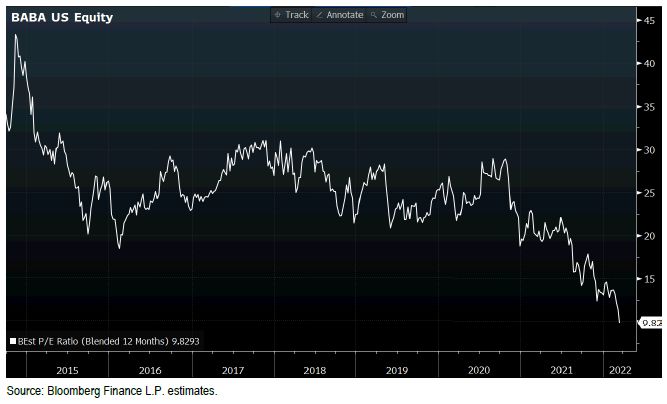
Real Residential
    Index
    (2009=100)
    220

    200

    180

    160

    140

    120

    100

     80
          Apr-11

          Oct-13

          Apr-16

          Oct-18

          Apr-21
          Jan-10
          Jun-10

          Jan-15
          Jun-15

          Jan-20
          Jun-20
          Mar-09

          Mar-14

          Mar-19
          Feb-12

          Feb-17
          Aug-09

          Nov-10

          Sep-11

          Dec-12

          Aug-14

          Nov-15

          Sep-16

          Dec-17

          Aug-19

          Nov-20

          Sep-21
          May-13

          May-18
           Jul-12

           Jul-17  Emerging Economies             Advanced Economies             Australia
                   China                          India                          New Zealand
                   United States
Real property price index according to the Bank of International Settlements.

It may surprise many that China’s property prices in real terms - that is price rise minus inflation - have
been lagging that of most other countries. This is consistent with my personal experience investing in
properties in China. While properties prices have appreciated greatly, the economy has also grown
out of sight in the last two decades. The reality is that China is one of the few economies in the world
that has consistently cracked down on property speculation, hence, kept a lid on prices.

The risk for the Chinese property market is not falling prices, but volume contraction. As cities mature,
fewer new properties demanded can lead to a slowdown in construction activities. However, it is
unlikely to be an abrupt drop, as urbanisation is continuing. A gradual shrinkage of new property
construction is to be expected going forward.

The ‘realpolitik’ of sanctions and the outlook for China
While the fundamentals do not justify the fire-sale equity prices seen in Hong Kong, market failure
driven by illiquidity was very real. The only semi-real concern that can justify the large surge in
illiquidity was US sanctioning of China.

We believed that the most likely worst-case scenario was limited sanctions from the US on China.
The Chinese authorities must know the huge costs of supporting Russia overtly. This would
overwhelm any medium-term gain Russia can provide for China. The Chinese economy is 17x the
size of that of Russia, and it has much broader trade and investment linkages to the rest of the world.

“China is in the centre of global trade. It accounts for 27% of global manufacturing value added output
– close to double (1.7x) the U.S., and almost three times (2.8x) Japan”, according to a report
published in 2019 by SWIFT3. The numbers would be even bigger now in 2022. Despite being the
biggest exporter in the world, Chinese exports grew a remarkable 20% plus in 2021.

3
 Beyond Borders: China opens up to the world, The effects of globalisation on China and Belt and Road countries. SWIFT
Special Edition, July 2019.

                                                                                                                         10
Trade between the European Union and China topped USD800 billion last year, and US-China trade
was over USD750 billion. In 2021, China’s gross domestic product was USD17.7 trillion, compared to
the US at USD22.9 trillion, and the Eurozone at USD17.1 trillion. Cutting China off financially from the
rest of the world would be a catastrophe for the global economy. It is especially not opportune as
many advanced economies are already battling with huge inflationary pressures.
In our view, it was far from clear that secondary sanctions were forthcoming, and even if they did
come, they would be far narrower in scope than what we have seen to those applied to Russia.
As foreign investors sold out of Hong Kong shares, Chinese investors stepped in - Southbound flow
from mainland Chinese investors to Hong Kong picked up significantly in recent weeks. However, the
volume of Southbound flow was not sufficient to offset the selling pressure and stock prices declined.
As share prices were very depressed, Mainland investors with money offshore would likely be
tempted to start buying from the distressed sellers. Marquee stocks like Alibaba were on a fire-sale
price of 8-9x P/E multiples. At sufficiently low prices, there was always going to be liquidity support,
we believed.
Southbound Gross Buy Flow
(Each exchange has a limit of 40B RMB daily limit)
30
25
20
HKD B
15
10
5
0
12-Jan-22
17-Jan-22
22-Jan-22
27-Jan-22
03-Mar-22
08-Mar-22
13-Mar-22
01-Feb-22
06-Feb-22
11-Feb-22
16-Feb-22
21-Feb-22
26-Feb-22
Shanghai Shenzhen
Source: Hong Kong Stock Exchange and Ox Capital Research
We believed that staying silent was not good policy from the perspective of the Chinese regulators.
Letting the uncertainties fester further would risk the chaos of the Hong Kong equity market
contaminating other Chinese asset markets and in turn, the real economy through decaying business
confidence.
Regulators could do a range of things to stave off the spiraling market despair.
The first is to reduce the uncertainty by credibly informing the markets that the regulator has finished
regulating and cracking down on industries, and that it would support entrepreneurship and economic
growth going forward. Second, the authorities could implement a “Fed put”, hinting that the equity
market was indeed important from the regulators’ perspective. Third, the regulators could relax
property policies further.
Fourth, China’s strict COVID lockdown measures could be incrementally relaxed. The COVID policies
so far have been effective in containing the spread of the pandemic and deaths within China, but have
imposed significant costs to economic activities. Given the shifting cost-benefits resulting from a
higher vaccination rate and less pathogenic strain, COVID policy could be loosened somewhat.
11Fifth, the authorities could announce an expansion of the Southbound program. Sixth, the
Government could encourage and indeed support administratively if needed the listed companies to
buy back shares. Lastly, the authorities could come out to clearly state that they would not actively
support the Russia war efforts, reducing the likelihood of US sanctions.
One of the most senior Chinese Government officials, Liu He, met with various business leaders and
announced many of the above-mentioned pro-business measures. COVID restrictions were
incrementally loosened, although remained relatively tight. President Xi also had an almost two-hour
video meeting with President Biden over the weekend. Given the publicity in both China and US about
this meeting and feedback from various sources, we believe that agreements would have been
reached between the two nations. Some companies announced share buybacks.
With confidence and therefore liquidity returning, the Hong Kong stock market was up close to 20% in
just a couple of days. More dramatically, the Chinese internet stocks went up 40% in one day from
depressed levels!
How has Ox Capital responded throughout this period?
Times like these are what active equities management is about - taking action with deliberation and
resolve. We followed our process of looking for quality growing businesses, made reasonable
assessment of the market environment, and exploited market inefficiencies when they presented.
Before the Government announcements at noon 16 March, we removed most of our downside
protection and significantly added back our favourite stocks that had sold off 20-40% in the preceding
week.
At Ox Capital, we believed that the rout in equities was simply a result of market failure driven by
illiquidity. The probability of government intervention through pro-market measures were high. Hence,
the market was very cheap, and we sought to take advantage of this.
The discipline to identify quality long term growth businesses and to buy them when they are on fire
sale prices is the crux of our investment process. We believe that having the discipline and
experience in implementing our process can help weather short term volatility and generate significant
long term returns for our clients.
MORE INFORMATION
www.oxcapm.com
Fidante Partners Investor Services | p: 13 51 53 | e: info@fidante.com.au | w: www.fidante.com.au
Fidante Partners Adviser Services | p: 1800 195 853 | e: bdm@fidante.com.au | w: www.fidante.com.au
This material has been prepared by Ox Capital Management Pty Ltd (ABN 60 648 887 914 AFSL 533828) (OxCap). It is
general information only and is not intended to provide you with financial advice or take into account your objectives, financial
situation or needs. To the extent permitted by law, no liability is accepted for any loss or damage as a result of any reliance on
this information. Any projections are based on assumptions which we believe are reasonable but are subject to change and
should not be relied upon. Past performance is not a reliable indicator of future performance. Neither any particular rate of
return nor capital invested are guaranteed.
12You can also read