Processing of Hollow Glass Microspheres (HGM) filled Epoxy Syntactic Foam Composites with improved Structural Characteristics
←
→
Page content transcription
If your browser does not render page correctly, please read the page content below
Sci Eng Compos Mater 2021; 28:116–127

Research Article

Olusegun A. Afolabi, Krishnan Kanny, and T. P Mohan*

Processing of Hollow Glass Microspheres (HGM)
filled Epoxy Syntactic Foam Composites with
improved Structural Characteristics
https://doi.org/10.1515/secm-2021-0011                            This HGM is embedded in a polymer material to form syntac-
Received Aug 10, 2020; accepted Nov 30, 2020                      tic foam composites. The hollow particles may sometimes
                                                                  be in the form of metal, carbon, ceramics, or polymer [1, 3].
Abstract: The objective of this work is to improve the struc-
                                                                  Furthermore, thermoset resins such as epoxy are generally
tural characteristics of hollow glass microsphere (HGM)
                                                                  used as a binder for combining of microballoons, which pro-
filled epoxy syntactic foam composites with little voids con-
                                                                  duces composite material with improved properties. Com-
tent and improved HGM dispersion in the composite.
                                                                  posite material developed from this combination is widely
A modified degassing technique has been introduced dur-
                                                                  used in structural applications due to its low cost, excellent
ing resin casting process of the HGM filled syntactic foam
                                                                  specific strength, and ease of processing [4, 5].
composites. The effect of HGM content volume fractions
                                                                       There is a need to produce a lightweight material for the
(5-25%) on the degassing techniques was examined. The
                                                                  structural application that is economically friendly and fire
syntactic foam composites were characterized by analysing
                                                                  retardant. Syntactic foams have been studied to fit into this
structural morphology using Scanning Electron Microscopy
                                                                  aspect because they are known to be of good advantages
(SEM), Transmission Electron Microscopy(TEM), and den-
                                                                  for construction purposes due to their reduced weight thus
sity measurements (theoretical and experimental).
                                                                  making them applicable as core materials for structural
Less than 5% void content has been achieved in this study.
                                                                  and marine applications [6]. The use of HGM and their syn-
This resulted in improved tensile and dynamic mechanical
                                                                  ergistic effect as filler in syntactic foam composites gives
properties (DMA).
                                                                  lightweight, resistances to bending, compressive stress and
Keywords: Hollow glass microsphere (HGM), syntactic low thermal conductivity exceeding other foams [5–7].
foam, tensile properties, degassing, fracture mechanism                Syntactic foam is a composite material which exhibits
                                                                  the same density before and after curing. Such low-density
                                                                  syntactic foam is employed in composite tooling for the
                                                                  manufacturing of aerospace structures [1, 5, 6]. Numer-
1 Introduction
                                                                  ous studies have reported significant improvement in the
                                                                  mechanical properties of syntactic foam by changing the
Syntactic foam composites forms cellular structure and are
                                                                  amount of filler particles. It was also noted that the prop-
entirely different from the commonly used foams such as
                                                                  erties of the resulting syntactic foam composites are en-
polyvinyl chloride (PVC) and poly urethane (PU), geopoly-
                                                                  hanced by a strong interfacial bonding between the HGM
mer foam because of their isotropic nature and random-
                                                                  filler and the polymer matrix. They are known to possess
ness of their microstructure [1, 2]. Thermoset resins such
                                                                  good impact behavior, low density, excellent compressive,
as epoxy are commonly used as binder or matrix and are
                                                                  flexural, hydrostatic, corrosive and tensile strength [5, 6, 8–
widely used in structural applications and in adhesives.
                                                                  16]. The attention of scholars has recently been drawn to
Hollow glass microspheres (HGM) are one of the common
                                                                  its functionality and usage due to its low moisture absorp-
microballoons used for the development of syntactic foam.
                                                                  tion, good energy absorption, low weight and high specific
                                                                  strength which has made it applicable to most construction,
                                                                  transportation, machinery and aerospace industries [17–
*Corresponding Author: T. P Mohan: Composite Research Group       20]. Also, hollow glass microsphere syntactic foams are
(CRG), Department of Mechanical Engineering, Durban University of
                                                                  good material for electronic purposes because of their ex-
Technology. Durban, South Africa; Email: mohanp@dut.ac.za
Olusegun A. Afolabi, Krishnan Kanny: Composite Research Group cellent dielectric constant [Dinesh Pinisetty], their excel-
(CRG), Department of Mechanical Engineering, Durban University of lent temperature resistance nature makes them suitable for
Technology. Durban, South Africa

  Open Access. © 2021 O. A. Afolabi et al., published by De Gruyter.       This work is licensed under the Creative Commons Attribution
4.0 License
Influence of reduced void fraction on syntactic foam composites using degassing processing method | 117
buoyancy materials such as in the deep sea exploration or Step 1: Mixing and Degassing
underwater resistance operation [21], they equally possess Syntactic foam composites were fabricated by mixing (me-
good heat-resistance ability when mixed with an inorganic chanically) epoxy resin and the desired volume fraction of
adhesive binder matrix which is applicable for the nose cap hollow glass microspheres in a glass beaker. The mixture
of NASA/Marshall Space Flight [22], likewise, they can be was thoroughly stirred for 30 min to obtain uniform slurry
suitable for high-temperature materials that are lightweight and a homogenous solution in order to reduce agglomera-
in nature for structural purposes [23]. tion. The viscosity of the matrix (epoxy resin) was lowered
One of the important parameters that are not properly by heating it up to 60∘ C for 1 hour. Thereafter, hardener
studied in HGM filled syntactic foam composites is void was gently added to it and mixed thoroughly. During me-
content. Void content in HGM foam composites plays a very chanical mixing of composites, air bubbles were entrapped
important role on the tensile and dynamic properties. Even which led to open cell structure porosity called voids [24].
at 2.5% increased in void content could reduce the tensile The epoxy-resin and hardener ratio were 10:3 and hollow
and DMA properties by 15-20%. Maximizing the void con- glass microsphere volume fraction was added for each sam-
tent in HGM syntactic foam composites is important as the ple preparation. The volume fraction of hollow glass micro-
HGM itself is a hollow void structure. Therefore the pres- spheres was varied from 5 to 25%.
ence of void in composite further completes and induces
and induce detrimental properties. The literature study also
shows that HGM filled foam composites resulted in up to Step II: Curing
10% void content, in addition of inherent HGM void. Most of This mixture was cast in the silicon mold made from mold
the voids occurred during composite processing resulting max “30-part A” and mold max “30 STD catalyst part B”
in poor tensile strength. Therefore, a more efficient way of purchased from AMT composites as well. Silicon grease
reducing the void content in the processing method of syn- was used to coat the mold surfaces to ensure easy removal
tactic foam was adopted in this present work as the main of syntactic foam slab after curing. The syntactic foam slab
area of interest. This study focusses on reducing the void was cured at room temperature (27∘ C) for 24 hours and then
content by a modified resin casting method. In this method, post cured at 80±5∘ C for 4 h. Tensile test specimens were
a degassing procedure is introduced as an intermediate pro- cut from the cured slabs using a fixed bench blade tile saw.
cessing step to eliminate voids before using of epoxy resin
which resulted in good mechanical and thermal properties
of the syntactic foam which is the novelty of the study. Ad- 2.3 SEM, TEM and DMA
ditionally, the resultant composite was tested for density
(experimental and theoretical), tensile and DMA properties Scanning Electron Microscopy (SEM) was used to investi-
and were discussed. gate the fracture surfaces and morphology of the syntactic
foam composites. The fractured tensile and flexural speci-
mens were examined using a Zeiss EVO 1 HD 15 Oxford in-
strument X-max scanning electron microscope (SEM). The
2 Experimental procedures specimens were gold coated before the SEM was conducted
because the syntactic foams are not conductive and there
2.1 Materials is need for the flow of electron for the fracture images to be
seen properly, this was done by Quorum Q 150R ES machine
Epoxy resin LR 20 and hardener LR 281 were purchased for 6 minutes. The Transmission Electron Microscopy (TEM)
from AMT composites, South Africa. The Hollow Glass Mi- was conducted using higher resolution (HR-TEM) Joel 2100,
croballoons (HGM-T60) filler was procured from Anhui Elite from Japan.
Industrial Cop, Limited, Hong Kong Elite Industrial Group The Thermogravimetric Analysis TA (Model Q800
Limited, China (T60 trade name). The density of the HGM V20.6) instrument was used to perform the Dynamic Me-
is 0.6g/cm3 with 10-60µm particle sizes. chanical Analysis of the syntactic foam composites. The
specimens used were measured according to ASTM D4065
standard 56mm x 12mm x 3mm in length, width and thick-
2.2 Processing ness respectively. The tests were run in a 3-point bending
mode on a support span length of 50mm with heating tem-
The processing for the fabrication of epoxy resin (EP) / HGM perature ranging from 20∘ C to 200∘ C at a frequency of 10Hz,
filled foam composites (EPT60) was carried out in two steps: rate of 3∘ C/min and amplitude of 20 µm. Minimum tempera-118 | O. A. Afolabi et al.
ture lag occurred between the sample and the furnace envi- was seen during the mixture with matrix resin at various
ronment as a result of maintaining the parameters through- percentage concentrations (5%-25%) designated as (0.5%-
out the test. 2.5%) in the TEM and SEM images.
2.4 Tensile Testing, and Density 3.1.2 Transmission Electron Microscopy (TEM)
measurement
The distribution of HGM sizes inside matrix resin was fur-
Specimens for tensile and flexural properties were prepared ther investigated using transmission electron microscopy
in accordance to ASTM D 3039 and ASTM D790-02 test stan- (TEM). The TEM images in Figure 2 (a-e) represent the distri-
dard specifications respectively. MTS 793 servo-hydraulic bution of HGM in the epoxy resin at different specifications.
machine with a load cell of 100 KN and a test speed of 2 There was an uneven distribution of HGM filler in the matrix
mm/min was used. The length, width and thickness for the resin as the concentration increases from 5% to 25%, which
tensile samples were 250mm × 25mm × 3mm respectively. affected the mechanical properties of the syntactic foam
Five specimens were tested from each syntactic foam sam- composites and contributed to an increase in the porosity
ple and their mean values were used to calculate the final level of the EPT60 syntactic foam composites. Figure 2 (a
results. and b) shows little or no agglomeration of the HGM due to
lower concentration. The agglomeration increased as the
concentration increased as seen in Figure 2 (c-e) with much
clustering and percolation of HGM at 25% (Figure 2e).
3 Results and Discussion
3.1 Structures and Morphology 3.2 Density and Void Measurement of
Syntactic Foam Composite
3.1.1 Scanning Electron Microscopy (SEM)
Based on the rule of mixture, the theoretical density values
Figure 1 (a and b) shows the nature of the HGM and struc- for HGM filled syntactic foam composites can be obtained.
ture under scanning electron microscopy (SEM) at differ- Theoretical density values are calculated using equation (1),
ent magnifications. Different sizes of the HGM were seen while measured density was determined using ASTM C271-
through the microscopy ranging from 10µm to 60µm. The 94, with specimen specification of 25 × 25 × 12.5 mm3 . Three
image output was adjusted by using gold to sputter the sur- specimens each were cut and measured accordingly with
face before the scanning process. The effect of these sizes the mean value recorded. The value for the void volume
(a) (b)
Figure 1: Microstructure of Hollow Glass Microsphere: (a) and (b) are Scanning Electron Microscopy (SEM) images showing different magnifi-
cation of HGM at 10µm and 100 µm respectively.Influence of reduced void fraction on syntactic foam composites using degassing processing method | 119
(a) 0.5% (b) 1.0% (c) 1.5%
(d) 2.0% (e) 2.5%
Figure 2: Transmission electron microscopy (TEM) images showing the clustered particles of the hollow glass microspheres dispersed in
the syntactic foam composite at each volume fraction.
fraction also known as matrix porosity was calculated by than the theoretical densities [25–28] for all the weight frac-
estimating the difference between the theoretical density tions of HGM. Void fraction and HGM porosities have been
(ρ t ) and the measured density (ρ m ) using equation (1). studied to be undesired and should be kept to the mini-
ρ − ρm mum level because its presence can lead to modulus and
δ= t · 100 (1)
ρt strength reduction in syntactic foams [29]. The void fraction
The theoretical density (ρ t ), the measured density ρ m and which is higher than the measured and theoretical densi-
the void volume fraction (δ) are presented in Table 1. The ties of the syntactic foams can also be responsible for an
density of the EPT60 syntactic foam composite increases increase in moisture absorption of the syntactic foam com-
compared with the HGM filler due to proper interaction posites [17, 30] which can cause diffusion in the foam spec-
between the constituent elements but shows decreasing imen structure and get accumulated in the matrix porosity
values for both measured and theoretical densities as the region.
HGM volume fraction increases. This corresponds to the re- Table 1 shows the values of the measured densities
port of Yingjie et al. [25] where the values of the measured and theoretical densities as it relates to the void fraction in
and theoretical densities decrease with increasing HGM the syntactic foam filled with HGM composites. The void
content. The measured densities were found to be lower fraction increased with an increase in the filler content,
Table 1: The density and porosity (void) values of syntactic foam composites.
Specimen name Volume fraction of HGM (%) Density of the composite (g/cm3 ) Void fraction of Composite (%)
Theoretical Measured
EPT60-1 0 1.150 1.120 2.61
EPT60-2 5 1.145 1.122 2.01
EPT60-3 10 1.140 1.110 2.63
EPT60-4 15 1.135 1.105 2.64
EPT60-5 20 1.131 1.096 3.09
EPT60-6 25 1.126 1.075 4.53120 | O. A. Afolabi et al.
Table 2: Comparison of density and porosity (void) values of syntactic foam composites based on the present work and existing literatures.
S/no Matrix type Composition of Theoretical Measured Void Reference
HGM and type density (ρ t ) density (ρ m ) fraction δ
(g/cm3 ) (g/cm3 ) (%)
1 Epoxy resin LR20 — 1.150 1.120 2.61 Present work
2 Epoxy resin LR20 5% HGM-T60 1.145 1.122 2.01
3 Epoxy resin LR20 10% HGM-T60 1.140 1.110 2.63
4 Epoxy resin LR20 15% HGM-T60 1.135 1.105 2.64
5 Epoxy resin LR20 20% HGM-T60 1.131 1.096 3.09
6 Epoxy resin LR20 25% HGM-T60 1.126 1.075 4.53
7 Vinyl ester VE — 0.116 - - [33]
8 Vinyl ester VE 30% HGM-K46 0.951 0.905 4.8
9 Vinyl ester VE 40% HGM-K46 0.881 0.798 9.3
10 Vinyl ester VE 50% HGM-K46 0.811 0.811 0.0
11 Vinyl ester VE 60% HGM-K46 0.740 0.655 11.4
12 Epoxy resin E51 47% HGM-S38 0.593 0.536 9.6 [25]
13 Epoxy resin E51 49% HGM-S38 0.580 0.522 10.0
14 Epoxy resin E51 51% HGM-S38 0.569 0.509 10.5
15 Epoxy resin E51 53% HGM-S38 0.558 0.498 10.7
16 Epoxy resin E51 55% HGM-S38 0.547 0.488 10.8
17 Epoxy resin E51 57% HGM-S38 0.536 0.474 11.6
18 Epoxy resin DER 332 — 1.165 1.160 0.4 [34]
19 Epoxy resin DER 332 30% HGM-S22 0.881 0.884 0
20 Epoxy resin DER 332 50% HGM-S22 0.692 0.656 5.3
21 Epoxy resin DER 332 30% HGM-K46 0.953 0.918 3.6
22 Epoxy resin DER 332 50% HGM-K46 0.812 0.823 0
23 Epoxy resin Epon 10% HGM- S60 1.275 1.240 2.71 [31]
8008 & 1031
24 Epoxy resin Epon 20% HGM-S60 1.216 1.180 2.96
8008 & 1031
25 Epoxy resin Epon 30% HGM-S60 1.153 1.112 3.56
8008 & 1031
26 Epoxy resin Epon 40% HGM-S60 1.087 1.056 2.85
8008 & 1031
27 Epoxy resin Epon 50% HGM-S60 1.017 0.985 3.15
8008 & 1031
28 Epoxy resin Epon 60% HGM-S60 0.943 0.885 6.15
8008 & 1031
Figure 2(c-d). The more the concentration of the HGM con- densities of the present work and some existing literature
tent, the more the void volume fraction. The void volume was also reported in Table 2.
fraction changes from 2.6% at EPT60-1 to 4.53% at EPT60-6 Table 2 relates the void fraction of the present work with
of the syntactic foam. This corresponds to an earlier report some existing literature, the void fraction value reduced
by Zhu et al. [31] where the void content also increased with compared to most previous works due to the degassing
an increasing volume fraction of HGM, which is as a result method used in its processing but increased with increasing
of surface infiltration between the matrix and the filler con- HGM volume fraction [25, 31]. This is as a result of good
tent. Also, it was an indication that there are heterogeneity dispersion and adhesion of HGM filler in the matrix resin
and entrapment of air bubbles during the mechanical mix- and smaller volume fraction of HGM used.
ing of the constituent elements [32]. Comparison betweenInfluence of reduced void fraction on syntactic foam composites using degassing processing method | 121
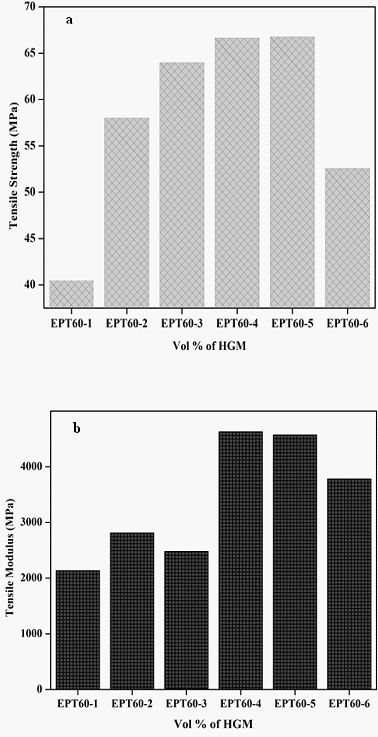
3.3 Tensile properties
The tensile properties of the EPT60 syntactic foam compos-
ites are shown in Figure 3 and Table 3. Figures 3a and 3b,
report the tensile strength and modulus relationship be-
tween the neat resin epoxyand the EPT60 syntactic foam
respectively. With the addition of HGM, tensile strength and
modulus increased at varying percentage volume fractions,
highest tensile strength was at EPT60-5 (66.7 MPa), which
is an increase of about 65% compared to the neat epoxy
resin and highest tensile modulus at EPT60-4 (4.5 GPa). The
tensile strength of syntactic foam increased consistently
with an increase in the HGM content until EPT60-5 which
correspond to the report by Nityanshu et al. and Rupan et
al. where tensile strength of the Polypropylene increased
upon the inclusion of HGM as a result of improved inter-
facial adhesion with the matrix [15, 16] before it declined
at EPT60-6 due to increased void content caused by the
agglomeration and reduced resin content resulting in low
bonding and load transfer stability between the filler and
the resin as shown in Figure 3a. The interfacial strength be-
tween the microsphere and the matrix is very important for
the syntactic foam composites as it affects its overall tensile
strength. Although, some previous studies [28, 32] reported
a decline in the tensile strength by 60-80% as compared to
neat epoxy. They stated that the increase in HGM volume
fraction reduced the tensile strength because as the volume
fraction of the epoxy resin in the material decreased, the
strength of the composites also decreased due to higher
range of microballoons in the composites structure. It was
however observed that the tensile modulus at EPT60-3 de-
cline as a result of high agglomeration (Figure 2c and 3b)
between the filler and the matrix as a result of mixing which
caused an early brittle failure at that point. The increase
in modulus of EPT60 syntactic foam composites over that
Figure 3: a) Tensile strength relationship between the neat epoxy
of neat epoxy resin confirms the report of Gupta et al. [35]
resin and EPT60 syntactic foam and b) Tensile modulus relationship
that the syntactic foam has a higher Young’s modulus in
between the neat epoxy resin and EPT60 syntactic foam.
several compositions than the neat
Table 3: Tensile strength of syntactic foam composites.
Materials Volume fraction Tensile Modulus Tensile Strength Tensile Strain
HGM (%) MPa % increase MPa % increase (mm/mm) % increase
EPT60-1 0 2135 0 40.47 0 0.0297 0
EPT60-2 5 2813 31.76 57.97 43.24 0.0409 37.71
EPT60-3 10 2480 16.16 63.97 58.07 0.0277 −6.73
EPT60-4 15 4628 116.77 66.60 64.57 0.0219 −26.26
EPT60-5 20 4570 114.05 66.73 64.89 0.0256 −13.80
EPT60-6 25 3782 77.14 52.55 29.85 0.0217 −26.94122 | O. A. Afolabi et al.
Table 4: Comparison of tensile properties of syntactic foam based on present work and existing literatures.
S/no Matrix type Composition of Tensile strength Tensile modulus Reference
HGM and type (MPa) (MPa)
1 Epoxy resin LR 20 — 40.47 2135 Present work
2 Epoxy resin LR 20 5% HGM-T60 57.97 2813
3 Epoxy resin LR 20 10% HGM-T60 63.97 2480
4 Epoxy resin LR 20 15% HGM-T60 66.60 4628
5 Epoxy resin LR 20 20% HGM-T60 66.73 4570
6 Epoxy resin LR 20 25% HGM-T60 52.55 3782
7 Polybutylene succinate — 34.7 330 [36]
8 Polybutylene succinate 5% HGM-T60 32.2 355
9 Polybutylene succinate 10% HGM-T60 25.3 371
10 Polybutylene succinate 15% HGM-T60 23.7 439
11 Polybutylene succinate 20% HGM-T60 18.1 464
12 Epoxy resin DER 332 — 57.2 2752 [12]
13 Epoxy resin DER 332 30% HGM- K46 25.1 3700
14 Epoxy resin DER 332 40% HGM-K46 20.7 3641
15 Epoxy resin DER 332 50% HGM-K46 15.6 3615
16 Epoxy resin DER 332 60% HGM-K46 12.8 3491
17 Epoxy resin DER 332 — 26.0 2700 [34]
18 Epoxy resin DER 332 30% HGM-S22 17.0 2200
19 Epoxy resin DER 332 50% HGM-S22 16.5 2100
20 Epoxy resin DER 332 30% HGM-K46 21.5 3200
21 Epoxy resin DER 332 50% HGM-K46 23.0 4100
22 Acrylonitrile Butadiene — 29.5 1820 [37]
Styrene (ABS)
23 Acrylonitrile Butadiene 5% HGB-TK70 30.2 1840
Styrene (ABS)
24 Acrylonitrile Butadiene 10% HGB-TK70 30.8 1860
Styrene (ABS)
25 Acrylonitrile Butadiene 10% HGB-TK70 32.2 1875
Styrene (ABS)
26 Acrylonitrile Butadiene 20% HGB-TK70 32.2 1900
Styrene (ABS)
The strain rate of the neat resin is substantially higher glomeration leading to low tensile strength and modulus in
than that of the syntactic foam except for EPT60-2 with the the syntactic foam composites [36]. Also a poor interfacial
lowest HGM volume fraction in the composites while that bond between the matrix and the microballoons resulting
of other syntactic foam from EPT60-3 to 6 is lower than the from a high-volume fraction of HGM used can be respon-
neat epoxy. This resulted from their higher void content in sible for the reduction in tensile strength of the syntac-
the composites due to the larger percentage of HGM volume tic foam [28]. However, good interfacial adhesion between
fraction. the matrix and HGM volume fraction in the syntactic foam
Table 4 shows the compared tensile properties of the was responsible for the increase in tensile strength in the
present work with some existing literature which observed present work as shown in Table 3. Meanwhile, Ji-Zhao Liang
that the tensile and modulus properties of the present work et al., Rupam et al., and Naresh and Siva [14, 16, 37] reported
improved compared to the existing literature due to the de- a similar result to the present work, where tensile strength
gassing method of preparation and the small void fraction increases with increase in filler concentration. The effect
of the syntactic foam which resulted in good matrix/filler of the good interfacial adhesion between the matrix and
interaction. High volume fraction of HGM can result in ag-Influence of reduced void fraction on syntactic foam composites using degassing processing method | 123
the HGM was shown through the fracture mechanism in Figure 4b shows a little roughness on the fracture surface
Figure 4. due to a reduced void volume fraction of the composites
while much roughness could be seen from Figure 4(c-f)
due to their higher void volume content in the syntactic
3.4 Fracture mechanism foam which is also responsible for their low strain value
compared to the neat resin, Table 3.
The fracture mechanism for the tensile test conducted on
the syntactic foam composites as observed under SEM are
shown in Figure 4(a-f) for all the volume fraction com- 3.5 Dynamic mechanical analysis (DMA)
positions respectively. Figure 4(a) shows the cracked por-
tion for the plain epoxy resin composites where the crack The dynamic mechanical analysis was conducted to study
could be seen freely propagating around the surfaces which the viscoelastic properties of the syntactic foam composites.
are responsible for their brittle failure [38]. The cracked The storage, and loss modulus values for the EPT60 syntac-
surfaces become clearer with the introduction of HGM as tic foam composites and neat epoxy matrix were taken from
shown in Figure 4(b-f). The marked regions identified as three different temperatures measurement 30∘ C, 50∘ C and
“1”- deboned microspheres, “2”- fractured microspheres 60∘ C as shown in Table 5. Figures 5(a-c) show the storage
and “3”- fractured surfaces on the syntactic foam. The frac- modulus, loss modulus and tan delta versus temperature
tured microsphere and deboned microspheres increased graphs of the syntactic foam composites. At the temperature
with an increasing volume fraction of HGM in the syntac- of 30∘ C, the storage modulus does not show a consistent
tic foam composites which are as a result of good bonding trend but a decrease in loss modulus was observed as the
effect on interfaces between the matrix resin and can also HGM increases. At 50∘ C temperature, storage modulus in-
be attributed to good interaction between the matrix and creased while loss modulus decreased with respect to neat
the filler [38], that the micrographs of HGM/epoxy compos- resin. At 60∘ C, both the storage and loss modulus increased
ite show a good interaction of HGM with the epoxy matrix. at the addition of HGM with respect to neat resin. The maxi-
(a) (b) (c)
(d) (e) (f)
Figure 4: SEM images for tensile fracture surfaces for (a) neat resin and (b-f) percentage fraction of HGM 0.5-2.5% in syntactic foam at 500
magnifications showing the arrowed areas as 1: deboned microspheres, 2: fractured microspheres and 3: fractured surfaces.124 | O. A. Afolabi et al.
mum storage modulus values were at EPT60-6 for the three Sankaran et al. [1] and Ghamsari et al. [3] while John B et
selected temperatures which are 2705, 2447, and 1466 MPa al. [39] reported a sudden decrease in the storage modulus
respectively and the loss modulus was highest at 60∘ C of of cyanate ether syntactic foam composites with tempera-
EPT60-6 (261.5 MPa). The improved storage and loss mod- ture.
ulus values compared to neat resin can be attributed to The loss modulus shows the variation in values but
good interaction and interfacial bonding between the mi- increases mostly with the addition of HGM in the EPT60
crosphere and the matrix and also as a result of the lower syntactic foam. The maximum loss modulus for neat epoxy
density and void content. The storage modulus decreased matrix resin was 223 MPa at 50∘ C and ~262 MPa at 60∘ C
with increased temperature due to the reduction in the void for EPT60-6. This shows that the loss modulus of syntac-
rate of the composites as a result of the degassing method tic foam was noticeably affected as the percentage of HGM
in processing it which correlates with earlier reports from
(a) (b)
(c)
Figure 5: (a) Storage modulus, (b) loss modulus and (c) tan delta of HGMSF and neat epoxy matrix against temperature.
Table 5: Comparison of storage modulus (SMD) and loss modulus (LMD) values of HGMSF composites and neat epoxy matrix resin.
Specimen Volume fraction of HGM (%) Temperature (∘ C)
name 30 50 60
SMD LMD SMD LMD SMD LMD
EPT60-1 0 2478 94.78 1294 223.2 77.62 56.63
EPT60-2 5 2663 72.63 2343 79.9 1449 227.2
EPT60-3 10 2190 63.84 1924 71.76 1022 220.2
EPT60-4 15 1854 62.09 1555 78.63 535.4 164.6
EPT60-5 20 2426 67.48 2136 75.93 1203 243.5
EPT60-6 25 2705 96.74 2447 101 1466 261.5Influence of reduced void fraction on syntactic foam composites using degassing processing method | 125
Table 6: Comparison of tan δ values of HGMSF and neat epoxy resin at different temperature range.
Specimen name Volume fraction of HGM (%) Temperature
30∘ C 60∘ C 70∘ C
EPT60-1 0 0.03824 0.7259 0.4391
EPT60-2 5 0.02727 0.1637 0.7851
EPT60-3 10 0.02915 0.2518 0.7569
EPT60-4 15 0.03349 0.3349 0.8435
EPT60-5 20 0.02713 0.2055 0.7727
EPT60-6 25 0.03576 0.1793 0.7354
increases and it reflects either retention or a marginal in-
crease till the maximum temperature was reached.
4 Conclusion
The storage modulus (E′ ) of the EPT60 syntactic foam
Syntactic foam composites prepared by degassing method
composite measures the stored energy in the elastic por-
with a varied volume fraction of HGM from 5-25% were pre-
tion of the composite as shown in Figure 5a. However, the
pared. The effect of varying compositions of HGM on the
loss modulus (E′′ ) of the EPT60 syntactic foam compos-
mechanical and dynamic mechanical properties was in-
ite measures the energy dissipated at heat per cycle under
vestigated. The tensile properties from the test revealed an
deformation of the material as shown in Figure 4b.
improved strength as the volume fraction of HGM increased
due to good interfacial adhesion between the filler and the
matrix and the low void content in the composites due to
3.5.1 Damping Coeflcient
degassing method of processing. The dynamic mechani-
cal analysis of the syntactic foam composites showed a
The values for the damping coefficient or loss factor tan δ
decrease in storage modulus and an increase in loss modu-
which is the measure of how efficient the syntactic foam
lus with increasing temperature with the maximum value
loses energy to molecular rearrangement and internal fric-
of storage modulus of 2705 MPa at 30∘ C and maximum
tion as compared to the neat epoxy resin was varied at dif-
loss modulus of ~262 at 60∘ C. The damping performance
ferent temperatures “30∘ C, 60∘ C and 70∘ C” as reported in
also reduces due to the reduction in the intensity of the
Table 6. The glass transition temperature (Tg ) was at 70∘ C
tan delta peak due to good interfacial interaction between
which was the temperature at which the EPT60 syntactic
the molecules of the polymer and the HGM. The density
foam reaches its maximum tan δ as shown in Figure 5c.
of syntactic foam composites declined gradually as the
The inclusion of HGM reduced the peak of epoxy resin tan
volume fraction of HGM increased. In addition, this study
δ which is an indication of good interfacial bonding. This
shows that the properties of syntactic foam composite can
shows that when the constituents material of the compos-
be effectively controlled by reducing the void content when
ites exhibit good interfacial bonding, it resulted in less en-
changing the volume fraction of HGM embedded in the
ergy dissipation resulting in a lower value of tan δ [3]. It
matrix. The syntactic foam composite can be regarded as
also shows that epoxy resin exhibited a rubbery plateau
lightweight materials for structural application and in the
before the EPT60 syntactic foam which was an indication
context of the search for materials with better tensile prop-
of proper dispersion of HGM in the epoxy resin. In addition,
erties for aerospace, marine, automobile and other design
the decrease in Tg with the addition of HGM resulted in the
fields, this work contributes to our understanding of im-
plasticization of the epoxy resin which can be linked to the
proving the properties of syntactic foam.
reduced void fraction in the composites as a result of the
degasing method [40]. Therefore, an increase in the inter-
Conflict of Interests: The authors declare no conflict of
facial interaction between the matrix and HGM leads to a
interest regarding this manuscript.
decrease in the loss factor (tan δ) of EPT60 syntactic foam
composites and also improves the damping performance
Acknowledgement: The authors would like to appreciate
of the molecule motion in the foam composites [40, 41].
the support gotten from the DST-CSIR U-295 grant and Dur-
ban University of Technology for the opportunity given to
conduct this research work.126 | O. A. Afolabi et al.
Structures, 2003. 61(4): p. 311-320.
References [18] Kim Ho Sung ., M.A.K., Fracture and Impact Behaviour of Hol-
low Micro-sphere- Epoxy Resin Composites. Composite Part A:
[1] Sankaran, S., et al., Characterization of epoxy syntactic foams Applied Science and Manufacturing, 2001. 32: p. 1311-1317.
by dynamic mechanical analysis. Journal of Materials Science, [19] Chawla, K., Foams, fibers, and composites: Where do we stand?
2006. 41(13): p. 4041-4046. Materials Science Engineering: A, 2012. 557: p. 2-9.
[2] Le, V.S., et al., Mechanical properties of geopolymer foam at high [20] Yu, W., H. Xue, and M. Qian, Tensile and compressive properties
temperature. Science and Engineering of Composite Materials, of epoxy syntactic foams reinforced by short glass fiber. Indian
2020. 27(1): p. 129-138. Journal of Engineering and material sciences, 2017. 24: p. 283-
[3] Ghamsari, A.K., E. Zegeye, and E. Woldesenbet, Viscoelastic 289.
properties of syntactic foam reinforced with short sisal fibers. [21] Ren, S., et al., Development of a buoyancy material of hollow
Journal of Composite Materials, 2013. 49(1): p. 27-34. glass microspheres/SiO2 for high-temperature application. Jour-
[4] Panteghini, A. and L. Bardella, On the compressive strength of nal of Alloys and Compounds, 2017. 721: p. 213-219.
glass microballoons-based syntactic foams. Mechanics of Mate- [22] Geng, H., et al., Fabrication of heat-resistant syntactic foams
rials, 2015. 82: p. 63-77. through binding hollow glass microspheres with phosphate ad-
[5] Wouterson, E.M., et al., Specific properties and fracture tough- hesive. Materials & Design, 2016. 95: p. 32-38.
ness of syntactic foam: Effect of foam microstructures. Compos- [23] Sue Rena, b., d, Xin Taod, Xiaohui Mad, Jiachen Liud, Haiyan
ites Science and Technology, 2005. 65(11-12): p. 1840-1850. Dud, Anran Guod, Jun Xub,c,*, Jun Lianga, Shaohua Chena, Jin-
[6] Doddamani, M., et al., Compressive and flexural properties of gran Gea,*, Fabrication of fly ash cenospheres-hollow glass mi-
functionally graded fly ash cenosphere-epoxy resin syntactic crospheres/borosilicate glass composites for high temperature
foams. Polymer Composites, 2015. 36(4): p. 685-693. application. Ceramics International, 2018. 44: p. 1147-1155.
[7] Gogoi, R., et al., Effect of Hollow Glass Microspheres on the [24] Ashida K, A.H.L.E., Syntactic foam; Handbook of plastic foams:
Morphology, Rheology and Crystallinity of Short Bamboo Fiber- types, properties, manufacture and applications,. Noyes Publica-
Reinforced Hybrid Polypropylene Composite. Jom, 2018. 71(2): p. tions, New Jersey, 1995: p. pp. 147-63.
548-558. [25] Qiao, Y., et al., Investigation of flexural properties of hollow glass
[8] Gupta, N., E. Woldesenbet, and P. Mensah, Compression prop- microsphere filled resin-matrix composites. Pigment & Resin
erties of syntactic foams: effect of cenosphere radius ratio and Technology, 2016. 45(6): p. 426-430.
specimen aspect ratio. Composites Part A: Applied Science and [26] Tagliavia, G., M. Porfiri, and N. Gupta, Influence of moisture ab-
Manufacturing, 2004. 35(1): p. 103-111. sorption on flexural properties of syntactic foams. Composites
[9] Shutov FA, K.D., Frisch KC, editor, Syntactic polymeric foams. ln: Part B: Engineering, 2012. 43(2): p. 115-123.
Handbook of polymeric foams and foam technology. New York: [27] Yung, K., et al., Preparation and properties of hollow glass
Hanser Publishers, 1991: p. p. 355-74. microsphere-filled epoxy-matrix composites. Composites Sci-
[10] Bunn, P. and J. Mottram, Manufacture and compression proper- ence and Technology, 2009. 69(2): p. 260-264.
ties of syntactic foams. Composites, 1993. 24(7): p. 565-571. [28] Gupta, N. and R. Nagorny, Tensile properties of glass
[11] Woldensenbet, E. and N. Sankella, Flexural properties of nan- microballoon-epoxy resin syntactic foams. Journal of Ap-
oclay syntactic foam sandwich structures. J Journal of Sandwich plied Polymer Science, 2006. 102(2): p. 1254-1261.
Structures Materials & Design, 2009. 11(5): p. 425-444. [29] Woldesenbet E., N.G., Jadhav, Effects of Density and Strain Rate
[12] Gupta, N. and E. Woldesenbet, Characterization of flexural prop- on Properties of Syntactic Foam. journal of materials science,
erties of syntactic foam core sandwich composites and effect of 2005. 40: p. 4009-4017.
density variation. Journal of composite materials, 2005. 39(24): [30] Koopman, M., et al., Microstructural failure modes in three-phase
p. 2197-2212. glass syntactic foams. Journal of Materials Science, 2006. 41(13):
[13] Fine, T., H. Sautereau, and V. Sauvant-Moynot, Innovative pro- p. 4009-4014.
cessing and mechanical properties of high temperature syntactic [31] Zhu, B., et al., Thermal, dielectric and compressive properties of
foams based on a thermoplastic/thermoset matrix. Journal of hollow glass microsphere filled epoxy-matrix composites. Journal
materials science, 2003. 38(12): p. 2709-2716. of Reinforced Plastics and Composites, 2012. 31(19): p. 1311-
[14] Mallireddy, N. and K. Siva, Investigation of Microstructural, Me- 1326.
chanical and Corrosion Properties of AA7010-TiB2 in-situ Metal [32] Yu, M., P. Zhu, and Y. Ma, Experimental study and numerical
Matrix Composite. Science and Engineering of Composite Mate- prediction of tensile strength properties and failure modes of
rials, 2020. 27(1): p. 97-107. hollow spheres filled syntactic foams. Computational Materials
[15] Nityanshu Kumar a, S.M.a., 1, Vinay Khandelwal a, 1, Byravan Science, 2012. 63: p. 232-243.
Arun b, Gaurav Manik, Light-weight high-strength hollow glass [33] Tagliavia, G., M. Porfiri, and N. Gupta, Analysis of flexural prop-
microspheres and bamboo fiber based hybrid polypropylene erties of hollow-particle filled composites. Composites Part B:
composite: A strength analysis and morphological study Com- Engineering, 2010. 41(1): p. 86-93.
posite Part B:, 2017. 109: p. 9. [34] Colloca, M., N. Gupta, and M. Porfiri, Tensile properties of carbon
[16] Rupam Gogoi , G.M., Byravan Arun, High specific strength hybrid nanofiber reinforced multiscale syntactic foams. Composites Part
polypropylene composites using carbon fibre and hollow glass B: Engineering, 2013. 44(1): p. 584-591.
microspheres: Development, characterization and comparison [35] Gupta, N., R. Ye, and M. Porfiri, Comparison of tensile and com-
with empirical models. Composite Part B:, 2019. 173. pressive characteristics of vinyl ester/glass microballoon syn-
[17] Gupta, N. and E. Woldesenbet, Hygrothermal studies on syntac- tactic foams. Composites Part B: Engineering, 2010. 41(3): p.
tic foams and compressive strength determination. Composite 236-245.Influence of reduced void fraction on syntactic foam composites using degassing processing method | 127
[36] Li, J., X. Luo, and X. Lin, Preparation and characterization of [39] John, B., C.P.R. Nair, and K.N. Ninan, Effect of nanoclay on the me-
hollow glass microsphere reinforced poly(butylene succinate) chanical, dynamic mechanical and thermal properties of cyanate
composites. Materials & Design, 2013. 46: p. 902-909. ester syntactic foams. Materials Science and Engineering: A,
[37] Liang, J.-Z., Tensile and Flexural Properties of Hollow Glass Bead- 2010. 527(21-22): p. 5435-5443.
filled ABS Composites. Journal of Elastomers & Plastics, 2005. [40] Huang, C., et al., Mechanical and dynamic mechanical properties
37(4): p. 361-370. of epoxy syntactic foams reinforced by short carbon fiber. Polymer
[38] Imran, M., A. Rahaman, and S. Pal, Effect of low concentration Composites, 2016. 37(7): p. 1960-1970.
hollow glass microspheres on mechanical and thermomechani- [41] Hu, G. and D. Yu, Tensile, thermal and dynamic mechanical prop-
cal properties of epoxy composites. Polymer Composites, 2019. erties of hollow polymer particle-filled epoxy syntactic foam. Ma-
40(9): p. 3493-3499. terials Science and Engineering: A, 2011. 528(15): p. 5177-5183.You can also read