PROCEEDINGS OF THE NATIONAL RESEARCH SYMPOSIUM - ncrst
←
→
Page content transcription
If your browser does not render page correctly, please read the page content below
PROCEEDINGS
   OF THE NATIONAL
RESEARCH SYMPOSIUM
                 2015
NATIONAL COMMISSION
                        ON RESEARCH, SCIENCE
                           AND TECHNOLOGY

                        INTRODUCTION
The National Commission on Research, Science and Technology (NCRST) hosted the annual National Research
Symposium from 23-25 September 2015 at the Hilton Hotel, Windhoek, Namibia. The symposium brought together
researchers and related practitioners from all over the country to share their research experiences, expertise and findings
with the broader audience, including the industry.

The event offered interactive discussions that comprised of presentations in plenary, subject specific thematic areas
and personal interactions. Lead speakers were invited to enrich the symposium and common issues like the research
funding, ethics and proposal writing were discussed. The event was also aimed at creating an enabling environment
for the development of the research capacity in Namibia, while creating a knowledge brokerage system between
researchers, the industry, the general public, scholars and policy makers.

Proceedings of the National Research Symposium 2015 are published by NCRST.

Permission to make digital or hard copies of all parts of this work for personal or classrooms use is granted without a
fee, provided that copies are not made or distributed for profit or commercial advantage and that copies bear this notice
and the full citation on the first page.

Editors:
Diina Shuuluka
Matheus Shikongo
Vincent Nowaseb
Alushe Nditya
Albanus Sindano

ISBN: 978-99945-69-20-5
ISSN: 2026-7495

                                                     Page | 1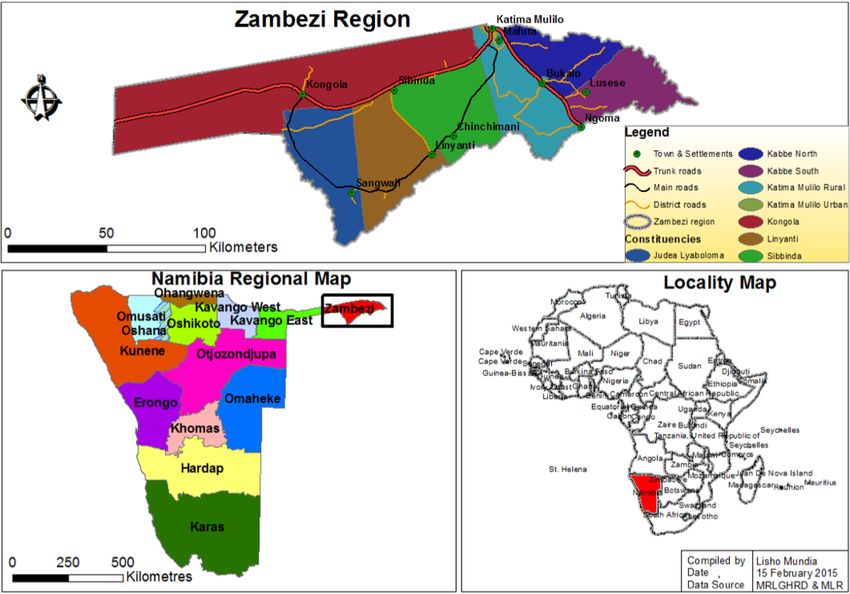
CONTENT PAGE
Research Weaving the Future and Beyond 6 In Vitro Investigation into the Anticancer Properties of Sclerocarya Birrea
(Marula Plant) and Adansonia Digitata (Baobab Plant) Extracts 47
National Research Symposium Organising Committee 7
Evaluation of a Molecular Diagnostic Method to Detect Campylobacter Fetus
Reviewers 7 in Field Isolates from Namibia 50
Agriculture 9 Information and Communication Technology 55
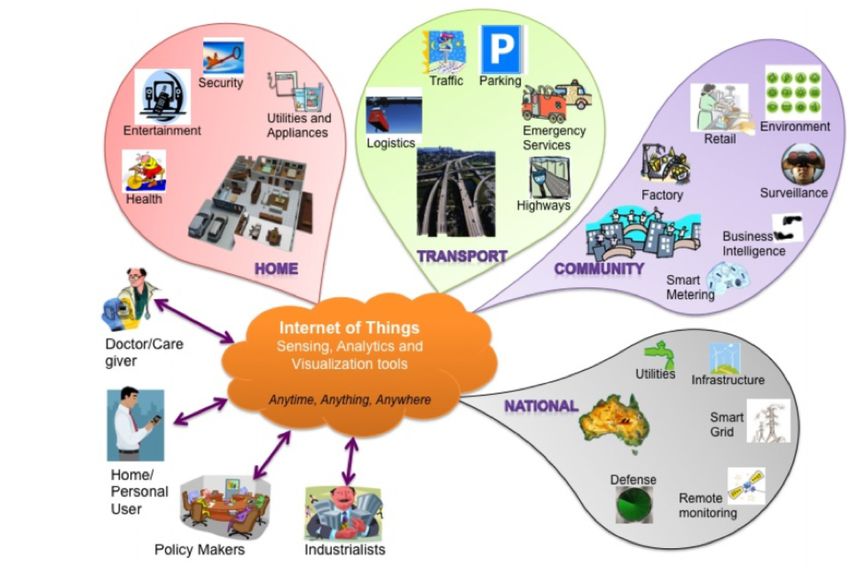
Analysis of Constraints for Agro Processing Industry Development in North Exploring the Potential Applications of Internet of Things (IoT) in the Health Sector:
Central Namibia: A Case of Omusati Region Tomato Value Chain 10 A Focus on Namibia. 56
Energy 17 Software Defined Network Solution for Communication in a Smart Grid 60
Geomagnetic Disturbance Monitoring and Modelling in Namibia 18 Open Data Portal, a Technical Enabler to Drive Innovation in Namibia 64
Environment 25 Indigenous Knowledge Systems 69
Environmental and Anthropogenic Spatial and Temporal Patterns of Photosynthetic The Importance of Incorporating Indigenous Knowledge into the Development and
Efficiency of Welwitschia Mirabilis Hook in the Central Namib Desert 26 Commercialisation of Local Products 70
Assessment of the National Language Policy in Promoting the Use of
Health 31 Indigenous Namibian Languages in Governance. 73
A Comparative Analysis of the In Vitro Antiplasmodial Effects Ethnobotanical Study of Medicinal Plants in Omusati Region 76
of Lophiocarpus sp. and Moringa Ovalifolia 32
Nutrient Content Of Maxau and Âudaï, Fermented Beverages
Evidence-based Herbal Medicine for Chronic Diseases in Namibia: A Comparative from the //Karas Region, Namibia 80
Study on a Commercially Available Herbal Supplement and Raw Plant Material 36
Investigation into Health Care Workers’ Awareness and Practices on the Prevention Logistics 87
and Control of Viral Hepatitis Infections in Namibia, 2014 40
Is Logistics in Namibia, on Track or in Need of Realignment? 88
Preserving Moringa Species for Climate Change and Variability Mitigation,
Improving Community Health and Creating Jobs 43
Page | 2 Page | 3
Manufacturing Technologies							95
           Can Nutritious Omaungu (Gonimbrasia Belina) Caterpillars be Made
           an Invisible but Present Part in Our Diet?							                              96

           Suitability of Sand from Oshanas in Ongwediva for Use as Mould
           Material in Sand Casting Foundries								99

           Mining											103
           Ore Characteristics Investigation for Predicting Bit Penetration
           Rate at Okorusu Fluorspar Mine								104

           Social Sciences And Humanities							111
           Intimate Partner Homicide (IPH): “A Survey of Namibian Men Killing
           Their Female Partners”									112

           Comparison of the Drivers of Corruption Affecting Development in a
           Developed and Two Developing Countries							117

           An Evaluation of Informal Food Vending in Windhoek, Namibia				                124

           Toward Self-actualization Through Youth Engagement in Participatory
           Service and Technology Design								128

           Using Customer Service Research as a Catalyst for Social Change in Namibia		   131

           Water											141
           Development of a GIS-Based Support Tool for Integrated Water Resources
           Management in the Zambezi Catchment Area Within Zambezi Region, Namibia		      142

           Water Provision to Rural Communities Through Community Based Management
           Approach in Namibia, Omaheke and Oshikoto Regions					                         147

Page | 4                                          Page | 5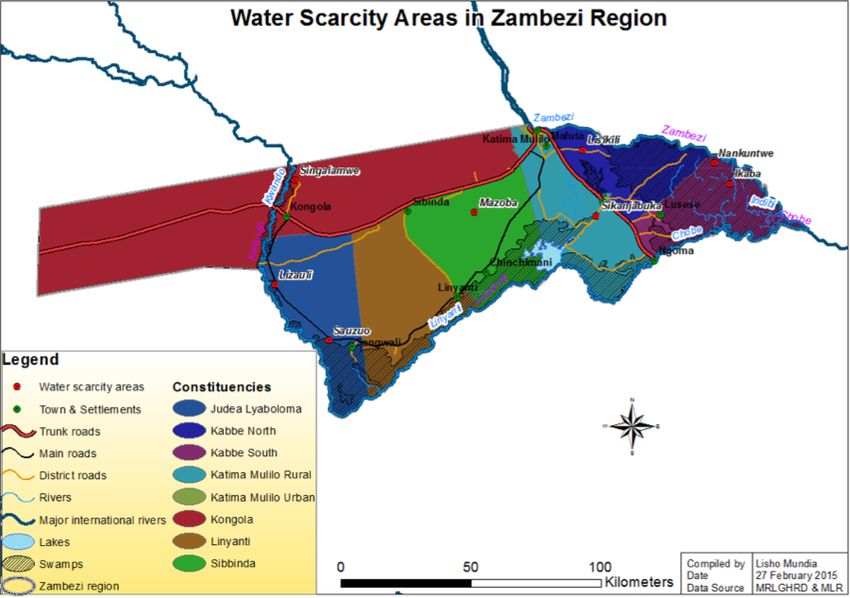
NATIONAL RESEARCH
                                                                                                                           SYMPOSIUM ORGANISING
                              RESEARCH
                          WEAVING THE FUTURE                                                                                  COMMITTEE
                             AND BEYOND                                                                                     Angelique Philander (Chair)       Angela Ntemwa
                                                                                                                            Martha Taapopi                    Geroldine Skrywer
                                                                                                                            Iyaloo Kandjabanga                Katrina Hilundwa
                                                                                                                            Generosa Simon                    Fransina Shihepo
                                                                                                                            Johannes Ndjamba                  Mathew Tiyeho
                                                                                                                            Albanus Sindano                   Jackson Mujetenga
                                                                                                                            Maxie van der Westhuizen          Grant Balie
                                                                                                                            Hendrik Mukoko                    Mariana Alweendo
                                                                                                                            Ebenhezer Kauhonina
The National Research Symposium 2015 represents an important milestone in our country’s science, technology and
innovation landscape, and indeed in the history of our great nation.

As you are aware, in early 2015, the cabinet of the Republic of Namibia approved the three-year National Programme on
Research, Science, Technology and Innovation (NPRSTI), which was subsequently tabled in parliament and launched

                                                                                                                              REVIEWERS
in March 2015, becoming the first National Research and Innovation Agenda for Namibia.

One of the five key strategic priorities in the NPRSTI is “Disseminating scientist and technological knowledge, looking
towards a growing involvement of institutions, researchers, enterprise and the entire population.” Under this strategic
priority, a key initiative has been formulated that speaks to the promotion of dissemination and publication of research
results. It is through this initiative that the National Research Symposium is organised annually, where Namibian
researchers are given an opportunity to present their research findings.

The theme for the 2015 National Research Symposium, namely “Research weaving the future and beyond,” resonates
                                                                                                                            Prof. A.F. Kamona                 Prof. Emmanuel Lutaaya
very well with the mantra of the NPRSTI for 2014/15 to 2016/17, which is the national research agenda contribution
                                                                                                                            Dr Heike Wanke                    Dr Davis R. Mumbengegwi
to the transformation of our economy into a knowledge-based society. As a country, we have set ourselves ambitious
                                                                                                                            Prof. Isaac Mapaure               Dr Michael Backes
targets that we must achieve for science, technology and innovation to contribute to the achievement of National
                                                                                                                            Prof. K.C. Chinsembu              Dr Ansgar WANKE
Development Plan objectives. The hosting of this symposium thus signified our commitment to achieving those targets
                                                                                                                            Dr Isak Neema                     James Vining Olugbemi Ojo
that we have set for ourselves as a nation.
                                                                                                                            Dr Jane Misihairabgwi             Prof. Habauka M. Kwaambwa
                                                                                                                            Dr Sheehama Jacob                 Mrs Alisa Amupolo
                                                                                                                            Dr Julius Ojulong                 Dr Clement Nyirenda
                                                                                                                            Dr Theopoline Omagano Itenge      Dr Nobert Jere
                                                                                                                            Dr Ahmad Cheikhyoussef            Dr Harmony Musiyarira
                                                                                                                            Prof. Hina MuAshekele             Mr Patrick Kohlstaedt
                                                                                                                            Dr Ezekeil Gwinyai Kwembeya       Prof. Haruna Mohammed Bello
                                                                                                                            Mrs Loide N. Shifula Dama         Prof. Timothy Rennie
                                                                                                                            Mr Mattheus Hanghome              Dr Omotayo Awofolu
                                                                                                                            Dr Paul Chisale

                                                   Page | 6                                                                                        Page | 7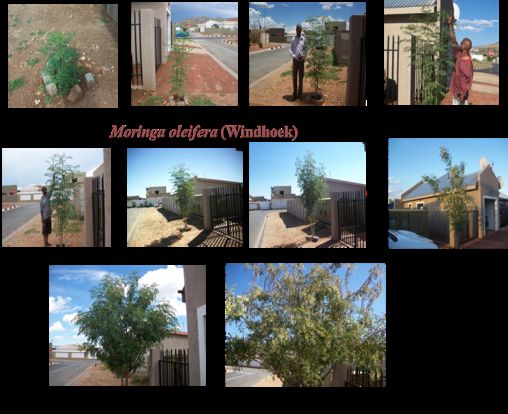
AGRICULTURE
                Analysis of Constraints for Agro Processing Industry
           10
                Development in North Central Namibia: A Case of
                Omusati Region Tomato Value Chain

Page | 8                        Page | 9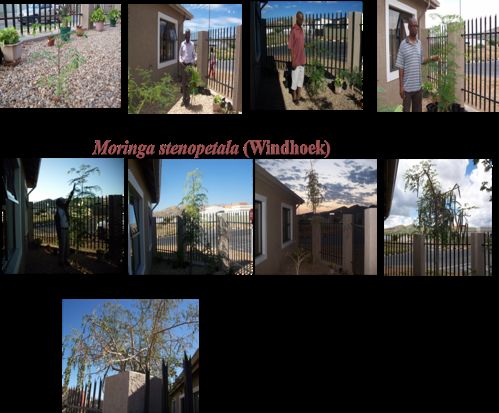
Analysis of Constraints for Agro Processing Industry The linear regression equation is stated as follows: school, with 56% having received some agricultural training.
The majority (76.7%) of the farmers are full time, with only
Y = β0 + β1 X1 + ... βn Xn + ε
Development in North Central Namibia: A Case of Omusati (1) 23.3% part time farmers. The most important crop grown was
tomatoes, as indicated by 48% of the farmers, followed by
Region Tomato Value Chain where Y is the dependent variable, while β1-n is a constant and
X1-n are the independent explanatory variables.
cabbage (25%). As for rest of the crops, less than 7% of the
farmers indicated them as important.
C. Togarepi1*, B.Thomas1 and C. Samundengu2 The empirical model for the study was specified as follows: Production
Y = β0 + β1 AGRT + β2 FRMS + β3 FRMHC + β4 FRMXH + β5 Figure 1 below shows tomatoes harvested, sold, consumed,
1
Department of Agricultural Economics, University of Namibia, Namibia AVT + β6 EXP + β7 FERT + β8 EDU+ ε (2) or spoiled in the Omusati region during the 2013 and 2014
2
Department of Food Science and Technology, University of Namibia, Namibia
production seasons. The tomato production (2014) in the study
*
Corresponding author: Email: ctogarepi@unam.na ; Tel: (+264) 65 223 5209/Cell: (+264) 08 12741071 where Y is the dependent variable (income generated from area (12 tons/ha) is still low compared to the expected yield
tomato production per season), β0 - β8 are the parameters to be level of about 25 - 45 tons/ha (Jacobi, 2008).
Abstract supply base to agro processing. The main challenges faced in estimated, and ε is the error term.
the production of fresh produce, for example tomatoes, are high
Employment creation and industrialisation are core goals of input costs (water, seeds, fertiliser, pesticides), high heat, poor The following explanatory variables were investigated:
Namibia’s National Development Plans and Vision 2030. In farm sanitation, lack of capacity to produce required volumes
order to achieve these, initiatives and opportunities for value for processing and marketing, improper harvesting stages and/ AGRT is agriculture training
addition of agricultural products were identified as key avenues, or periods, and improper packaging materials (Arah, 2015). FRMS is the total farm size irrigated
as most agricultural produce is consumed with little to no value There are also other off-farm challenges, such as inappropriate FRMHC is the total cultivated area for horticulture crops
addition, thereby limiting opportunities for industrialisation transportation systems, lack of processing factories, lack of FRMXH is the farming experience in horticulture production
and employment creation. Thus this study embarked on effective storage facilities, and lack of market information and AVT is the average yield of tomatoes
identifying challenges and opportunities for agro processing reliable markets (Arah, 2015). However, for fresh produce, such EXP is the expenditure on tomato production
industry development, using the tomato value chain as a case as tomato in the Omusati region, opportunity for value addition FERT is the type of fertiliser used
study. A survey of 78 tomato producers in the Omusati region exists due to favourable production conditions, which enable EDU is the number of years spent in formal education
was conducted in which socio-demographic information production of tomatoes throughout the year. This is the only
and data on tomato production, harvesting, marketing, and region in Namibia that is rarely affected by frost during winter, which are the selected variables used for the regression model
giving it an advantage over other regions in the production of based on literature such as Rearden et al (1997) and Odhiambo, Figure 1: Estimated tomato production, sales,
challenges faced along the chain were solicited. The socio-
tomatoes. Therefore the objective of this study was to identify Kristanson and Kashangaki (1996), among others. consumption, and spoilage in the Omusati region
demographic information was analysed for means, frequencies,
and percentages, while a linear regression was used to determine and analyse the challenges faced in the tomato value chain in Source: Field data
factors that affect the incomes of farmers from tomato north central Namibia, the Omusati region, as well as to identify Results and discussion
production. Most of the farmers were male (77%), who had an the opportunities for the development of the agro processing Socio-demographics
average of 10.5 years of horticultural production experience, industry using the tomato crop as a case study.
using about four hectares for horticulture production, and 56% The majority of the farmers were male (77.3%), while females
had received some form of agricultural training. The average Materials and methods were 22.7%, with a combined mean age of 49.7 years (Table
tomato yield was 15 tons/ha. The linear regression model 1). The average farming experience is 16.7 years, and 10.5
determined the three significant factors that affected income as The study employed a small-scale survey to solicit information years were spent in horticulture production. The farm sizes are
horticultural farming experience, production costs, and types of from 78 small-scale tomato producers in the Omusati region on average 4.6 ha, while 4.1 hectares are under horticultural
fertilisers used. The study concludes that production is affected on production, harvesting, and marketing. The survey was production. Farmers have, on average, spent nine years in
mainly by production-related factors which, if addressed, would conducted during the months of May and June in 2015. In
improve yields, which will, in turn, increase returns as well as addition, key stakeholders in the horticultural sector of Namibia
create opportunities for agro processing and value addition. were also interviewed, using a checklist of questions. Secondary Table 1: Socio-economic characteristics of the tomato farmers
Subsidisation of input costs, such as fertilisers and seeds, might data was also reviewed from published and unpublished data Variable % Variable Mean
be a step towards the much needed agro processing, as yields sources. Data was analysed in SPSS version 21 to generate
may increase. descriptive statistics (means, frequencies and percentages) Gender Male 77.3 Age (years) 49.7
for socio-demographic data and for production levels and Female 22.7
Keywords: Horticulture, irrigation, fertiliser, production costs, marketing, including post-harvest losses for tomato producers. Marital status Married 70.7 Farming experience (years) 16.7
farmers, infant industry, spoilage, value addition, uniformity A linear regression model was then used to determine factors Single 29.3
that affect income of tomato producers in north central
Education, at least grade 10 58.8 Experience in horticultural crops (years) 10.5
Introduction Namibia using income data and selected variables, including
horticultural experience, input costs, yield, type of fertilisers, Agricultural training or attended short courses in 56 Total farm size under irrigation (ha) 4.6
and education level, among others. A linear regression model agriculture
The agro processing industry in Namibia is still in its infancy
stage of development. There are several efforts by the government can predict the value of a dependent variable based on the value Full time farmer 76.7 Total area under horticultural crops (ha) 4.1
to establish the agro processing industry and many studies of an independent variable as well as modelling the relationship Part time farmer 23.3 Household size (number of people) 7.2
have been instituted through the Ministry of Industrialisation, between variables (Gujarati, 2003).
Years spent in school 9
Trade and Small to Medium Enterprise Development as well
as the Ministry of Agriculture, Water and Forestry (MAWF,
2008; MAWF, 2015 and MTI). These efforts have included
ascertaining the agricultural production base that serves as a
Page | 10 Page | 11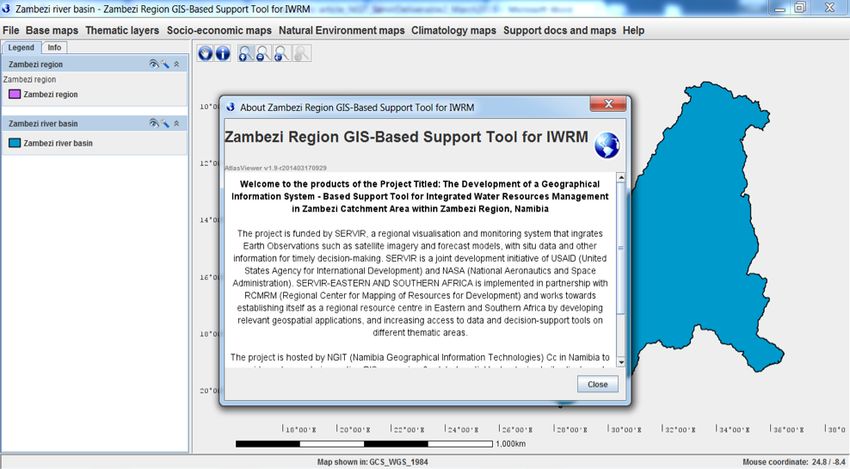
Challenges The linear regression model test of goodness of fit shows that Table 3: Explanatory variables in the model
the explanatory variables account for 23% of variability in
the dependent variable as indicated by the value of adjusted Unstandardised coefficients Standardised t Sig.
The results indicated that the main challenges were the following:
R2 (0.23), which is low. The linear regression model (Table coefficients
production capacity to meet demand are unsynchronised
production leading to glut in the market periodically; inadequate 3) selected three predictor variables that were significant at Model B Std. error Beta
training in global Good Agricultural Practices (GAP); lack 5%, namely farming experience in horticultural production (Constant) 112456.4 59973.911 1.875 0.074**
of capital; lack of local expertise in value addition; high (p=0.044), expenditure on tomato production (production costs)
Agricultural training 12737.26 13224.192 0.169 0.963 0.345
temperatures; incidence of pests; and high input and fuel costs (p=0.035), and types of fertiliser used (0.019). Thus when a
farmer has less experience in horticultural production, incomes Total farm size for irrigated crops 1897.18 1957.942 0.317 0.969 0.343
for pumping water; and transporting produce to the market.
Pests and diseases, water shortage, fertiliser costs, and fuel costs are likely to be low as indicated by a negative coefficient, Total cultivated area for 1773.14 2377.609 0.388 0.746 0.463
for pumping water were reported as major challenges by 85% which is likely to reduce income by N$4,107.17 per year. As horticultural crops
of the farmers. Similar findings were also cited by Bediako, more expenditure is put on tomato production, income is likely Farming experience in -4107.17 1922.639 -0.754 -2.136 0.044**
Showemimo, Buah and Ushawu (2007) as major constraints in to increase by 2.23 per Namibian dollar invested per year. It is horticultural production
tomato production in an irrigation project in Ghana. The farmers also interesting to note that the type of fertiliser used is likely
Average yield last season -21.419 46.019 -0.105 -0.465 0.646
(80%) also experienced high post-harvest losses due to high to reduce income. This variable had chemical fertiliser, manure
and both types as responses and both were used as the base. Expenditure on tomatoes 2.218 0.987 0.526 2.247 0.035**
perishability of tomatoes as a result of lack of alternatives to
Corollary, chemical fertilisers are likely to reduce income, as production last season.
fresh produce markets, such as a tomato processing industry.
This is exacerbated by the periodic gluts in the market. These they increase expenditure or may affect other inputs, as there will Type of fertiliser used -36399.6 14433.912 -0.432 -2.522 0.019**
results are consistent with those of Anang, Zulkarnain and Yusif be competing needs for resources for production. For instance, Number of years spent in school -362.361 3108.094 -0.022 -0.117 0.908
(2013), who found that lack of capital, high production costs, Tey and Brindal (2014) assert that “reducing costs though
Dependent variable: Income earned in the previous season (2014)
and low market prices were the main challenges facing tomato economics of scale and input-output improvement by increasing
R2 = 0.43, adjusted R2 = 0.23
producers in Ghana. Some of the marketing challenges that the revenue through production capacity expansion and better crop
farmers highlighted include transport problems and distance to prices” may help achieve profitability. The model also indicated **Significant at 5% level
the market (35%), competition in the market (15%), post-harvest that when a farmer has received agricultural training and when
losses (9%), and unfavourable prices (7%). This thus presents an farm size increase (these results concur with the economic
theory of economies of scale, which should reduce costs per Conclusion References
opportunity for development of value addition in the tomato value
chain by processing the tomatoes into various tomato processed unit and increase efficiency and productivity), income is likely
to increase as shown by the positive coefficients in the model, This study concluded that there are several challenges faced by 1. Anang, B.T., Zulkarnain, Z.A., & Yusif, F. (2013). Production
products with a longer shelf life. An absence of processing farmers that might affect development of the agro processing
although at 5% they were not significant. On the other hand, a constraints measures to enhance the competitiveness of the
facilities were cited in Ghana for reducing investments (Clottey, industry. These include production challenges (low yields, high
decrease in yield and a fewer number of years spent in school are tomato industry in Wenchi Municipal District of Ghana.
Karbo & Gyasi, 2009) and tomato production, as the produce will input costs, pests, and diseases) as well as post-harvest losses
likely to reduce income as indicated by the negative coefficients. American Journal of Experimental Agriculture, 2(4):824-
be lost due to high perishability and lack of alternative markets and marketing challenges (long distances to markets, lack of
These findings concur with those of Maliwichi, Pfumayaramba 838
or value addition (Table 2). Thirty-six percent of the farmers transport to the market, unfavourable prices, and competition).
& Katlego (2014) that the number of years spent in school, 2. Arah, I.K. (2015). An overview of post-harvest challenges
reported that they would want to have cooling facilities as well These may reduce efficiency and competitiveness of farmers,
which leads to the level of education, is very important for the facing tomato production in Africa. African Studies
as a processing plant so as to reduce post-harvest losses and 15% who might hence not produce at their optimal levels, which
farmers in terms of decision making as reading and writing are Association of Australasia and the Pacific (AFSAAP) 37th
indicated that they would prefer more market infrastructures are needed for development of the agro processing industry.
used in information sharing. The model for the study is thus: Annual Conference – Dunedin – New Zealand – 25-26
to sell their produce, while 11% felt that prices needed to be Moreover, opportunities may exist, should some of the challenges November 2014 Conference Proceedings Africa: Diversity
standardised in the market. Thus some of these challenges are be addressed. These include establishing a processing plant that
Y = 112456.4 + 12737.26AGRT + 1897.18FRMS + and Development.
not unique to Namibia. may be used to process tomatoes into various products, thereby
1773.14FMRCH - 4107.17FRMXH - 21.419AVT + 2.218 EXP 3. Bediako, K., Showemimo, F.N., Buah, J.N., & Ushawu,
- 36399.6FERT - 362.361EDU (1) reducing not only post-harvest losses but also providing a market Y. (2007). Tomato production constraints at Bontanga
Opportunity for the farmers as well. The study recommends that there might irrigation project in the Northern Region of Ghana. Journal
be a need for subsidisation of inputs for the farmers to help them of Applied Sciences, 7(3): 459-461
The opportunity and market for tomato processed products reduce the costs but most importantly, being able to have all the 4. Clottey, V.A., Karbo, N., & Gyasi, K.O. (2009). The tomato
are available locally in the canning industry (fishing), caterers, required input levels for optimum production, which would, in industry in northern Ghana: Production constraints and
schools, hospitals, defence, and retailers. Establishing a tomato turn, create impetus for the need for value addition. Furthermore, strategies to improve competitiveness. African Journal
processing plant is likely to create an additional five to ten there might be need for refresher courses (training) in tomato of food, Agriculture, Nutrition and Development, Agro-
labourers per farmer from the current four to six labourers per production, business/farm management and GAP, which would science, 2 (1): 1436-1451
farmer, as more produce will need to be produced and handled improve production efficiency and have benefits along the value 5. Gujarati, D.N. (2003). Basic Econometrics. McGraw
with demand for tomatoes increasing due to the processing plant chain. Hill Jacobi, I. (2008). Crop Production. Windhoek: Joint
establishment. Presidency Committee (NAU & NNFU).
Acknowledgements 6. Maliwichi, L.L., Pfumayaramba, T.K. & Katlego, T.
Table 2: Scenario for an opportunity for a tomato processing plant (2014). An analysis of constraints that affect smallholder
The authors wish to acknowledge the contribution of the farmers in the production of tomatoes in Ga-Mphahlele,
Minimum size (ha): Minimum Average yield Total yield: minimum Job creation per University of Namibia for assistance financially and transport LepelleNkumbi Municipality, Limpopo Province, South
For production period (tonnes/ha) for processing plant shift during the study and the opportunity to attend the NCRST Africa. Journal of Human Ecology, 47 (3):269-274.
required for (months) (tonnes/year) running conference, during which this paper was presented. Appreciation 7. MAWF (Ministry of Agriculture, Water and Forestry).
processing plant for 176 days is also extended to the NCRST and the organisers for the NCRST (2008). Green Scheme Policy. Windhoek: Ministry of
Current 112.6 8 15 1689.6 Minimum of nine symposium, which enabled the results of the study to be shared. Agriculture, Water and Forestry.
scenario people 8. MAWF (Ministry of Agriculture, Water and Forestry).
(2015). Namibia Agricultural Policy. Windhoek: Ministry
Potential 56.3 8 50 2816 Minimum of 12
of Agriculture, Water and Forestry.
scenario people
Page | 12 Page | 13
9.  MTI (Ministry of Trade and Industry). (n.d. (not dated)).
    Namibia’s Industrial Policy, Republic of Namibia.
    Windhoek: Ministry of Trade and Industry.
10. Odhiambo, M., Kristanson, P. & Kashangaki, J. (1996).
    Comparative Cost of Production in East Africa:
    Implications for Competitiveness and Comparative
    Advantage. USAID, Amex International Inc.
11. Rearden, T., Kelly, V., Crawford, E., Jayne, T., Kimseyinga,
    S. & Clay, D. (1997) Determinants of Farm Productivity in
    Africa: A synthesis of Four Case Studies. Technical Paper
    #75, Department of Agricultural Economics, Michigan
    State University, Amex International Inc,
12. Tey, Y., S., & M. Brindal. (2014). Factors influencing farm
    profitability. Sustainable Agriculture reviews, 47: 235-255

                                                          Page | 14   Page | 15
ENERGY
                 Geomagnetic Disturbance Monitoring and
            18
                 Modelling in Namibia

Page | 16                      Page | 17
Geomagnetic Disturbance Monitoring and Modelling where is the frequency dependent surface impedance and
the permeability of the earth, which is taken as the same as that of
In this research study electrical power network modelling was
performed using the Electric Power Research Institute (EPRI),
in Namibia a vacuum. The surface impedance and the ground conductivity
(or resistivity) is given by:
OpenDSS simulator(Dugan, 2012) as well as the Natural
Resources Canada (NRcan) simulator (Blais, 2012). The
OpenDSS simulator requires the specification of the network
data and the electric field magnitudes into a script, wherefore
(4)
the method of nodal analysis is then applied to compute the
G. Gope1*, S.A. Reju2, E.P Shilongo1 GIC magnitudes. The NRcan simulator however configures
the network from input files containing network component
specifications. The NRCan simulator requires, as inputs the
1
Department of Electrical and Computer Engineering, Namibia University of Science and Technology (NUST), Windhoek, Namibia where is the ground conductivity and is the ground resistivity. time-varying geomagnetic field values from a maximum of two
2
Department of Mathematics and Statistics, Namibia University of Science and Technology (NUST), Windhoek, Namibia (2) geomagnetic field observatories; wherefore the time-varying
*
Corresponding author: ggope@nust.na ; Tel/Cell: (+264) (61) 2072291
2. Quasi-DC current modelling and OpenDSS electric field values are computed, through interpolation, to
simulation determine the electric field intensity along the transmission lines.
Abstract Hydro-Quebec (USA-Canada) power network in March of 1989 The electric field intensity E, and together with a combination of
(Koen & Gaunt, 2003). Research studies carried out in Namibia the Earth’s conductivity model are then applied over the network
Electric field theory relates the E-field to the potential V through: in order to compute the time-varying GICs.
Our sun influences the near-earth atmospheric weather patterns and South Africa have demonstrated the presence of GICs in the
as well as affects the space weather through plasmic eruptions transmission networks of this low and mid-latitude region (Koen
and Corossal Mass Ejections (CMEs) from the sun. When these & Gaunt, 2002), (Ngwira, n.d.), (Zatjirua, 2005), (Simon, 2013) (5) The data loggers maintain a detailed record of the time-stamped
eruptions and CMEs are directed towards the earth, Geomagnetic and (Gope, Stephanus, & Reju, 2015). GIC measurements at each transformer neutral. The data loggers
Disturbances (GMDs) are produced, which may lead to were configured and initialised with a sampling interval of 0.62
perturbations within the magnetosphere of the earth, leading to the Materials and methods (6) milliseconds.
production of Geomagnetically Induced Currents (GICs) in the
technological and conductive infrastructure on earth. This paper Electrical power network modelling and mathematical modelling According to Ohm’s law, an E-field drives a current through 3. Wavelet analysis and GIC characterisation
presents a methodology for studying the effects and extent of GICs tools were applied so as to estimate the possible GICs flowing a conducting structure, as shown in Figure 1. This current is
flows in High Voltage (HV) transmission networks, the modelling in the transmission network to emulate the flow of GICs within known as the GIC. Part of the research project focused on the application of the
tools used in the study of GICs in HV transmission networks, and Namibia’s 220-400kV HV power network and to analyse the wavelets analysis to GIC emulations using the quasi-DC current
the analytical techniques used in the characterisation of GICs in nature and characteristics of the GICs. Various modelling The mathematical model used to compute the induced DC model of the 220-400kV HV network in Namibia.
the frequency-time domain. The paper discusses and presents techniques have been developed and incorporated in various GIC voltages, VDC, in power transmission lines and/or across any
the results of the wavelet analysis as used to analyse the non- studies presented in this paper. two points within the earth’s geo-conductive structure, is based When time-domain signals are to be analysed, it is often usual to
stationary current waveforms encountered in the study. on a closed-loop integral of the electric field intensity E along obtain a time-amplitude representation of the signal. However,
1. Geo-electromagnetics and earth conductivity and in the direction of the transmission line: this representation is not always the best representation for most
Keywords: GICs, OpenDSS, NRcan simulator, wavelet signal processing-related applications, since in many cases,
modelling the most distinguished information is hidden in the frequency
Introduction content of the signal.
A geomagnetic storm is a temporal variation in the earth’s
geomagnetic field, primarily due to magnetospheric-ionospheric Wavelets have very interesting applications and the most common
GMDs are perturbations in the earth’s geomagnetic field, which (7)
currents, and secondarily due to currents flowing in the earth’s use of wavelets is in signal processing applications. In a Fourier
are brought about by the interactions between magnetic fields,
structure. The temporal variation of the geomagnetic field analysis, a signal is decomposed into periodic components (Lirunga,
created as a result of particulate and plasmic eruptions from
produces a geoelectric field according to Faraday’s law of 2014) and (Mathworks, n.d.). However, in a wavelet analysis, a
the sun, and the earth’s geomagnetic field (Power and Energy
induction, expressed in the generalised Maxwell’s equation as: signal is decomposed into components localised in both time and
Magazine, 2013). GICs are therefore manifestations and the
end results of the interaction between these magnetic fields. frequency domains. Thus, wavelet transforms are ideal when signals
According to Faraday’s law of electromagnetism, this is usually are not periodic and hence non-stationary (Polikar, n.d.).
(1)
expressed as one of the Maxwell’s equations; the perturbations
in the geomagnetic fields (B-fields) lead to spatial variations in
the earth’s geo-electric (E-fields) (Gope, Dax, Reju, & Cilliers, Figure 1: GIC current flow in power networks (Power and Energy Magazine, 2013)
where E represents the induced electric field at the surface of
2015). The GMDs originate from the sun as CMEs and propagate
the earth in V/m and B is the geomagnetic field in T, is the
through space before interacting with the inherent geomagnetic
temporal variation of the geomagnetic field, and is the spatial
field of the earth within the earth’s magnetosphere. As a result,
derivative curl operator acting on E.
GICs are considered as manifestations of space weather-related
phenomena that lead to the induction of geoelectric fields in any
In the frequency domain, (Eqn..1) relates the horizontal
conducting infrastructure on the earth and or within the earth’s
components of the B-field on the surface of the earth to the
geo-conductive structures. The sun exhibits a cyclic 11-year
respective orthogonal components of the E-field for local plane
pattern that is shown by the sunspot activities on the sun (Koen
wave such that:
& Gaunt, 2002). GICs may have adverse effects on transmission
networks, as they cause half-cycle saturation of transformer cores,
which lead to reactive power dynamics and systematic power
(2)
system problems leading to possible power system stability
problems. The most eminent and widely reported systematic
power system failure is the blackout that occurred within the (3)
Page | 18 Page | 19A wavelet is a wave-like oscillation with amplitude that begins at July 2013 geomagnetic storm were further carried out and Figure 3: Ruacana GIC time series (left) and frequency (right) for 17 March 2015
zero, increases, and then decreases back to zero. It can typically resulted in combined correlation coefficients above 60% when
be visualised as a “brief oscillation” or a “small wave.” Wavelets polarised data was utilised. Time domain Frequency domain
are defined by the wavelet function ψ(t) and scaling function ϕ(t) 0.4 40
in the time domain. The scaling function is a refinable function, Exploring the MATLAB Wavelet Toolbox, a selected family
that is, a fractal functional equation, called the refinement of the wavelet group was employed to study the low and high
30
0.3
equation (or dilation equation) (Ndadi, 2015): pass filters associated with the geoelectric field signals for some
20
available data in 2012 and 2014. Moreover, a similar analysis 0.2
was done to study the wavelet profiles of GIC emulation results,
10
using the 17 March 2015 geomagnetic storm data and focusing 0.1
on the following substations, namely, Ruacana, Omburu,
Magnitude (dB)
(8)
Amplitude
0
Kokerboon and Auas, with the first two having their frequency
and wavelet simulations depicted in Figures 3, 4, 6 and 7.
0
-10
where the sequence a0,…,aN-1 of real numbers is called a A look at the Figure 5 above reveals a symmetric GIC profile -0.1
-20
SCALING sequence or scaling mask. The wavelet proper is for the Ruacana-Omburu 330kV line while specifically showing
obtained in a similar linear combination: that the GICs at the two substations were the same at some -0.2
-30
specific times during the 24-hour period. A simple conclusion
that could be drawn from this is that any effect of GIC on -0.3 -40
200 400 600 800 1000 1200 1400 0 0.1 0.2 0.3 0.4 0.5 0.6 0.7 0.8 0.9
transformers, for example, likely appears to be the same at such Samples Normalized Frequency ( rad/sample)
(9) specific times. Thus a mitigation put in place in one substation
is recommended in the other. However, the most interesting
results shown in Figure 6 and Figure 7 are that the high filter
signals or wavelets (represented by d1) are the same for the two
Figure 4: Omburu GIC time series (left) and rrequency (right) for 17 March 2015
where the sequence b0,…,bM-1 of real numbers is called a substations despite their symmetric profiles. The above analyses
WAVELET sequence or wavelet mask. Wavelet transform is would be done for other HV lines in the network so as to have
Time domain Frequency domain
a tool that cuts up data, functions, or operators into different a complete knowledge of hidden GIC information not explicit 0.3 40
frequency components and then studies each component with a from the Fourier analyses of the signals.
resolution matched to its scale. Thus it allows us to view a time 0.2
30
history in terms of its frequency components. Conclusion
20
0.1
Results The earth’s magnetosphere, due to its geomagnetic field, plays
10
an important and protective role to both biological (flora and 0
The OpenDSS simulation was carried out using the electric field fauna) and technological systems on the earth. Besides this
Magnitude (dB)
Amplitude
0
data for the 1989 geomagnetic storm. The peak electric field protection, technological systems, like oil and gas pipelines,
-0.1
values were calculated using the South African surface impedance railway tracks, satellite and telecommunication systems, and -10
using the uniform plane wave method. The simulation results power transmission systems have not yet been designed to be
showed large magnitudes of up to 30.14A in the transmission completely immune to space weather effects. Research studies -0.2
-20
line between the Auas Substation (centrally located and on the in the field of GIC provide a useful insight into the physical
outskirts of Windhoek) and Van-Eck Substation. The research phenomenon that leads to the flow of these currents and greatly -0.3
-30
study further argued that there may be no GIC flows in the inform any scientific and engineering mitigation strategies,
Caprivi Link HVDC line due to the star-delta connection of the which must be put in place in order to minimise the risk and -0.4 -40
HVDC converter transformers at the HVDC converter stations. exposure of technological systems to these physical phenomena. 200 400 600
Samples
800 1000 1200 1400 0 0.1 0.2 0.3 0.4 0.5 0.6
Normalized Frequency ( rad/sample)
0.7 0.8 0.9
The NRcan modelling and investigations were aimed at The results of the GIC monitoring activities in Namibia have
improving on the OpenDSS modelling and emulation results. shown the importance of the research project in raising awareness
Further, the NRcan investigations also focused on the validation within Namibia’s electric power utility, NamPower, as five
of the modelling results with practical measurements extracted participants from the utility attended the research project’s joint Figure 5: Superposed Ruacana-Omburu symmetric GIC plots for 17 March 2015
from the NI data loggers. The NRcan emulations were performed GIC workshop held at the Polytechnic of Namibia in October 0.4
using a KpFigure 6: Ruacana low and high filtered GIC Figure 7: Omburu low and high filtered GIC
profiles for 17 March 2015 profiles for 17 March 2015
Acknowledgement 5. Koen J, & Gaunt C T. (2002). Disturbances in the Southern
African power network due to geomagnetically induced
The authors are grateful for the support received from the currents (p. Paper 36-206). Presented at the Cigré Session,
governments of Namibia and South Africa, through their bilateral Paris.
cooperation and collaboration agreements on research, science 6. Koen J, & Gaunt CT. (2003). Geomagnetically induced
and technology. The authors would also like to acknowledge the currents in the Southern African electricity transmission
administrative and academic support received from the Namibia network. Presented at the IEEE Powertech, Bologna.
University of Science and Technology’s (NUST) Institutional 7. Lirunga, D. (2014). Application of Fourier Transform in
Research and Publication Committee (IRPC), under its Geomagnetic Induced Currents Modelling (BSc (Hon)
resolution POLY/2014/9364/867 and the Project Services Unit Project). Windhoek, Namibia: Polytechnic of Namibia.
(PSU). Last but not least, the authors would like to acknowledge 8. Mathworks, (n.d.). Short Time Fourier Transform. Retrieved
the technical support from the Namibian National Power utility from http://www.mathworks.com
company (NampPower) through Mr Braam Vermeulen and Mr 9. Ndadi, I. D. . (2015). Application of wavelets to NamPower
Ernst Krige. network signal analysis (BSc (Hon) Project). Windhoek,
Namibia: Namibia University of Science and Technology.
10. Ngwira, C. (n.d.). Geomagnetically induced current
characteristics in Southern Africa. Rhodes University,
References
Herman, South Africa.
11. Polikar, R. (n.d.). Multiresolution Analysis: the Discrete
1. Blais, C. (2012, April 3). GIC Simulator- Stand-alone wavelet transform. Retrieved from http://users.rowan.
version. Geomagnetic Laboratory of Canada. Retrieved edu/~polikar/WAVELETS/WTpart4.html
from http://www.nrcan.gc.ca/energy/software-tools/7417 12. Power and Energy Magazine. (2013). Geomagnetic
2. Dugan, R. C. (2012, October). OpenDSS Training Workshop. Disturbances: Their Impact on the Power Grid. IEEE Power
Presented at the PNM Resources OpenDSS Training and Energy Magazine, 11(4), 71–78. http://doi.org/10.1109/
Workshop, Alvarado Conference Center Albuquerque, NM. MPE.2013.2256651
Retrieved from http://smartgrid.epri.com/Simulation Tool. 13. Simon, M. (2013, December). Estimation of Geomagnetically
aspx Induced Currents (GICs) in the Namibian Transmission
3. Gope, G., Dax, K., Reju, S. A., & Cilliers, P. (2015). Network. University of Cape Town.
Geomagnetically induced current model for the Namibian 14. Zatjirua, T. (2005). Geomagnetically Induced Currents in
High Voltage Network. In AFRICON, 2015 (pp. 1–7). http:// the Transmission Network of Namibia. University of Cape
doi.org/10.1109/AFRCON.2015.7331982 Town, Cape Town, South Africa.
4. Gope, G., Stephanus, H., & Reju, S. . (2015). On the
Improvement and Validation of the Geomagnetically Induced
Current Model for the 220kV-400kV Namibian Power
Network. In Proceedings of the Pan African Conference on
Science, Computing and Telecommunications (PACT), (pp.
20–25). Kampala, Uganda: Makerere University.
Page | 22 Page | 23ENVIRONMENT
Environmental and Anthropogenic Spatial and Temporal
26
Patterns of Photosynthetic Efficiency of Welwitschia
Mirabilis Hook in the Central Namib Desert
Page | 24 Page | 25Environmental and Anthropogenic Spatial and Temporal uranium mine that is currently being constructed, while parts of
the Gobabeb population experience intermittent but sometimes
A one-second light pulse of 650 nm at a light intensity of 3500
μmol m-2 s-1 was given. Measurements were done at night (to
Patterns of Photosynthetic Efficiency of Welwitschia Mirabilis heavy browsing by domestic horses (own observations). ensure dark adaptation of leaves) on two separate leaves from
each plant (Strasser et al., 2004). Furthermore, measurements
Hook in the Central Namib Desert The study was stratified using tertiary-level catchments, because
it is expected that the flow of water on the ground and into the
were repeated three times: December 2014 (after a prolonged
dry spell), January 2015 (after about 10 mm of rain had fallen
vadose zone varies with catchment and thus results in spatial on all study sites), and April 2015 (after another rainy spell of
T. Shuuya1*, T. Wassenaar1, B. Curtis2, G. Krüger3, J. Berner3 differences in photosynthetic efficiency. Five catchments were about 3 mm).
digitised from the Digital Elevation Model (DEM) (Abrams,
2000). Three catchments, Welwitschia campsite, river channel Results
1
Gobabeb Research and Training Centre, Namib Naukluft Park, Namibia and Zone 6, are located at the Welwitschia Plains, whereas two
2
Department of Agriculture and Natural Resources Sciences, Polytechnic of Namibia, Namibia catchments, Welwitschia Wash and Hope Mine are found near Differences in chlorophyll a fluorescence patterns were
3
Research Unit Environmental Sciences and Management, North-West University, South Africa
Gobabeb (Figure 1). From each catchment, 20 Welwitschia observed across catchments for December, January, and April
*
Corresponding author: Email: tituss@gobabebtrc.org ; Tel: (+264)64 694199
plants were randomly selected from the available database by (Figure 2). A higher OJIP transient of were observed in April for
using a random point selector module in ArcGIS 10.2. the Welwitschia Wash catchment in comparison to January and
Abstract has been one of the main tourist attractions of the central Namib
and a subject of several scientific studies (Henschel & Seely, December (Figure 2). The large differences between the OJIP-
Chlorophyll a florescence measurements were taken on dark transient of the Welwitschia Wash can most likely be attributed
Welwitschia mirabilis (Welwitschia) is a long-lived gymnosperm 2000). In the central Namib, there is a reference population of
adapted (at least one hour) leaves using a handy PEA instrument to the new growth after being grazed by horses (Figure 2).
endemic to the Namib Desert. It occurs from the Kuiseb about 52,000 individuals occurring south of but adjacent to the
(Hansatech, UK). Chlorophyll a fluorescence is a non-invasive Rainfall in January (ca 10 mm) and April (ca 2.5 mm) across all
River in Namibia to the Nicolau River north of the Namib in developing Husab Mine, slated to become the second largest
and inexpensive technique used to quantify the photosynthetic catchments most probably resulted in the higher OJIP-transient
Angola, in a region where the rainfall varies from < 50 mm to uranium mine in the world (Kananjembo & Kilbourn, 2013).
performance, particularly that of photosystem II (Strasser, when compared to December (Figure 2). The Welwitschia
about 200 mm per annum. It is protected by law in Namibia The cumulative impacts from the developing mine (potential
Tsimilli-Michael, & Srivastava, 2004). Based on the theory campsite catchment had constant low chlorophyll a fluorescence
and is also listed as a CITES Appendix II plant. In the central impacts include interference with water supply and deposition
of energy fluxes in biomembranes, photochemical efficiency when compared to other catchments, suggesting plants being
Namib Desert, there is a reference population of about 52,000 of dust) are likely to be additional to the factors that normally
and the processes of non-photochemical de-excitation can subjected to higher environmental stress levels than the other
individuals occurring south of but adjacent to the developing affect the photosynthetic efficiency and plant health in general of
be investigated (Strasser et al., 2004), providing a variety of catchments (Figure 2).
Husab Mine, slated to become the second largest uranium mine Welwitschia, yet it is not known how Welwitschia will respond
perspectives on the plant’s overall ability to respond to light
in the world. The cumulative impacts from the developing mine to these potentially deleterious conditions (Farmer, 1993;
energy. The current study focused on the so-called “OJIP transient
(potential impacts include interference with the water supply Goeller & Stobart, 2010; Petrick, 2013). These impacts and the Discussions
test.” The absorption of light energy initiates a charge separation
and deposition of dust) are likely to be additional to the factors changing baseline conditions might affect their physiological
between an electron donor and acceptor at the pigment antenna,
that will affect the photosynthetic efficiency, yet it is not known processes, and thus their growth and reproduction (Hüner &
which can be quantified in four successive response steps: the All the plants responded to what were in all respects a few very small
how Welwitschia will respond to these potentially deleterious Hopkins, 2008).
O-step (initial fluorescence at 0.05 ms), J-step (fluorescence at 2 rainfall events, with the OJIP curves increasing with cumulative
conditions. In this study the photosynthetic efficiency of ms), I-step (fluorescence at 30 ms), and P-step (fluorescence at rainfall. In the natural environment, Welwitschia plants tend to
Welwitschia was investigated by measuring chlorophyll a The study occurred before any significant impacts from mining.
300 ms) (Strasser et al., 2004). Although each of these steps (in experience various natural and anthropogenic stressors, which
fluorescence across the landscape and how these change over Anthropogenic dust sources during and before the study period
addition to several in-between steps not discussed here) provide will ultimately influence the OJIP transient patterns over time.
time. The study investigations show a clear effect of topography were small, being mostly limited to exploration activities, and
a specific perspective on the physical reactions associated with Natural stressors may interfere with the electron requirement
and various stressors, with plants in different catchment being no large structures had yet been built that could interfere with
the photosystem II process, for this study, information from and transport for photosynthesis, causing photoinhibitory
clearly healthier (with higher photosynthetic efficiency) than surface hydrology. As such, this study represents an investigation
each separate step was not extracted but rather focuses on the damage of the photosystem II reaction centres, thus affecting
others. Episodic rainfall of about 10 mm measured across all of the effects of natural drivers – principally rainfall, study
overall pattern of response. The study referred to the whole the photosynthetic efficiency (Herppich, Flach, von Willert, &
catchment increased the photosynthetic efficiency at all study site, and to an extent, also topography – on the physiological
stepped monotonic response curve as the OJIP transient and Herppich, 1996; Strasser et al., 2004; Van Heerden, Krüger, &
sites. Spatial and temporal patterns of photosynthetic efficiency health of Welwitschia. The chlorophyll a fluorescence signal
used the relative position of the whole curve as an indication of Kilbourn Louw, 2007). Furthermore, anthropogenic stressors,
of Welwitschia are associated with various environmental and was measured as an indicator of photosynthetic efficiency and
differences among catchments. such as browsing by domestic animals, probably caused the
anthropogenic stressors. This study aims to provide possible patterns of chlorophyll a fluorescence among catchments in two
management strategies for mines and other developments that study populations were compared.
may have adverse impacts on Welwitschia populations by
The study aimed to improve understanding of the relationship Figure 1: Outlines of the three catchments (Welwitschia campsite, Zone 6 and river channel) at
understanding its current health status across the landscape and
over time. of various natural driving factors to the plant’s health to better Welwitschia Plains and two catchments (Welwitschia Wash and Hope Mine) at Gobabeb population
gauge the potential additional impact caused by mining and to with their drainage networks
Keywords: Welwitschia, chlorophyll a fluorescence, OJIP provide possible monitoring tools and management strategies.
transient, photosynthetic efficiency, Photosystem II The findings from this study may in the future also aid restoration
measures, such as translocation and re-introduction of this
Introduction unique plant, but will mainly form the basis of a management
plan for the species.
Welwitschia mirabilis (Gnetales: Welwitschiaceae), commonly
known as Welwitschia, is a long-lived gymnosperm endemic Materials and methods
to the Namib Desert (Cooper-Driver, 1994; Henschel & Seely,
2000). It occurs from the Kuiseb River in Namibia to the Nicolau The study was conducted in the central Namib within the Namib
River north of the Namib in Angola, in a region where the rainfall Naukluft Park (NNP), at two distinct Welwitschia populations
varies from < 50 mm to about 200 mm per annum (Henschel & study sites; Welwitschia Plains and at Gobabeb (Figure 1). The
Seely, 2000; Jacobson & Lester, 2003). It is protected by law two study sites differed in their location relative to an east-west
in Namibia and is also listed on Appendix II of the Convention moisture gradient, with Gobabeb being drier, but also receiving
on International Trade in Endangered Species (CITES). somewhat more fog than the Welwitschia Plains. In addition,
Welwitschia is a unique plant, both in appearance and biology. It the Welwitschia Plains population is located next to a large
Page | 26 Page | 27Figure 2: Chlorophyll a fluorescence transient plotted against logarithm time scale across catchments drivers. The study was a once-off study conducted over only a 9. Henschel, J., & Seely, M. K. (2000). Long-term growth
over time (December: n = 18 for Welwitschia Wash and n = 20 for other catchments; January: n = 20 short part of the year. Considering the longevity of Welwitschia, patterns of Welwitschia mirabilis, a long-lived plant of the
longer-term studies should now be conducted to understand the Namib Desert (including a bibliography). Plant Ecology,
for other catchments, n = 14 for river channel and n = 9 for Zone 6; April: n = 20 for all catchments)
spatial and temporal patterns of photosynthetic efficiency of 150(1-2), 7–26.
Welwitschia. 10. Herppich, W., Flach, B., von Willert, D., & Herppich, M.
(1996). Field investigations of photosynthetic activity,
Acknowledgements gas exchange and water potential at different leaf ages
in Welwitschia mirabilis during a severe drought. Flora:
Gobabeb and Swakop Uranium staff, who assisted with the data Morphologie, Geobotanik, Oekophysiologie.
collection. The NCRST in Namibia and the National Research 11. Hüner, N. P., & Hopkins, W. G. (2008). Introduction to plant
Foundation in South Africa for financially supporting the study physiology (Fourth edition). Wiley, New York.
under the South African-Namibian joint research grant. 12. Jacobson, K. M., & Lester, E. (2003). A first assessment of
genetic variation in Welwitschia mirabilis Hook. Journal of
Heredity, 94(3), 212–217.
References 13. Kananjembo, A., & Kilbourn, M. (2013). Research
collecting permit 1653/201 study report - Welwitschia
1. Abrams, M. (2000). The Advanced Spaceborne Thermal mirabilis. Swakopmund: Swakop Uranium.
Emission and Reflection Radiometer (ASTER): data 14. Paige, K., & Whitham, T. G. (1987). Overcompensation in
products for the high spatial resolution imager on NASA’s response to mammalian herbivory: the advantage of being
Terra platform. International Journal of Remote Sensing, eaten. American Naturalist, 407–416.
21(5), 847–859. 15. Petrick, W. (2013). Environmental Impact Assessment
2. Belsky, J. (1986). Does herbivory benefit plants? A review report amendment for the proposed changes to Husab mine
of the evidence. American Naturalist, 870–892. (unpublished SLR project no.: 7NA.13001.00004 No. 2).
3. Belsky, J., Carson, W., Jensen, C., & Fox, G. (1993). Namibia: SLR consulting Namibia (Pty) Ltd.
reduction in photosynthetic efficiency, causing photoinhibition is known to play a critical role in the plants’ survival (Eckardt Overcompensation by plants: herbivore optimization or red 16. Retuerto, R., Fernández-Lema, B., & Obeso, J. R. (2006).
of plants at Welwitschia Wash in December (Figure 2a). Plants et al., 2012; Henschel & Seely, 2000). Apart from breaking seed herring? Evolutionary Ecology, 7(1), 109–121. Changes in photochemical efficiency in response to
at Welwitschia Wash were observed to be intensively browsed dormancy, increasing recruitment, and stimulating other growth 4. Brinckmann, E., & von Willert, D. (1987). Injury and herbivory and experimental defoliation in the dioecious tree
up to the meristem every month (ca six months). However, patterns, Henschel & Seely (2000) showed that Welwitschia leaf recovery of Welwitschia mirabilis. Dinteria, 19, 69–76. Ilex aquifolium. International Journal of Plant Sciences,
browsing stopped in December and plants recovered remarkably growth rate quadrupled in three years after episodic rainfall of 5. Cooper-Driver, G. A. (1994). Welwitschia mirabilis-a dream 167(2), 279–289.
from such stress condition in January and April, as shown on less than 11 mm. Availability of moisture is a critical limiting come true. Arnoldia, 54(2), 2–10. 17. Strasser, R. J., Tsimilli-Michael, M., & Srivastava, A. (2004).
the OJIP-transient curves (Figure 2a, b). Damage to Welwitschia factor for Welwitschia plants and plants may efficiently use 6. Eckardt, F. D., Soderberg, K., Coop, L. J., Muller, A. A., Analysis of the chlorophyll a fluorescence transient. Springer.
plants, including browsing by wild animals, has been reported every little bit of moisture available during such episodic rainfall Vickery, K. J., Grandin, R. D., … Henschel, J. (2012). The 18. Thomson, V. P., Cunningham, S. A., Ball, M. C., & Nicotra,
in several studies, but no evidence of adverse impacts on their for growth, reproduction, and development. The photosynthetic nature of moisture at Gobabeb, in the central Namib Desert. A. B. (2003). Compensation for herbivory by Cucumis
survival have been observed (Brinckmann & von Willert, 1987; efficiency of Welwitschia varies across catchments and changed Journal of Arid Environments, 93, 7–19. sativus through increased photosynthetic capacity and
Cooper-Driver, 1994). However, continuous intensive browsing over time in relation to the natural and anthropogenic phenomena. 7. Farmer, A. M. (1993). The effects of dust on vegetation—a efficiency. Oecologia, 134(2), 167–175.
by domestic animals might threaten their survival. review. Environmental Pollution, 79(1), 63–75. 19. Van Heerden, P. D. R., Krüger, G. H. J., & Kilbourn Louw,
Conclusion 8. Goeller, J., & Stobart, B. (2010). Environmental M. (2007). Dynamic responses of photosystem II in the
Furthermore, browsing by domestic animals tends to lead to Impact Assessment report for the proposed Husab mine Namib Desert shrub Zygophyllum prismatocarpum during
compensation growth rate systems (Belsky, Carson, Jensen, & (unpublished report for Swakop Uranium, Husab mine and after foliar deposition of limestone dust. Environmental
The results provide the first look at how stress affects this unique
Fox, 1993; Belsky, 1986; Paige & Whitham, 1987). As a result, project). Johannesbur Pollution, 146(1), 34–45.
plant species at a physiological level and suggest a number of
browsed plants tend to have positive, rapid growth in response questions about the levels of stress it can endure. Given that
to browsing, exceeding that of the undamaged plants. This might the plant probably relies on groundwater, it is possible to find
be the reason why plants at Welwitschia Wash catchment grew consistent differences among catchments, as this would reflect
fast after browsing. This, however, may require more scientific different hydrological schemes. This was evident especially
evidence through comparative studies on a long-term scale. in the low photosynthetic response of the plants located at the
Furthermore, variation in the photosynthetic efficiency of plants Welwitschia campsite and at the Welwitschia Wash catchments
located at Welwitschia Wash might be due to the carbohydrate in December. Episodic rainfall does increase the rate of
sink-source dynamic mechanism that plants may develop. Such photosynthesis, implying that chlorophyll a fluorescence is a
mechanism may trigger plants to absorb more light energy sensitive indicator of the plant’s level of water stress. However,
while freeing the reserved carbohydrates during the sink-source the swift increase in photosynthesis after rain also implies that
dynamics to contribute to the photosynthesis and thus to an a weak photosynthesis signal is probably a natural but rapidly
increase in the photosynthetic efficiency (Belsky et al., 1993; reversible response to episodic and ephemeral stressors. A
Belsky, 1986). similar and somewhat more dramatic increase in photosynthesis
in browsed plants after rain showed that the plants can also
Recent studies indicate that damaged plants are likely to have integrate an anthropogenic stressor without becoming fatally
a higher photosynthetic efficiency and an increased proportion compromised, at least not in the short period that they were
of light energy absorption, which can be utilised during observed.
photosynthesis (Retuerto, Fernández-Lema, & Obeso, 2006;
Thomson, Cunningham, Ball, & Nicotra, 2003). In addition, the As a tool to be used in long-term monitoring, the method has high
increase in the photosynthetic efficiency and leaf growth rate potential. However, a fuller understanding of how Welwitschia
could have been accelerated by the episodic rainfall that occurred reacts to different stressors will require long-term spatial and
during January and April. Episodic rainfall in the Namib Desert temporal integration and across a number of other potential
Page | 28 Page | 29You can also read