Presentation Slides UBS ASEAN Conference 2012 - Finanznachrichten
←
→
Page content transcription
If your browser does not render page correctly, please read the page content below
Presentation Slides
UBS ASEAN Conference 2012
                            Monday, 3 September 2012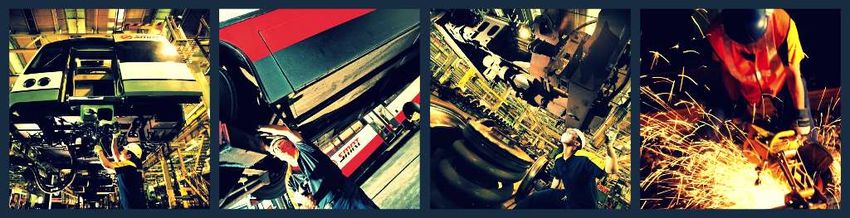
Moving People, Enhancing Lives
To be the customer’s choice by providing a safe,
reliable and friendly travel experience that is
enhanced through convenient and innovative
services
CORE VALUES
Excellence
Respect
Responsibility & Recognition
Commitment to the public,
shareholders & employees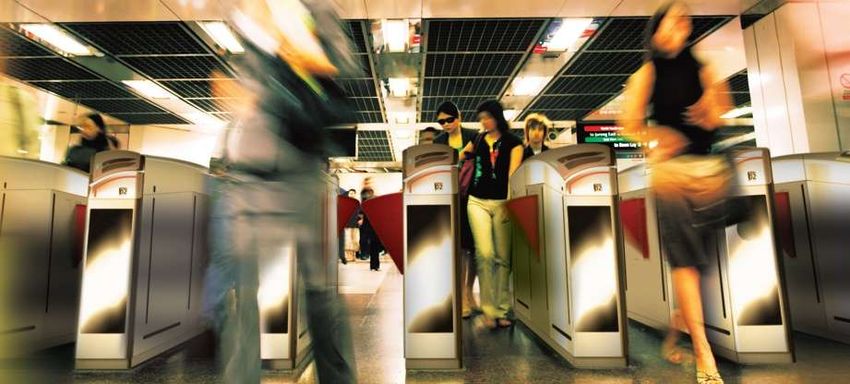
Multi-Modal Land Transport Operator

              MRT                          LRT                            Bus

  Fare
Business

                                                     Engineering
       Taxi         Rental & Advertising         Consultancy & Services

                                                                            Non-fare
                                                                            Business

                                     3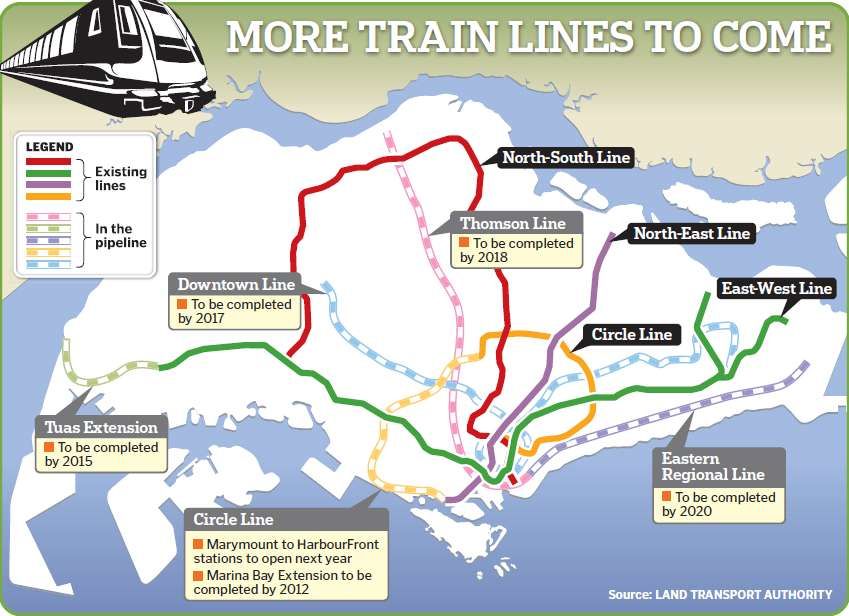
Business Segmentation
                    FY2012 Revenue (S$1.06b)
                    Rental Eng & Others
                     7%         3%
      Advertising
         3%

           Taxi
           11%

                                               Rail
              Bus                              55%
              21%

 Fare Business : 75.7% of Revenue and 38.6% EBIT

Non-Fare Business: 24.3% of Revenue and 61.4% EBIT

                                          4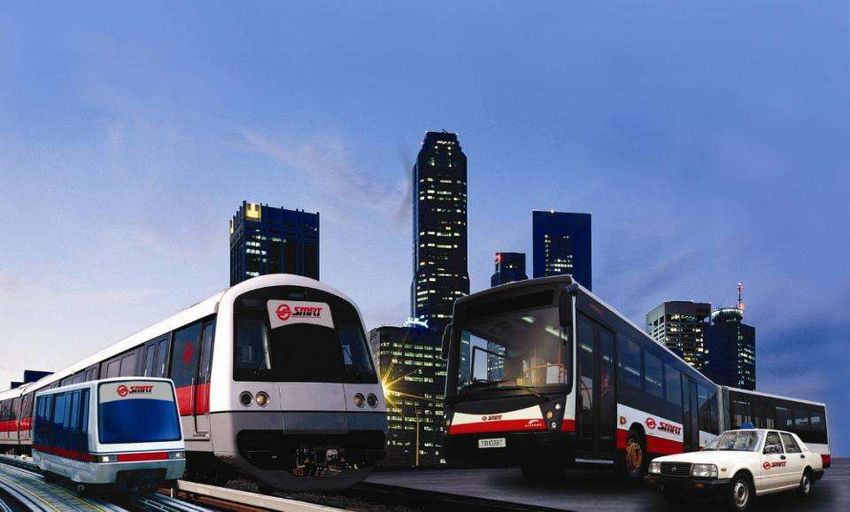
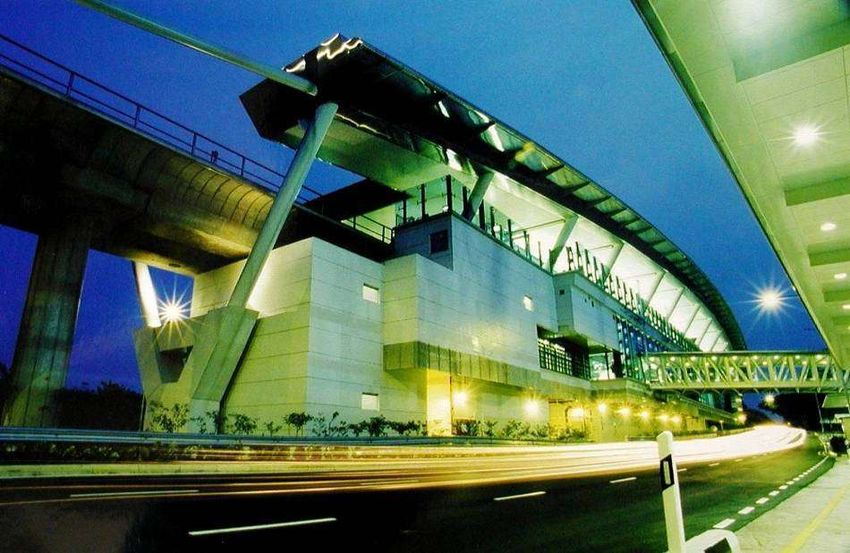
Fare Business – At A Glance

• Dominant rail operator in Singapore with 25 years of
  O&M experience since 1987
• Operates the North-South East-West Line and Circle
  Line with 78 stations and total route length of 128.6km
• Commands about 78% market share with average daily
  ridership of 1.8 million

 • Operates first LRT system at Bukit Panjang since 1999
 • Network comprises 7.8km of elevated guide ways
 linking 14 stations in Bukit Panjang
 • Average daily ridership of 51,500

                                                                North-South East-West Line

                                                                Circle Line
• Owns about 1,050 buses running 94 basic bus services
  between Western and North-Western areas and the rest          North-East Line
  of Singapore
• About 25% market share based on average daily
  ridership of 888,000

                                                            5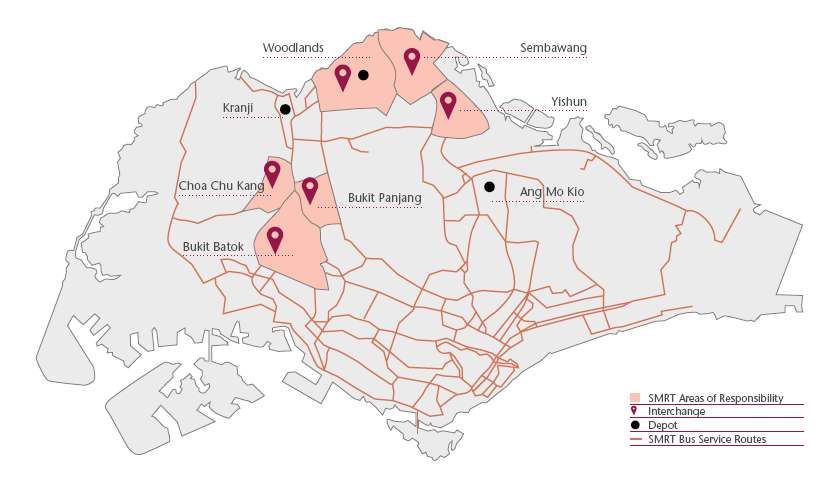
License and Operating Agreement
Ownership of
Ownership Of
Non- Operating Maintenance Terms
Operating Assets
Assets
License effective from 1998
- 2028 (30 years)
NSEW Line Pays nominal annual
license Fee
Complies with performance
standards
License effective from 2009
*First 10 years
(10+30 years)
Circle Line Pays nominal annual
license Fee
Complies with performance
standards
*Operating assets (trains, signaling systems , automatic fare collection systems etc) for CCL are paid and owned by LTA for the first
10 years. SMRT trains will have to purchase the operating assets after 10 years based on its net book value.
6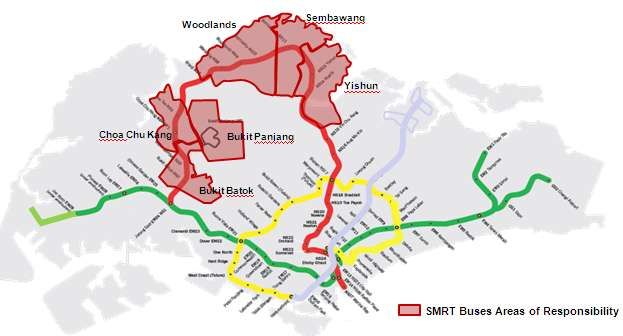
Regulated Fare Adjustments
                              *Formula to yield maximum fare adjustment for the year:

                                       0.5 x CPI + 0.5 x WI – 1.5%
                                 where 1.5% is the productivity index valid for 3 years;
                                  CPI is Consumer Price Index and WI is Wage Index

*Formula is currently being reviewed by the Fare
    Review Mechanism Committee (FRMC).

                                                                                                  Implementation of
                                                                           50              Distance-based fare in July 2010;
                                                         40                               expiry of temporary 3% fare rebate

                   25                 25

                   1.7               1.1                 0.7                                                 1.0
                                                                                           0.5
                                                                           -4.6
                 2006                2007               2008               2009           2010              2011

                                            Rebates (cents)    1      Actual Fare Increment (%)

                 1 Transfer   rebates are applicable for the second and subsequent legs of a public transport trip

                                                                       7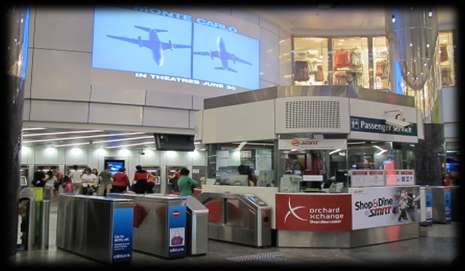
Rising Rail and Bus Ridership
  (Millions)

700.0                                                                                                                                    14.0%
                                                                                                                    654.4

                                                                                            603.9
600.0                                                                                           12.6%                                    12.0%
                                                                    536.6
                                             510.2
500.0                          469.3                                                                                                     10.0%
               434.9                            8.7%
                                                                                                                        8.3%
                                  7.9%
400.0                                                                                                                                    8.0%            Trains
                                                                                                7.0%
                                                                                                                                                         Buses

300.0                                                                                                                                    6.0%            Train yoy growth
                  5.1%                                                  5.2%
                                                                                                                        4.9%
                                                                                                                                                         Buses yoy growth
                                                3.9%
200.0                                                                                                                                    4.0%
                       270.3
                                  2.6%                                                             311.2                    326.4
                                     277.3           288.0                  290.8
                  1.9%
100.0                                                                                                                                    2.0%
                                                                        0.7%

  0.0                                                                                                                                    0.0%
                 FY2007          FY2008        FY2009                  FY2010                  FY2011                  FY2012

                                              For monthly ridership figures, please refer to http://www.smrt.com.sg/AboutSMRT/InvestorRelations/KeyOperatingMatrix/Trains.aspx

                                                                               8
Expanding the MRT Network
New Opportunities!
Thomson Line
30km underground line to relieve
crowding on NS Line
Expected to open in 2019
Eastern Region Line
13km underground line to relieve
crowding on EW Line
Expected to be completed by 2020
Tuas West Extension Marina Bay Extension
Extends from Joo Koon station Connects to the Marina Bay Cruise centre.
7.5km, 4 stations Expected to be completed in 2014
Expected to be completed by 2016
9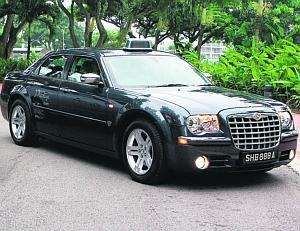
Bus Business
New Eco-friendly MAN A22 Buses
94 Public Bus Services
Fleet Expansion - 954 buses in FY2010 to
more than 1,050 buses
45 chartered bus services SMRT Buses operates 6 bus interchanges, 3 depots and 2 bus terminals.
More than 50 buses and mini-buses
BSOL agreement
10 year license due in Sept 2016
Bus routes to operate are awarded as part of license
PTOs have to comply with QoS standards – Reliability; Loading; Availability; Safety
Fare formula similar to trains
Upgrading more than 300 articulated buses
over the next five years.
10Fare Historical Financials
Fare Revenue ($m) EBIT from Fare Operations ($m)
700 140.0 130.4
128.9 129.3
580.0 113.1
600 120.0
536.5
483.5 489.4
500 445.5 100.0 90.7
400 80.0
300 60.0
207.2 213.1 220.4
195.9 199.7
200 40.0
100 20.0
1.5 (4.9) (11.6)
(1.9) (1.7)
0.0
0
2008 2009 2010 2011 2012
2008 2009 2010 2011 2012
(20.0)
Bus Rail Bus Rail
*Rail financials include MRT and LRT
11Non-Fare Business - At A Glance
• Manages and leases a fleet of more than 3,000 taxis, with more than 95% average
hired-out rate
• Approximately 12% market share; continuing to renew & expand taxi fleet
RENTAL
• Leases approximately 34,400sqm of commercial space within the train network
• More than 720 shop units with 98% occupancy rate
• Refurbished a total of 43 stations (78 stations in network) since FY2005
• Provides advertising spaces on trains, buses, taxis and stations
• Leverage on growing riderships and interactive media platforms to attract
advertisers – e.g iViewSMRT, iMobSMRT etc.
• Pursuing overseas land transport opportunities
• Pursuit of opportunities relating to O&M franchises, consultancy and training,
focusing on the Middle East and Asia Pacific markets
12Taxi Industry Landscape
Singapore taxi fleet operators and fleet size
TOL agreement
10 year license from 1 June 2003
License fee payable is based on 0.1% of revenue derived from taxi operations
Current QOS based on Taxi Availability, Safety, Customer Satisfaction
13Diverse Taxi Fleet
Chevrolet Epica Taxi Chrysler Taxi Mercedes-Benz Taxi
London Cab 7-Seater SPACE Taxi Paratransit Taxi
14
14Growing Rental & Advertising
Launch of Orchard
Launch of Launch of
$m Esplande
Xchange & Jurong
3 Xchanges East Xchange
Xchange
90.0
81.5
80.0 73.6
70.0 65.0
63.0
57.5 57.0
60.0
50.8
46.5
50.0
42.0
40.0
30.9
30.9
30.0 25.4
22.5 22.5
19.8
20.0 19.2
17.2
15.0 15.0
13.1
10.0
0.0
FY2008 FY2009 FY2010 FY2011 FY2012
Rental Revenue Rental EBIT Advertising Revenue Advertising EBIT
15Developing Commercial Opportunities
Raffles Xchange (1,300 sqm)
Raffles Xchange (2,600 sqm)
Total 9 Xchanges with
lettable space of over
14,000 sqm
Chua Chu Kang Xchange (100 sqm) Chua Chu Kang Xchange (1,000 sqm)
16New Rental Opportunities
Adding about 1,700 sqm by end FY2013
Bayfront Marina Bay Woodlands Xchange
Gardens by the Bay
Marina Bay Financial Centre
• Approximately 80 sqm • Approximately 300 sqm • Approximately 1,400 sqm
•Connects to several tourist • Connects to offices, retail space • 50 shop units
attractions: - and event grounds:
• Gardens by the Bay • Marina Bay Financial Centre • High passenger volume with
• Marina Bay City Gallery • Marina Bay Link Mall commuters travelling to/from
• Marina Bay Sands • The Promontory@ Marina Malaysia
Bay
1717Mobile Advertising
Wide network of trains & stations, buses & interchange & taxis
Increasing Ridership
Captive Audience with average 17.7 min exposure per journey
Trains
Concept Trains – Exterior,
Windows, Hangars, etc
Taxis Buses
18Advertising Solutions
Trackside Fare Gates
Stairways
Plasma Frame Benches
Platform Screens
Floor Stickers
Event Spaces
19Innovative Digital Platforms
iMobSMRT
Projection
Screen @
Orchard
iViewSMRT
iMobSMRT allows commuters with Near Field
Communication (NFC) tags or Quick Response (QR) Digital posters integrated with eyeball tracking technology to monitor your
codes to make transactions and exchange digital content audiences. The tracking software is integrated on iViewSMRT screens to capture
via their smartphones. the number of people looking at the ads.
20Engineering & International Business Operations & Maintenance (Consultancy, Training, Operator) Engineering (Consultancy & project management) Upgrading/Enhancement of SMRT’s assets
Current Projects
                                                                          China
                                                         1. 49% equity stake in Shenzhen Zona
                                                         2. Project Management for Dalian Metro

Dubai Metro Advertising                                                                                   Dalian Metro
                                          UAE
           1.Metro, Bus & Marine Fleet Advertising in Dubai
           2.Safety Operations Readiness Assessment Consultancy - Masdar City
             Personal Rapid Transit System
           3.Cost and operational review for Dubai RTA

                                                                  South Korea
                                                         Project Management Consultancy
                                                                                                       Singapore
                                                                for ShinBundang Line        Consultancy, Project Management
                                                                                            & Maintenance for Sentosa Express

                 Masdar PRT                                       India
                                                    Safety audit for Mumbai Monorail

                                                                                                       Sentosa Express

                                                             22
Engineering Solutions
Enhancing SMRT’s rail assets with in-house technology
Implemented in train stations; potential to offer solutions to overseas
operators
TITAN Automatic Fare Gates
Staris Travel and Information System
23Delivering Stable Financial Returns
Historical Financial Performance
  Revenue vs PAT ($m)

1200.1                                                                                                                                   20
                       18.7                                                        18.9
                                                     18.5                                                                                19
1000.1
                                                                                                                                         18
                                                                                                          16.6
                                                                                                                                         17
 800.1
                                                                                                                                         16
 600.1                                                                                                                                   15
                                                                                                                       1,057.2
                                                                                                       969.7                      13.4   14
                                                879.0                           895.1
 400.1            802.1
                                                                                                                                         13
                                                                                                                                         12
 200.1
                                                                                                                                         11
                          149.9                         162.7                           169.5*                 161.1         141.6*
   0.1                                                                                                                                   10
                       2008                         2009                           2010                   2011             2012

                                                         Group Revenue                  PAT      PAT Margin

         *Before Bus goodwill impairment of S$6.6 m (2010) and S$21.7m (2012)

                                                                                        25
Historical Financial Performance
930.6
Operating Expenses Trend ($m)
794.3
741.0
716.9
645.0
13.9% 16.6% 14.1% 15.4% 17.9%
0.9%
2.3%
19.0% 18.8% 20.3%
20.1%
20.2% Energy costs
9.8% 10.7% Impairment of goodwill
9.2% 9.8%
9.1%
16.4% Other operating expenses
15.4% 15.8% 15.0%
13.9% Repairs and maintenance costs
Depreciation of PPE*
Staff and related costs
40.9% 38.7% 39.8% 39.5% 36.5%
FY2008 FY2009 FY2010 FY2011 FY2012
*Depreciation of PPE net of amortization of asset related grant
26Historical Financial Performance
Fare Vs Non-Fare
Revenue(S$m) EBIT(S$m)
1200 250
1,057.2
969.5 204.9 195.7
1000 200
894.9 187.1
879.0 256.7 176.3
802.1 219.9 170.0*
800 743.3 205.8 77.5
188.2 143.0 61.6
160.7 150 45.9 84.3
140.4
600 34.9 90.7
100
400 749.6 800.5
641.4 690.7 689.1
602.9 130.4 125.5 127.4
200 50 108.1 111.4
79.0
0
0
2007 2008 2009 2010 2011 2012
2007 2008 2009 2010 2011 2012
Fare Non-fare
Fare Non-Fare
*Excludes Bus goodwill impairment of S$21.7m
27Sound Financial Position
Strong Cashflow From Operations S$’m
400.0
300.0
200.0
326.6 283.3 282.1
100.0 163.4
148.0
0.0
FY2008 FY2009 FY2010 FY2011 FY2012
Solid Balance Sheet Net Cash Gross Gearing DEBT/ EBIDTA
As at 31 March 2012 $$45.3m 19.0% 0.5X
S&P Rating: AAA
Capex FY13 Budget ~ Approx S$500m FY12: S$496.1m
28Maintaining Shareholder Value
cents
Dividend Policy
10.00 82%
80% 80%
Endeavour to maintain or increase dividend
9.50
79% payout each year in terms of cents per share,
80%
9.00 78% targeting a minimum payout ratio of 60% of
8.50 PATMI per year for the interim and final ordinary
78%
8.00 dividend.
7.50 76%
7.00 Policy takes into account our long term objective
8.50 8.50 74% of maximising shareholder value, the availability
6.50 7.75 7.75
7.45 of cash and retained earnings, our expected
6.00
72%
72% financial performance and projected capital
5.50 expenditure and other investment plans.
5.00 70%
FY2008 FY2009 FY2010 FY2011 FY2012
DPS (cents) Payout %
29Going Forward
Evolving Maintenance Regime to recognize
ageing & increased usage
Early Detection Systems
S$900m asset renewal plan to be spread
over 8 years, which will be co-shared with
LTA.
Main items will change-out of sleepers
along the ballasted tracks on the NSEWL
(approx $600m) and resignalling works Resleepering
Resignalling to overcome obsolescence
and improve headway from 120s to 100s;
fully bi-directional (Approx $200m)
31Government Initiatives
Spending S$60 billion to double rail network from 138km to 278km by 2020
Extensions to the North South and East West Lines
Three major lines will be added to the existing rail network in the coming years.
I. Downtown Line (estimated completion by 2017)
II. Thomson Line (estimated completion by 2018)
III. Eastern Region Line (estimated completion by 2020) Source: Singapore Budget 2012
S$1.1 billion Bus Services Enhancement Programme (BSEP)
Adding about 800 buses (or 20% increase) over next 5 years.
The Government will fund the purchase of 550 buses from 2012 till 2016. The fund also includes
the operating costs for 10 years.
The remaining 250 buses will be purchased by Public Bus Operators.
The significant increase in bus capacity is expected to reduce crowding and waiting times.
32Key Takeaways
Near Term Long Term
Operating cash flow remains strong New Land Transport Master Plan in 2013
Improving service reliability of Trains and New Rail opportunities open for bidding
Buses
Fare Formula Review
Growing Train & Bus ridership
New Rail Financing Framework
Growing Rental & Advertising income
Bus business sustainability needs to be
Pressure from rising staff cost and addressed
depreciation but volatility of energy cost
is capped through hedging Developing commercial opportunities
adjacent to train network & overseas
$900 million asset renewal plan over 8
years, mitigated through cost sharing
arrangement with LTA
33
33Factsheet
MARKET STATISTICS
Company SMRT Corporation Ltd
Listing Status SGX Main Board since 26 July 2000
Share price S$1.640 (30 August 2012)
Issued Shares 1,520,217,046
Market Capitalization S$2.5 billion
P/E ratio (trailing) 20.8 X
P/NAV 3.15 X
Dividend Yield 4.5% (FY2012 total dividend: 7.45cents)
Major Shareholders Temasek Holdings (Private) Limited – 54.23%, Capital Group – 3.37%
9. J.P. Morgan Securities Singapore Private
1. CIMB Research Pte Ltd
Limited
2. Citigroup Global Markets Singapore Pte Ltd
10. Kim Eng Research Pte Ltd
3. CLSA Singapore Pte Ltd
11. Macquarie Securities (Singapore) Pte Ltd
Analyst Coverage 4. Credit Suisse
12. Nomura Singapore Ltd
(16 Houses) 5. DBS Vickers Securities (Singapore) Pte Ltd
13. OCBC Investment Research Pte Ltd
6. Deutsche Securities Asia Limited
14. Phillips Securities Research Pte Ltd
7. DMG & Partners Research Pte Ltd
15. UBS Securities Pte Ltd
8. HSBC Global Research
16. UOB Kay Hian Research Pte Ltd
34Disclaimer
The statements or information in this presentation which are not of historical fact may constitute “forward looking
statements” relating to financial trends for future periods, compared to the results for previous periods, financial
forecasts, profit projections, or expected growth of SMRT. These statements if any are “forward looking
statements” and accordingly, are only predictions. These statements are based on management's current
views, expectations and assumptions including, but not limited to, prevailing or future economic and market
conditions.
These forward looking statements involve known and unknown risks, uncertainties and other factors that may
cause the actual results, performance or achievements or events to differ materially from those in the statements
as originally made. Such statements are not, and should not be construed as a representation as to future
performance of SMRT.
Therefore, we advise you not to place undue reliance on those statements. In particular, such targets should not be
regarded as a forecast or projection of future performance of SMRT. It should be noted that the actual performance
of SMRT may vary significantly from such targets. SMRT do not represent or warrant the actual future results,
performance or achievements of SMRT will be as discussed in those statements.
For enquiries from analysts/investors, please contact:
Roger Ng; Investor Relations
Tel: (65) 6331 1211 Fax: (65) 6334 1407
Email: ngroger@smrt.com.sg
Visit http://www.smrt.com.sg/investors/investors.asp for media releases, announcements and presentations
35You can also read