Predicting Important Features That Influence COVID-19 Infection Through Light Gradient Boosting Machine: Case of Toronto
←
→
Page content transcription
If your browser does not render page correctly, please read the page content below

American Journal of Mathematical and Computer Modelling
2021; 6(3): 43-49
http://www.sciencepublishinggroup.com/j/ajmcm
doi: 10.11648/j.ajmcm.20210603.11
ISSN: 2578-8272 (Print); ISSN: 2578-8280 (Online)

Predicting Important Features That Influence COVID-19
Infection Through Light Gradient Boosting Machine:
Case of Toronto
Yein Choi
Envirosuite Seoul Office, Seoul, South Korea

Email address:

To cite this article:
Yein Choi. Predicting Important Features That Influence COVID-19 Infection Through Light Gradient Boosting Machine: Case of Toronto.
American Journal of Mathematical and Computer Modelling. Vol. 6, No. 3, 2021, pp. 43-49. doi: 10.11648/j.ajmcm.20210603.11

Received: June 21, 2021; Accepted: July 2, 2021; Published: July 13, 2021

Abstract: COVID-19, a disease starting from December 2019, spreads from person to person through contact, and has
symptoms of cough, fever, muscle pain, etc. The diagnosis is usually done by polymerase chain reaction (PCR) test which
collects samples from the nasopharyngeal area. Today, machine learning or deep learning is used to analyze data such as
confirmed cases or mortality, differentiate x-ray images of COVID-19 patients and others. Not many of the researches
completed before predicted important features that influence COVID-19. Therefore, we mainly address the influence of related
features. Our data includes demographic, geographic, and severity information in Toronto. The experiment was developed in
this order: data import, label encoding, correlation matrix, train-test split, min-max normalization, machine learning models,
gridsearchcv, and feature importance. We applied a boosting algorithm and light gradient boosting machine to increase
accuracy and speed, gridsearchcv, feature importance function to find the importance of the variable and best hyper parameters
for models. Among two experiments, the first experiment using a feature-selected model concluded important features such as
outbreak associated, FSA, and classification with 88 percent accuracy. The second experiment that did not select features but
used entire features resulted in that neighborhood name, FSA, and age group as important features. The accuracy was mostly
around 89 percent. The data did not include personal information but mostly geographical information, which might have
influenced the result, determining geographical features as key features of infection, and the accuracy. Yet, the model for the
experiment has advanced computation speed, less memory usage, and showed impressive performance.
Keywords: COVID-19, Machine Learning, Random Forest, LGBM, Artificial Intelligence

                                                                     respiratory failure, lasting lung, kidney failure, heart muscle
1. Introduction                                                      damage, nervous system problems, or even death [1]. There
1.1. Background                                                      are three COVID19 test available for both current and past
                                                                     infection. Polymerase Chain Reaction (PCR) test and antigen
   Covid-19, first appeared in December 2019, is the disease         test are used for current infection, and antibody test is used to
caused by SARS-CoV-2 (Coronavirus). Coronavirus can be               detect previous infection. PCR test, the most widely used test,
spread from person to person through inhaling or having              is mostly done by Nasal pharyngeal swab since it is most
direct contact of the droplets containing the virus with the         sensitive and specific because nasal pharyngeal area has high
eyes, nose or mouth. Therefore, for prevention, physical             concentration of viruses. It can be also done inside the nose
distancing, wearing masks, keeping hygiene, staying at home          and throat or just by collecting saliva. However, these
if feeling sick is needed. The symptoms include cough, fever,        methods are less accurate. Antigen testing is also done in a
chills, shortness of breath, muscle or body aches, diarrhea,         nasal swab, in the nostril, and it is most effective in the early
nausea or vomiting, loss of taste or smell, and more. But it         stage of infection, when there are more viruses in the body.
differs by individual. Some have severe illness while others         Antibody tests use blood samples to detect the presence of
have no symptoms at all. Nonetheless, coronavirus can cause          antibodies, which is produced by the immune system to
44                          Yein Choi: Predicting Important Features That Influence COVID-19 Infection Through
                                             Light Gradient Boosting Machine: Case of Toronto

protect against the virus, after illness [2]. These days, to           website of five countries including Italy, Germany, Iran, USA,
detect Covid or to predict numbers such as confirmed cases             and China. As data were uncertain and insufficient, the
or death rates, machine learning or deep learning is used. For         standard epidemiological models could not perform well.
example, prediction models that uses several features such as          Therefore, they proposed various machine learning models
sex, age, known contact with infected people, initial                  and soft computing models for COVID-19 prediction. Multi-
symptoms, were developed to evaluate the risk of infection             layered perceptron (MLP) and adaptive network-based fuzzy
[3]. Furthermore, a machine learning-based classifier was              inference system (ANFIS) yielded promising performance
developed to differentiate the Chest-X ray images of Covid19           compared to the others [10].
patients from other diseases like pneumonia, since the                    Shahid et al. collected data of confirmed cases, death cases,
similarity challenges to distinguish between two [4]. In               and recovered cases of Covid19. The data got preprocessed,
Toronto, as of June 6th, 2021, there are a total 163,063 cases,        and were used as input data for the regression models such as
161,272 have recovered, and 3,407 have died from covid19               autoregressive integrated moving average (ARIMA), support
[5]. Moreover, 2,022,554 people received at least one dose of          vector regression (SVR), gated recurrent unit (GRU), long
vaccine, and 230,77 people have completed vaccination [6].             short term memory (LSTM), and Bidirectional LSTM.
Some might have doubts about variants and the effectiveness            Bidirectional LSTM showed the highest performance which
of vaccines. Just like other viruses, the virus that causes            was MAE and RMSE values of 0.007 and 0.0077,
COVID-19 has constantly changed and new variants                       respectively [8].
occurred. However, the mutation will not make the vaccine                 Solanki and Singh collected data of India from Johns
absolutely incompetent since the vaccines evoke a broad                Hopkins CSSE, Worldometers website, and Kaggle. The
immune respond including range of antibodies and cells [7].            models that have been applied to the data were:
                                                                       Autoregressive integrated Moving Average (ARIMA) model,
                                                                       the Holt-Winter model, the seasonal autoregressive integrated
                                                                       moving average (SARIMA) model, polynomial regression,
                                                                       and long short term memory (LTSM). The mean absolute
                                                                       percentage error value produced by the SARIMA model was
                                                                       0.236, while 0.249 was produced by the Holt-Winter model.
                                                                       In the prediction of the number of affected cases and death,
                                                                       accuracy of the model estimated by the polynomial
                                                                       regression model is 85%. Root mean square error is
                                                                       calculated by the LSTM model using adaptive moment
                                                                       estimation optimizer. The prediction error for training is 6.45,
                                                                       and the calculated overall error is 5.34 [11].
                                                                          Fátima Cobre et al. predicted positivity and severity of
           Figure 1. Cumulative count for the COVID-19 cases.          disease according to laboratory test results of patients who
                                                                       attended a single hospital. The four machine learning models
1.2. Objective                                                         used were Artificial neural networks (ANN), decision trees
                                                                       (DT), partial least squares discriminant analysis (PLS-DA),
   Prior research mainly focused on prediction of mortality,
                                                                       and K nearest neighbor algorithm (KNN) models. The
severity, diagnosis, and more. Less research was done on
                                                                       accuracy of ANN, DT, PLS-DA, and KNN models were
prediction of the important factors including environmental
                                                                       within 84%, and the accuracy of the classification of severe
and personal elements. For instance, age, gender, residence,
                                                                       and nonsevere patients were within 86%. Hyperferritinemia,
forward sortation area (FSA), and case history may be the
                                                                       hypocalcaemia, pulmonary hypoxia, hypoxemia, metabolic
important factors for Covid19 infection. Moreover, many
                                                                       and respiratory acidosis, low urinary pH, and high levels of
other research had limitations due to insufficient datas.
                                                                       lactate dehydrogenase were associated with the prediction
Considering the high level uncertainty and lack of vital data,
                                                                       [12].
the models developed in other studies showed low accuracy
                                                                          Pinter et al. used data from Hungary to predict the time
for prediction and weak generalization ability. Therefore, in
                                                                       series of infected individuals' mortality rate. Hybrid machine
this research, we primarily focused on the influences of
                                                                       learning methods such as adaptive network-based fuzzy
personal and surrounding features, and the high performance
                                                                       inference system (ANFIS) and multi-layered perceptron-
of models. Below, we are going to continue on with related
                                                                       imperialist competitive algorithm (MLP-ICA) are used in this
works, materials and methods - including description of
                                                                       research. Considerable drop of the total mortality and
datasets, algorithms, and models - results, discussion and
                                                                       outbreak was predicted by the model. The model accuracy is
conclusion.
                                                                       confirmed by performing validation for 9 days. Moreover,
                                                                       machine learning is proposed to be a capable technology to
2. Related Works                                                       model the outbreak. The study suggests further research to
                                                                       enhance the quality of prediction. MLP-ICA model showed
     Ardabili et al. collected the data from worldometers              the highest performance which was rmse 8.32 while ANFIS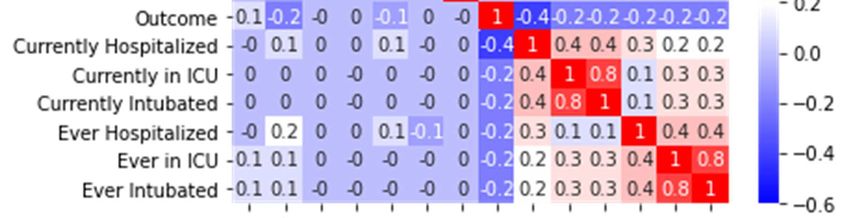
American Journal of Mathematical and Computer Modelling 2021; 6(3): 43-49 45
yielded 15.25, respectively [9]. was set as a target column for the classification. As the
“Outcome” column consists of three status which are
3. Materials and Methods resolved, fatal, active, multi label classification was
implemented for our research. “Forward sortation area” (FSA)
3.1. Data Description denotes the first three characters of postal code,
“Neighborhood Name Sort” is about the divided distinct
The dataset was acquired from the Kaggle, which is neighborhoods in Toronto and “Ever in ICU” means cases
available at Toronto COVID-19 Cases | Kaggle [13]. It that were accepted as an intensive care unit. Columns, which
involves demographic, geographic, and severity information are also known as features in the field of data science, were
of both confirmed and probable cases in Toronto. The dataset used for classifying the target
consists of 14911 rows and 17 columns. “Outcome” column
Figure 2. Data description of the given dataset.
3.2. Boosting Algorithm various research and data analysis competitions such as
Kaggle. However, in the era of big data, the basic boosting
Boosting algorithm belongs to an ensemble algorithm, machine faced the limitation on its performance compared to
which implements more than one decision tree model on the the deep learning algorithms. The representative drawback,
computation Ensemble algorithm can be divided into bagging which is information gain, has occurred with the rise of huge
and boosting methods. While the bagging proceeds with a datasets. It lowered the speed of the computation and had
parallel learning and majority vote for the final decision, the limitations on the memory usage. Light Gradient Boosting
boosting proceeds with a sequential learning. The boosting Machine (LGBM) has occurred to solve that downside.
algorithm could be divided into two methods. In the first LGBM suggested Gradient-based One-Side Sampling (GOSS)
method, the boosting model weighs the higher gradient on and Exclusive Feature Bounding (EFB) as solutions. For the
important data, and Adaptive Boosting is the representative case of normal boosting, the data with large gradient affects
one [14]. In the second method, the boosting algorithm puts more on the information gain. Therefore, GOSS allows the
the difference between incorrect one and correct one as an higher accuracy of information gain with a lower dataset by
input for the next classifier, which is similar to the loss excluding the data with low gradient. EFB allows LGBM to
function. Through this process the boosting algorithm can bundle mutual exclusive features in order to reduce the
increase its performance and XGboost and Light Gradient number of features and it allows efficient memory usage, and
Boosting ModelLGBM) belong to it [15, 16]. high performance speed. Furthermore, LGBM utilizes a
Leaf-wise method while the basic boosting algorithm
implements the Leve-wise method. The Leaf-wise method
has an advantage on accuracy but also involves a higher
probability of overfitting, which is the representative problem.
To the end, LGBM supports GPU training, which could yield
faster results compared to CPU training [17].
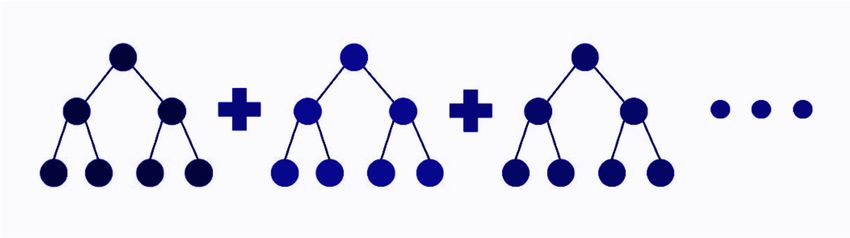
Figure 3. Overall architecture of boosting model.
3.4. GridSearchCV
3.3. Light Gradient Boosting Machine
In the machine learning research, researchers implemented
As the boosting algorithm has yielded high accuracy and various methods on the same dataset to achieve the highest
speed, many researchers implemented the algorithm in accuracy. For better performance, hyperparameter tuning plays a
46                        Yein Choi: Predicting Important Features That Influence COVID-19 Infection Through
                                           Light Gradient Boosting Machine: Case of Toronto

vital role in modeling. Hyper parameter denotes the parameter        Secondly, the tanh layer generates a , which updates the
whose values can be handled manually. As there is a broad range      cell state (7). Thirdly, a new vector is made through (8). In
of value on each parameter, handling them with non automatic         this process, by multiplying , the forget gates of LSTM
approach is inefficient. Therefore, an automatic algorithm for       decides whether to pass or forget the information through the
finding the appropriate hyperparameters is essential and             previous stage. Then, it adds           . Lastly, output gates
RandomizedSearchCv and GridSearchCV are the representative           determine the states based on the previous cell states through
models. Both algorithms can be implemented through the Scikit        (9). Through (10), the final output can be obtained through a
- learn’s model selection package. When we put the value of          discriminative passage of information [14].
predefined parameters, such as 0.1, 0.001, 0.0001 for the
learning rate, the GridSearchCV calculates every predefined          3.6. Pipeline of Proposed Model
parameter and calculates the output through the cross validation        First, the data was imported and uploaded by the read csv
process. The main difference between GridSearchCV and                function from pandas. Then, by label encoding, string data
RandomizedSearchCV is that while the GridSearchCV                    such as no or yes were converted into integers. Next, the
calculates every hyper parameter, the RandomizedSearchCV             correlation of the data was found for the feature selection.
calculates randomly on predefined parameters [18].                   The train test split function was used for splitting the train
3.5. LSTM                                                            and test size and, test size and train size were 30% and 70%
                                                                     per each. After MinMax normalization, which is done to
   Long short term memory (LSTM) is one of recurrent                 adjust the range of the data, the data were put into machine
neural networks (RNN). General deep neural network (DNN)             learning models. Using GridSearchCV, which examines the
fundamentally has a one-way network. This means that the             number of cases for all combinations of hyper parameters,
input data passes through the nodes of the neural network            the model of the best fit, LGBM in this case, was searched.
only once. However, RNN has a different architecture. The            Lastly, applying this, we could get the important features of
output from the nodes in RNN becomes an input for the same           the infection and visualize the result.
nodes. RNN models have a shortcoming of exploding and
vanishing gradient problems. LSTM solves those problems
by including a ‘memory cell’ which can conserve information          4. Results
for long periods of time. LSTM consists of an input gate, an         4.1. Confusion Matrix in Machine Learning
output gate, and “forget” gate.
                                                                                   Table 1. Evaluation matrix in machine learning.

                                                                                            Predicted: NO             Predicted: YES
                                                                     Actual: NO             FN                        TP
                                                                     Actual: YES            TN                        FP

                                                                     TP, TN, FN, FP are defined as follows:

                                                                        1) True Positives (TP): Data where the true label is
                                                                           positive and which are correctly predicted to be positive
                                                                        2) False Positives (FP): Data where the true label is
                                                                           negative and which are correctly predicted to be
                                                                           positive
                                                                        3) True Negatives (TN): Data where the true label is
                                                                           negative and which are correctly predicted to be
                                                                           negative
                                                                        4) False Negatives (FN): Data where the true label is
                                                                           positive and which are correctly predicted to be
                                                                           negative Accuracy: Number of data correctly identified
                                                                           as either truly positive or truly negative out of the total
                                                                           number of items
                                                                     4.2. Feature Selected Model

                                                                        Correlation heat map showed all the correlations of the
                                                                     data from -1 to 1, and the features with high positive
                                                                     correlation with outcome were selected for the first
            Figure 4. Pipeline of our proposed experiment.           experiment. Selected features were ‘outbreak associated’,
                                                                     ‘FSA’, ‘classification’ with correlation of 0.105228, 0.003702,
  First of all, the cell state receives input data and then
                                                                     and 0.029368. The data of selected features were embedded
passes it through the sigmoid layer to decide whether to
                                                                     into the machine learning models, and the accuracy were
update the information or forget it through (5) and (6).
American Journal of Mathematical and Computer Modelling 2021; 6(3): 43-49 47
88.4 for logistic regression, 88.26 for decision tree classifier,
88.3 for random forest classifier, 88.44 for gradient boosting
classifier, 88.4 for XGB classifier, and 88.51 for LGBM
classifier.
Figure 7. Range of hyper parameters in LGBM.
Figure 5. Correlation results of the given dataset.
Figure 8. Range of hyper parameters in Random Forest.
Figure 6. Accuracy comparison among proposed models; features selected
by correlation.
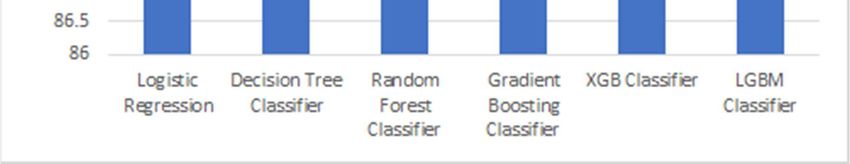
4.3. Feature Unselected Model Figure 9. Accuracy comparison among proposed models.
For the second experiment which we used all of the
features instead of selecting, the accuracy were 89.4, 87.49,
89.07, 89.87, 89.75, 89.91 for logistic regression, decision
tree classifier, random forest classifier, gradient boosting
classifier, XGB classifier, and LGBM classifier respectively.
According to the models, the most important features were
Neighborhood name, FSA and age group following next.
From the results, we could conclude that geographical
features play a large role for the COVID-19 infection. For the
GridSearchCV done on the LGBM classifier, the best
parameters across all searched params were 0.025 for the
learning rate, 2 for depth, and 30 for iteration. The accuracy
turned out to be 0.902. The best parameters for the Figure 10. Visualization of important features.
GridSearchCV done on the random forest classifier were 10
for max dept.h, 8 for both min samples leaf and min samples 5. Discussion
split, and 100 for estimators.
5.1. Limitation
In the research, the accuracy for machine learning models
48                       Yein Choi: Predicting Important Features That Influence COVID-19 Infection Through
                                          Light Gradient Boosting Machine: Case of Toronto

were in a range of 87 to 90. The outcomes were all similar,          However, the model itself had outstanding performance; it uses
making it hard to figure out the most effective model. One           less memory and has higher computation speed.
probability for this result is the data we used was incomplete. It
might have some missing parts in the data. Moreover, the
features of the data we used were a little biased on
geographical information. The data did not include much
                                                                     References
information about personal characteristics. Therefore, the           [1]   Sauer, L. M. (n.d.). What Is Coronavirus? Johns Hopkins
result mainly focused on geographical features. Furthermore,               Medicine.
the data did not reflect increasing vaccine dissemination or               https://www.hopkinsmedicine.org/health/conditions-and-
                                                                           diseases/coronavirus.
vaccination rate today. Also, COVID-19 is more fatal to
people who originally had underlying diseases such as cancer,        [2]   Which COVID test is best? Pros and cons of coronavirus
chronic kidney disease, COPD, asthma, cystic fibrosis,                     detection methods: COVID: UT Southwestern Medical Center.
epileptic lung disease, diabetes, immunodeficiency disease, etc            COVID | UT Southwestern Medical Center. (n.d.).
                                                                           https://utswmed.org/medblog/covid19-testing-methods/.
[19]. However, our data did not cover personal medical
histories. When selecting features, besides correlation, there       [3]   Zoabi, Y., Deri-Rozov, S., & Shomron, N. (2021). Machine
are other methods like PCA, forward selection, and backward                learning-based prediction of COVID-19 diagnosis based on
selection, but it was not used in this research.                           symptoms.        Npj     Digital    Medicine,  4     (1).
                                                                           https://doi.org/10.1038/s41746-020-00372-6.
5.2. Principal Finding                                               [4]   Zargari Khuzani, A., Heidari, M., & Shariati, S. A. (2021).
                                                                           COVID-Classifier: an automated machine learning model to
   Even though we lessened the number of features based on                 assist in the diagnosis of COVID-19 infection in chest X-ray
correlation, the performance of our models were outstanding.               images.          Scientific     Reports,       11        (1).
When comparing feature selected models and the model that                  https://doi.org/10.1038/s41598-021-88807-2.
applied every feature of data, our models have less memory
                                                                     [5]   City of Toronto. (2021, June 2). COVID-19: Case Counts.
usage and high computation speed since it has a smaller                    City of Toronto. https://www.toronto.ca/home/covid-19/covid-
number of features. In the case of deep learning, it has great             19-latest-city-of-toronto-news/covid-19-pandemic-data/covid-
performance, but the importance of the variable is unknown                 19-weekday-status-of-cases-data/.
due to the characteristic of black box [20]. Though, we have
                                                                     [6]   City of Toronto. (2021, June 2). COVID 19: Vaccine Data.
identified the variable importance by using LGBM and                       City of Toronto. https://www.toronto.ca/home/covid-19/covid-
GridSearchCV, and it also has high accuracy. Moreover, it                  19-latest-city-of-toronto-news/covid-19-pandemic-data/covid-
does not need a high specification CPU or GPU. For medical                 19-vaccine-data/.
related data, like the one in this research, it is vital to
                                                                     [7]   World Health Organization. (n.d.). The effects of virus variants
determine the features or variables that have a big influence              on COVID-19 vaccines. World Health Organization.
on the outcome. In order to prevent the spread of COVID-19,                https://www.who.int/news-room/feature-stories/detail/the-
ascertaining the main features that affect the propagation of              effects-of-virus-variants-on-covid-19-vaccines.
the virus is a must.
                                                                     [8]   [Shahid, F., Zameer, A., & Muneeb, M. (2020). Predictions for
                                                                           COVID-19 with deep learning models of LSTM, GRU and
6. Conclusion and Recommendation                                           Bi-LSTM. Chaos, Solitons & Fractals, 140, 110212.
                                                                           https://doi.org/10.1016/j.chaos.2020.110212.
   Throughout the research, data of COVID-19 cases in
                                                                     [9]   Pinter, G., Felde, I., Mosavi, A., Ghamisi, P., & Gloaguen, R.
Toronto, which includes demographic, geographic, severity                  (2020). COVID-19 Pandemic Prediction for Hungary; A
information, was used. The experiment was done in order of                 Hybrid Machine Learning Approach. Mathematics, 8 (6), 890.
importing and uploading data, encoding labels, finding                     https://doi.org/10.3390/math8060890.
correlation, doing train test split and min max normalization,
                                                                     [10] Ardabili, S. F., Mosavi, A., Ghamisi, P., Ferdinand, F.,
putting into machine learning models, using GridSearchCV,                 Varkonyi-Koczy, A. R., Reuter, U., Rabczuk, T., & Atkinson, P.
and visualizing important features. The experiment was                    M. (2020). COVID-19 Outbreak Prediction with Machine
completed twice, one selected features based on the correlation           Learning.         Algorithms,      13       (10),       249.
of the data, and the other used all of the features. For the first        https://doi.org/10.3390/a13100249.
experiment, the accuracy of the machine learning models were         [11] Solanki, A., & Singh, T. (2021). COVID-19 Epidemic
all around 88, and for the second experiment it was around 87             Analysis and Prediction Using Machine Learning Algorithms.
to 90. The most important features according to the model are             Studies in Systems, Decision and Control, 57–78.
neighborhood name, FSA, and age group. From this, we can                  https://doi.org/10.1007/978-3-030-60039-6_3.
conclude that geographical features have high influence on           [12] Cobre, A. de, Stremel, D. P., Noleto, G. R., Fachi, M. M.,
COVID-19 infection. Nevertheless, the accuracy of entire                  Surek, M., Wiens, A., Tonin, F. S., & Pontarolo, R. (2021).
models were concentrated on the range of 87 to 90, and we                 Diagnosis and prediction of COVID-19 severity: can
suspect limitations in data. The data mainly focused on                   biochemical tests and machine learning be used as prognostic
geographical features, and may not have included other                    indicators? Computers in Biology and Medicine, 134, 104531.
                                                                          https://doi.org/10.1016/j.compbiomed.2021.104531.
personal features such as characteristic and medical history.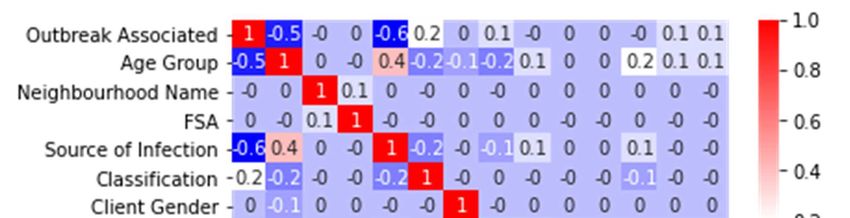
American Journal of Mathematical and Computer Modelling 2021; 6(3): 43-49                               49

[13] Agrawal, D. (2020, July 17). Toronto COVID-19 Cases.                  boosting decision tree. Advances in neural information
     Kaggle. https://www.kaggle.com/divyansh22/toronto-covid19-            processing systems, 30, 3146-3154.
     cases.
                                                                      [18] Syarif, I., Prugel-Bennett, A., & Wills, G. (2016). SVM
[14] AdaBoost. (2009). Encyclopedia of Biometrics,            9–9.         parameter optimization using grid search and genetic
     https://doi.org/10.1007/978-0-387-73003-5_825.                        algorithm to improve classification performance. Telkomnika,
                                                                           14 (4), 1502.
[15] Chen, T., & Guestrin, C. (2016, August). Xgboost: A scalable
     tree boosting system. In Proceedings of the 22nd acm sigkdd      [19] Centers for Disease Control and Prevention. (n.d.). Certain
     international conference on knowledge discovery and data              Medical Conditions and Risk for Severe COVID-19 Illness.
     mining (pp. 785-794).                                                 Centers     for   Disease    Control     and     Prevention.
                                                                           https://www.cdc.gov/coronavirus/2019-ncov/need-extra-
[16] Abou Omar, K. B. (2018). XGBoost and LGBM for Porto                   precautions/people-with-medical-conditions.html.
     Seguro’s Kaggle challenge: A comparison. Preprint Semester
     Project.                                                         [20] London, A. J. (2019). Artificial Intelligence and Black-Box
                                                                           Medical Decisions: Accuracy versus Explainability. Hastings
[17] Ke, G., Meng, Q., Finley, T., Wang, T., Chen, W., Ma, W.,... &        Center Report, 49 (1), 15–21. https://doi.org/10.1002/hast.973.
     Liu, T. Y. (2017). Lightgbm: A highly efficient gradient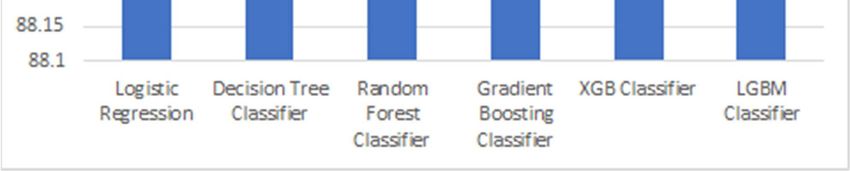
You can also read