Predict long-range enhancer regulation based on protein-protein interactions between transcription factors
←
→
Page content transcription
If your browser does not render page correctly, please read the page content below
Published online 27 September 2021                                                     Nucleic Acids Research, 2021, Vol. 49, No. 18 10347–10368
                                                                                                                https://doi.org/10.1093/nar/gkab841

Predict long-range enhancer regulation based on
protein–protein interactions between transcription
factors
Hao Wang† , Binbin Huang† and Jianrong Wang                                                *

Department of Computational Mathematics, Science and Engineering, Michigan State University, 428 S. Shaw Ln.,
East Lansing, MI 48824, USA

                                                                                                                                                              Downloaded from https://academic.oup.com/nar/article/49/18/10347/6376026 by guest on 28 November 2021
Received January 20, 2021; Revised August 10, 2021; Editorial Decision September 07, 2021; Accepted September 10, 2021

ABSTRACT                                                                                 INTRODUCTION
Long-range regulation by distal enhancers plays crit-                                    Cell-type specific transcriptional regulation plays impor-
ical roles in cell-type specific transcriptional pro-                                    tant roles in differentiation and development (1–13). In
grams. Computational predictions of genome-wide                                          addition to proximal regulatory elements, e.g. promoters,
enhancer–promoter interactions are still challenging                                     which are located around transcriptional start sites (TSS)
due to limited accuracy and the lack of knowledge on                                     of genes, distal enhancers provide complex and precise
                                                                                         controls on gene expression through long-range regulation
the molecular mechanisms. Based on recent biolog-
                                                                                         (14,15). Based on recent genome-wide enhancer annota-
ical investigations, the protein–protein interactions                                    tions from ENCODE and Roadmap Epigenomics projects
(PPIs) between transcription factors (TFs) have been                                     (16,17), hundreds of thousands of putative enhancers across
found to participate in the regulation of chromatin                                      the whole human genome have been identified, especially
loops. Therefore, we developed a novel predictive                                        in non-coding regions, highlighting the biological impacts
model for cell-type specific enhancer–promoter inter-                                    of enhancer regulation. Although a series of computational
actions by leveraging the information of TF PPI signa-                                   algorithms have been developed to predict the genomic lo-
tures. Evaluated by a series of rigorous performance                                     cations of cell-type specific enhancers (18,19), it remains
comparisons, the new model achieves superior per-                                        challenging to identify the specific target genes regulated
formance over other methods. The model also iden-                                        by enhancers in different cell-types or tissues. Unlike pro-
                                                                                         moters, enhancers are usually located far away from their
tifies specific TF PPIs that may mediate long-range
                                                                                         target genes along the genome (20) and the nearest genes
regulatory interactions, revealing new mechanistic                                       may not be regulated by a proximal enhancer (21). In three-
understandings of enhancer regulation. The priori-                                       dimensional (3D) space, an enhancer and its target genes are
tized TF PPIs are associated with genes in distinct                                      placed close to each other through long-range chromatin in-
biological pathways, and the predicted enhancer–                                         teractions, i.e. enhancer–promoter interactions (22).
promoter interactions are strongly enriched with                                            The discoveries of tissue-specific long-range enhancer
cis-eQTLs. Most interestingly, the model discovers                                       regulation have the potential to enable novel insights in a
enhancer-mediated trans-regulatory links between                                         wide range of different biological studies. As one of the
TFs and genes, which are significantly enriched                                          canonical examples, long-range regulation by distal en-
with trans-eQTLs. The new predictive model, along                                        hancers play pivotal roles in controlling the tissue and
with the genome-wide analyses, provides a plat-                                          condition-specific expression of the mouse β-globin (Hbb)
                                                                                         gene expression (1,5,6). As another well-known example,
form to systematically delineate the complex inter-
                                                                                         the expression of the Shh gene in mouse limb bud is pre-
play among TFs, enhancers and genes in long-range                                        cisely regulated by a distal enhancer located 850 kb away,
regulation. The novel predictions also lead to mecha-                                    which is critical for the proper limb development (7–9,23).
nistic interpretations of eQTLs to decode the genetic                                    In addition to normal tissue development, the annotation
associations with gene expression.                                                       of long-range enhancer regulation has also facilitated the
                                                                                         interpretation of genetic variants underlying complex dis-
                                                                                         eases. A non-coding genetic variant associated with obe-
                                                                                         sity is located in an intron of the FTO gene but regulates

* To   whom correspondence should be addressed. Tel: +1 517 432 0370; Email: wangj164@msu.edu
†
    The authors wish it to be known that, in their opinion, the first two authors should be regarded as Joint First Authors.


C The Author(s) 2021. Published by Oxford University Press on behalf of Nucleic Acids Research.
This is an Open Access article distributed under the terms of the Creative Commons Attribution License (http://creativecommons.org/licenses/by/4.0/), which
permits unrestricted reuse, distribution, and reproduction in any medium, provided the original work is properly cited.
10348 Nucleic Acids Research, 2021, Vol. 49, No. 18

the IRX3 and IRX5 genes that are located >400 kb away               mental techniques are used as labels for enhancer–promoter
(2,10,24). Similar examples of long-range interactions link-        pairs. The commonly used features include: (i) cell-type
ing disease-associated genetic variants to distal genes have        specific gene expression based on RNA-seq data; (ii) en-
also been found in studies of autoimmune diseases (3,4,11–          hancer activity based on specific epigenetic signals, such
13).                                                                as H3K4me1, H3K27ac or DNase hypersensitivity; (iii) ge-
   Given the functional importance of long-range enhancer           nomic separation distance between enhancers and gene pro-
regulation, experimental techniques have been developed to          moters and (iv) correlations between gene expression and
identify chromatin interactions linking distal enhancers to         enhancer activity. Supervised methods incorporating some
promoters of their target genes. Based on the pioneering            or all of these features include RIPPLE (41), FOCS (42),
chromosome conformation capture (3C) technology (25),               EAGLE (43) and JEME (44). As one of the most recently
along with its derivatives of 4C and 5C (26,27), the genome-        developed supervised methods, JEME (44) employs a com-
wide version, i.e. Hi-C (28), has been applied to several           bined approach of regression and random forest to predict
human cell-types and tissues (16,29,30). Furthermore, the           long-range regulatory links between enhancers and genes.

                                                                                                                                     Downloaded from https://academic.oup.com/nar/article/49/18/10347/6376026 by guest on 28 November 2021
promoter-enriched genome conformation assay, Capture                But it requires multi-omics datasets from a large panel of
Hi-C (31), improves the resolution and cell-type specificity        diverse cell-types and tissues as inputs, which is usually not
of the identified chromatin interactions for gene promot-           available for users. The other two top-performing meth-
ers (32). On the other hand, the method of chromatin in-            ods are IM-PET (45) and TargetFinder (46). These two al-
teraction analysis with paired-end-tag sequencing (ChIA-            gorithms not only integrate the features described above
PET) (33) was developed to capture long-range chromatin             but also leverage additional features of transcription fac-
interactions associated with a protein of interest, such as         tor binding in promoters, enhancers, or genomic windows
a specific transcription factor (TF), with high-resolution          between enhancers and promoters. With respect to ma-
and cell-type specificity (34). These cutting-edge technolo-        chine learning techniques, IM-PET employs a random for-
gies have generated large-scale chromatin contact maps for          est model, and TargetFinder implements a boosting tree ap-
a number of cell-types or tissues in the human genome and           proach. For the second class, i.e. unsupervised algorithms,
other model species (16,29,30,34).                                  every enhancer–promoter pair is assigned with a score and
   Although experimental techniques have substantially ex-          then ranked based on the scores. Top-ranking enhancer–
panded the catalog of annotations for long-range chromatin          promoter pairs are predicted to interact with each other.
interactions, there are several limitations that hinder in-         The scores are generally based on genomic separation dis-
depth analysis on cell-type specific enhancer–promoter in-          tance and co-activity patterns, e.g. correlations, between en-
teractions. First, the resolution of interacting genomic an-        hancers and genes (47–49). Based on a systematic perfor-
chors profiled by Hi-C and Capture Hi-C is relatively low           mance evaluation analysis (50), supervised methods overall
(∼5–10 kb genomic fragments) (29,31), which makes it dif-           demonstrate better performance than unsupervised meth-
ficult to pinpoint the specific enhancers involved in long-         ods, but many of the supervised methods suffer from over-
range regulation. Second, while Capture Hi-C and ChIA-              fitting issues due to high model complexity (50) or exces-
PET experiments can discover cell-type or tissue-specific en-       sively high-dimensional features that are often shared across
hancer regulation, data generated by Hi-C experiments have          training and testing sets (51). Furthermore, existing meth-
been found to be largely invariant across different cell-types      ods provide limited mechanistic insights on how specific
or tissues (35). Third, the background noise levels of Hi-C         long-range chromatin interactions are established to link
and Capture Hi-C datasets are high, leading to many false           distal enhancers with promoters of target genes (52).
positive discoveries (36). Fourth, due to the dependency on            Interestingly, as shown by recent experimental studies
specific protein antibodies, such as CTCF or RNA Pol II             (2,53–58), in addition to the binding of individual TFs
(34), each ChIA-PET experiment can only profile a sub-              on enhancers or promoters, the protein–protein interac-
set of long-range interactions, resulting in large numbers of       tions (PPIs) between TFs have been found to participate
false negative interactions that are not identified (37).           in the process of long-range chromatin interaction for-
   Because of these limitations, computational models are           mation and thus, mediate distal enhancer to the proxim-
needed to predict cell-type specific long-range enhancer reg-       ity of target gene promoters (Figure 1A–D). For exam-
ulation, based on integration of multi-omics signatures, e.g.       ple, the PPI between the enhancer-binding and promoter-
genomics, transcriptomics, and epigenomics. Large-scale             binding YY1s (i.e. YY1 dimerization) has been found to
multi-omics data resources collected by the ENCODE and              mediate enhancer–promoter contacts (59). The ChIA-PET
Roadmap Epigenomics projects contain the multi-view in-             data from mESCs suggests that the YY1–YY1 interactions
formation of gene regulation (16), including gene expres-           largely participate in the connections between active en-
sion, transcription factor binding and histone modifica-            hancers and gene promoters (59). In a chromatin struc-
tions. They can help to overcome the limitations of experi-         ture engineering study, based on a CRISPR-dCas9 sys-
mental techniques because they are cell-type or tissue spe-         tem, two proteins (PYL1 and ABL1) are fused to dCas9
cific (38), provide high-resolution signal landscape along          and are guided to bind on different genomic locations (60).
the genome (39,40), have high signal-to-noise ratio (40),           Remarkably, the PYL1–ABL1 dimerization can establish
and cover the genomic binding sites for diverse transcrip-          novel long-range chromatin interactions, highlighting the
tion factors (16). The existing computational models of             mechanistic importance of PPIs in orchestrating chromatin
long-range enhancer–promoter interaction prediction can             loops. In addition, a couple of genome-wide analyses have
be grouped into two classes. For the first class, i.e. supervised   also found that specific groups of transcription factors are
algorithms, 3D chromatin interactions profiled by experi-           enriched in cell-type specific long-range chromatin interac-
Nucleic Acids Research, 2021, Vol. 49, No. 18 10349

                                                                                                                                                                Downloaded from https://academic.oup.com/nar/article/49/18/10347/6376026 by guest on 28 November 2021

Figure 1. ProTECT infers long-range enhancer–promoter interactions based on TF PPI features. (A) The enhancer–promoter interactions are regulated by
PPIs between enhancer-binding TFs (brown) and promoter-binding TFs (blue), which link distal enhancers (orange) to the proximity of promoters (red)
in 3D chromatin structure. (B) Enrichment of TF–TF pairs in Hi-C interactions (y-axis) compared to background (x-axis). Points represent TF–TF pairs.
Frequency is calculated as the fraction of enhancer-gene pairs containing the specific TF–TF pairs. Fold-change (FC) is the ratio of the frequency in Hi-C
interactions over the frequency in background. TF–TF pairs are colored by the FC (red: FC > 2; orange: 1 < FC < 2; blue: FC < 1). (C) Enriched TF–TF
pairs are supported by PPIs. The fraction of pairs supported by PPIs are calculated for the set of enriched TF–TF pairs (red). As controls, the TF members
from the enriched TF–TF pairs are randomly paired (brown). Statistical test is done based on 1000 random repeats of controls (***P-value = 10–3 ). Error
bar represents sd. (D) Examples of Hi-C interactions linking enhancers (orange) and promoters (red) showing enhancer-binding CTCF ChIP-seq peaks
and promoter-binding RUNX3 ChIP-seq peaks in GM12878 cells. (E) The workflow of ProTECT algorithm. A balanced training dataset is generated with
confounding factors controlled. A feature matrix summarizing cell-type specific TF PPI features, activity-based features (enhancer activity, gene expression,
enhancer-gene activity correlation), and genomic distances is then constructed. A novel hierarchical network community detection-based approach is
applied for feature dimension reduction. Based on the reduced feature matrix, a random forest model is trained, and rigorous genomic-bin split cross-
validations are used for performance evaluations and comparisons. Using the trained predictive model, genome-wide high-confidence enhancer–promoter
interactions are predicted based on stringent permutation statistical tests.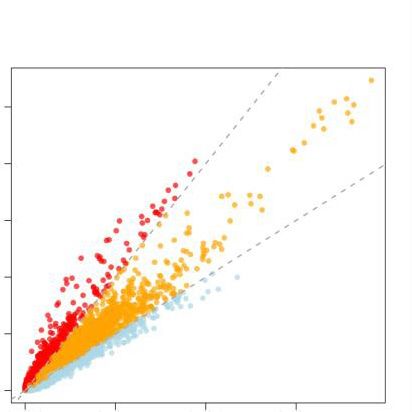
10350 Nucleic Acids Research, 2021, Vol. 49, No. 18

tions (61–63). Within each group, some TF members can            teractions, which are significantly enriched with cis-eQTLs.
interact with each other and form protein complexes. As a        In addition, by analyzing enhancer–promoter interactions
representative example, a group of CTCF, RAD21, SMC3             mediated by different TF PPIs, we were able to assign spe-
and ZNF143 is found to be enriched in chromatin inter-           cific TFs as upstream trans-factors to downstream target
actions (61), consistent with the chromatin loop extrusion       genes through distal enhancers. Strikingly, the prioritized
model that CTCF and cohesin can interact with each other         TF–gene pairs are significantly supported by trans-eQTLs,
and regulate chromatin loops (64,65).                            leading to new mechanistic interpretations of trans-genetic
   These observations strongly support the mechanistic hy-       effects propagated through the combined regulatory path-
pothesis that specific TF PPIs, except intratypic dimeriza-      ways of TF bindings, TF PPIs and long-range chromatin
tions where TFs can only co-bind locally to DNA instead          interactions.
of across long-range distances, may mediate long-range en-
hancer regulation. Therefore, incorporation of TF PPIs as        MATERIALS AND METHODS
a new set of features into a machine learning model is ex-

                                                                                                                                 Downloaded from https://academic.oup.com/nar/article/49/18/10347/6376026 by guest on 28 November 2021
                                                                 To predict cell-type specific long-range enhancer–promoter
pected to improve the accuracy of long-range enhancer–
                                                                 interactions and obtain understandings of the under-
promoter interaction predictions. Moreover, the prioritized
                                                                 lying mechanisms, we have developed a new algorithm
TF PPIs from the predictive model can further indicate the
                                                                 ProTECT (i.e. PROtein-protein interactions of Tran-
important transcription factors that facilitate long-range
                                                                 scription factors predicting Enhancer Contacts with
enhancer regulation, leading to novel understandings of en-
                                                                 Target genes). In addition to cell-type specific multi-
hancer biology. However, unlike basic enrichment analy-
                                                                 omics data, ProTECT (https://github.com/wangjr03/PPI-
sis of candidate TF–TF pairs that are over-represented in
                                                                 based prediction enh gene links) further integrates the
enhancer–promoter interactions (61–63), building a predic-
                                                                 information of PPIs between transcription factors as
tive model based on TF PPI features is computationally
                                                                 new features, because TF PPIs have been found to be
challenging. First, the number of candidate TF PPIs is large
                                                                 functionally associated with the regulation of chromatin
(∼200 000). By filtering the features using cell-type specific
                                                                 loops (1–5,10,12,13,23). The major steps of ProTECT are
TF expression, there are still large amounts of potential TF
                                                                 summarized in Figure 1E. By creating balanced training
PPI features. Take the human GM12878 cell-line as an ex-
                                                                 sets with confounding factors systematically controlled,
ample, by only considering TFs that are expressed (17), the
                                                                 ProTECT is trained on cell-type specific chromatin in-
number of PPIs between expressed TFs is ∼1900. The ex-
                                                                 teractions linking distal enhancers and gene promoters.
cessively high-dimensional TF PPI features easily render
                                                                 The high-dimensional TF PPI features are hierarchically
predictive models with high overfitting risks. Second, in-
                                                                 grouped into feature modules based on a novel graph-
dividual TF PPIs are not independent features because of
                                                                 based dimension reduction approach. This approach can
(i) co-binding TF modules along the 1D genome (16)) and
                                                                 simultaneously control the overfitting risk and also reveal
(ii) protein complexes consisting of multiple interacting TFs
                                                                 the cooperative complexes of TF interactions. Our model
(66,67). Both challenges require advanced feature dimen-
                                                                 demonstrated substantially improved accuracy based on
sion reduction approaches to efficiently handle the non-
                                                                 a series of rigorous performance evaluations. Along with
linear dependencies in features. In addition, as highlighted
                                                                 genome-wide enhancer–promoter interaction predictions,
by recent benchmark studies (50,51), rigorous settings of
                                                                 ProTECT also identifies the key TF PPIs involved in
cross-validation need to be designed for unbiased perfor-
                                                                 chromatin interaction mediation and prioritizes specific
mance evaluation and interpretation.
                                                                 gene sets whose expressions are regulated by distinct TF
   In this study, we developed a new predictive model, Pro-
                                                                 PPIs.
TECT, to infer long-range enhancer–promoter interactions
with substantially improved accuracy. A unique novelty of
                                                                 Chromatin contact maps and multi-omics datasets
the model is designing a graph-based dimension reduction
algorithm, which can efficiently incorporate combinatorial       ProTECT can take different types of chromatin contact
TF PPI features into the model and, in the meantime, con-        maps as input data (Figure 1E), such as Hi-C (29), Cap-
trol the overfitting risks. By setting rigorous genomic bin-     ture Hi-C (30) and ChIA-PET (33). In this study, we used
split cross-validations and controlling various confounding      the significant high-resolution Hi-C interactions from hu-
factors, we systematically demonstrated the superior perfor-     man GM12878 and K562 (GEO: GSE63525) (29) to train
mance of our model compared to existing algorithms. Fur-         models for the two cell-lines separately. Enhancer-promoter
thermore, we analyzed the relative importance of TF PPI          pairs are labeled as positive samples if overlapping with Hi-
features in different cell-types and prioritized the key TF      C interactions, or are labeled as negative samples otherwise.
PPIs that may participate in the regulation of long-range          Enhancer coordinates are based on Roadmap and EN-
enhancer–promoter interactions, leading to new mechanis-         CODE enhancer annotations (16,17). Cell-type specific
tic insights on enhancer regulation. Accordingly, we fur-        enhancer activities in GM12878 and K562 cell-lines are
ther classified genes into specific subsets, where enhancer-     quantified using the cell-type specific DNase-seq signals
gene interactions are predicted to be mediated by differ-        (17). Other enhancer-associated histone marks, such as
ent TF PPIs. Interestingly, genes in different subsets are en-   H3K27ac or H3K4me1 ChIP-seq data, can also be used
riched with distinct biological pathways, suggesting the spe-    to represent enhancer activities and have been found to
cific functional impacts of TF PPIs. Genome-wide imple-          produce similar predictions in our testing (see Results).
mentation of ProTECT in human GM12878 and K562 cell-             Promoters of genes are defined as ±1 kb around tran-
lines results in 134 792 long-range enhancer–promoter in-        scriptional start sites (TSS), based on gene annotations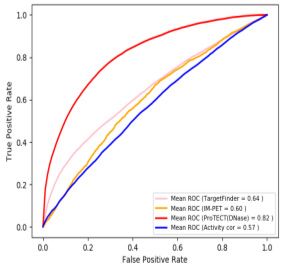
Nucleic Acids Research, 2021, Vol. 49, No. 18 10351

from GENCODE v17 (68). Cell-type specific gene expres-            enhancer–promoter pairs that do not overlap with Hi-C
sions are measured by RPKM values of RNA-seq dataset              interactions. In addition, as pointed out by recent bench-
from Roadmap Epigenomics project (17). Correlation coef-          mark studies (50), predictions of enhancer–promoter in-
ficients are calculated for enhancer-gene pairs across diverse    teractions can be substantially biased due to uncontrolled
cell-types (16,17) based on the same set of RNA-seq data for      confounding factors. Thus, in the process of generating the
genes and DNase-seq data for enhancers.                           balanced random set of negative samples, we strictly con-
   The ChIP-seq datasets of transcription factor (TF) bind-       trol three key confounding factors that have been found
ings in GM12878 and K562 are collected from ENCODE                to influence the model (Figure 1E): (i) the negative sam-
separately (16). For each TF, if multiple datasets exist, one     ples of enhancer–promoter pairs should be intra-TAD pairs
ChIP-seq dataset is selected based on data quality eval-          (Supplementary Figure S1B); (ii) the genomic separation
uations (Supplementary Methods). In total, 129 TFs in             distances between the enhancers and promoters follow the
GM12878 and 270 TFs in K562 cell-lines are included in            same distance distribution of the positive training set. Un-
the analysis (Supplementary Figure S1A). The significant          controlled genomic distances have been found to substan-

                                                                                                                                   Downloaded from https://academic.oup.com/nar/article/49/18/10347/6376026 by guest on 28 November 2021
narrow peaks identified by MACS2 (69) are used to label           tially dominate the models and result in simple short-range
whether a TF binds to a specific genomic location (Fig-           predictions, leading to inflated performance (50,51). Us-
ure 1E). Detailed information of all datasets (i.e. TF ChIP-      ing the positive training set of enhancer–promoter pairs,
seq, epigenomic signals, transcriptomic data and chromatin        we group them into different genomic distance bins. For
contact maps) are summarized in Supplementary Table S1.           each distance bin (bin-size = 50 kb), we sample the same
   The protein–protein interaction dataset is collected from      number of negative enhancer–promoter pairs as observed
the STRING database v11 (67). To remove low-quality               from the positive set. Therefore, the genomic distance is
PPIs, only PPIs with confidence scores greater than 100           controlled and the final predictions will not be driven by
in the ‘Experiments’ category are included into the analy-        genomic distances alone (Supplementary Figure S1C, 1D).
sis. Multiple PPI confidence score thresholds (e.g. 200 and       (iii) The negative enhancer–promoter pairs are sampled for
300) are also tested, which produce similar predictive per-       genes which are actively transcribed (Supplementary Fig-
formance (see Results). The high-quality PPIs are then sum-       ure S1E, F). As demonstrated by previous studies (73), the
marized into a matrix and represented as a PPI network,           false negative rates of Hi-C datasets are substantially lower
where every node corresponds to a protein and every edge          in actively transcribed genomic regions, i.e. more enhancer–
corresponds to a protein–protein interaction. To account          promoter interactions can be mapped by Hi-C in active re-
for the intratypic dimerizations of TFs from the Nuclear          gions compared to repressive genomic regions. To account
Receptor (NR), bHLH and bZIP families, these PPI edges            for this intrinsic bias of Hi-C data, we restrict the sampling
are removed from the PPI network (70) (Supplementary Ta-          of negative enhancer–promoter pairs only from genes whose
ble S2), because they can only bind locally as dimers. The        cell-type specific expression is nonzero (RPKM > 0). By
nodes are further classified into two types: (i) TF protein       controlling these three key sets of confounding factors, we
nodes and (ii) non-TF protein nodes. For edges connect-           thus construct the rigorous balanced training dataset for
ing two TF nodes, i.e. TF–TF PPIs, if both TFs are ex-            robust model training and performance evaluation. In to-
pressed in the specific cell-type, then the TF–TF PPI is con-     tal, the balanced training dataset contains 5348 enhancer–
sidered as active. Therefore, cell-type specificity is assigned   promoter pairs in GM12878 and 8650 enhancer–promoter
for every TF–TF PPI. non-TF protein nodes are maintained          pairs in K562.
in the PPI network because they are useful to identify in-           Based on the cell-type specific multi-omics datasets, the
direct TF–TF interactions mediated by non-TF proteins,            matrix of features are then constructed for enhancer–
leading to the discovery of TF PPI modules in subsequent          promoter pairs in the training dataset (Figure 1E). There
steps.                                                            are three types of features incorporated into the model: (i)
                                                                  activity-based features; (ii) genomic distance and (iii) TF
                                                                  PPI features. Activity-based features include (i) cell-type
Generation of the training dataset and the matrix of features
                                                                  specific enhancer activity measured by DNase-seq signals
In a specific cell-type, enhancer–promoter pairs that over-       as described above (17); (ii) cell-type specific gene expres-
lap with significant Hi-C interactions (29), i.e. the enhancer    sion measured by RNA-seq (17) and (iii) the activity cor-
of the pair overlaps with one of the Hi-C interaction an-         relations between enhancers and their paired genes calcu-
chors and the promoter overlaps with the other anchor,            lated from diverse cell-types profiled in the ENCODE and
are labeled as positive samples of enhancer–promoter in-          Roadmap Epigenomics projects (16,17). All these activity-
teractions. As reported by previous studies (35,71,72), the       based features are differentially distributed across positive
data quality of Hi-C interactions whose anchors are lo-           and negative training sets, suggesting they are informative
cated in different topologically associated domains (TADs)        to make predictions (Supplementary Figure S2A–C). For
are substantially reduced. Therefore, we remove cross-TAD         each enhancer-gene pair, the genomic distance is calculated
interactions from the analysis, and only use intra-TAD            as the distance between the center of the enhancer and the
enhancer–promoter interactions, i.e. the interacting en-          gene’s TSS. Although they have been controlled in the posi-
hancer and promoter are located in the same TAD, to train         tive and negative training sets based on genomic bins, there
the model.                                                        might be residue distance bias within bins. Therefore, the
   To avoid biased model training and inflated performance        inclusion of genomic distances into the feature matrix cap-
evaluations, we generate a balanced negative set of train-        tures the residue effects of genomic distances, leading to ro-
ing samples by randomly selecting the same number of              bust feature prioritization in subsequent analyses.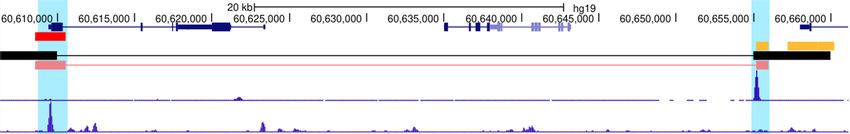
10352 Nucleic Acids Research, 2021, Vol. 49, No. 18

   TF PPIs are the most important set of features for the           ules merge together to form larger modules (Supplemen-
model because of both the mechanistic relationship with             tary Figure S4). Biologically, using TF PPI modules as
long-range regulation (58,59,74) and their significant en-          features is consistent with the regulatory mechanisms of
richment in enhancer–promoter interactions (Figure 1B, C            long-range chromatin loops, because multiple TFs usu-
and Supplementary Figure S2D). In each specific cell-type           ally interact with each other as protein complexes. Empir-
(i.e. GM12878 or K562 cells), all TFs with available ChIP-          ically, the biological relevance of TF PPI modules is also
seq datasets are collected as described above and compared          supported by the data. As can be seen in Supplementary
with the PPI database (67). From the pool of all candidate          Figure S5, similar to individual TF–TF pairs, a specific
pairs, the TF–TF pairs that are capable of forming direct           subset of TF modules are strongly enriched in enhancer–
PPIs are considered as TF PPIs. Considering the differences         promoter Hi-C interactions and are strongly supported
of binding sites in enhancers or promoters, each TF PPI             by PPI connections (P-value = 1.39 × 10⁻² , permutation
pair is allocated with two directional features. For example,       test).
TFa –TFb represents the PPI between enhancer-binding TFa               TF PPI modules are computationally identified from the

                                                                                                                                      Downloaded from https://academic.oup.com/nar/article/49/18/10347/6376026 by guest on 28 November 2021
and promoter-binding TFb , while TFb –TFa represents the            PPI network (67) using a random-walk based network-
PPI between enhancer-binding TFb and promoter-binding               community detection approach. The PPI network, includ-
TFa . Thus, a set of directional TF PPI features is gener-          ing non-TF protein nodes, is modeled as an undirected
ated. Because the features are generated only for TFs with          weighted graph, where the weights on edges are the ‘Ex-
cell-type specific ChIP-seq signals, PPIs between TFs that          periment’ PPI scores from the STRING database (67).
are not active in the specific cell-type do not participate         Define W as the adjacency matrix of the PPI network,

in the predictions. Enhancer-promoter pairs are scanned             and define the diagonal degree matrix D as Dii =     Wi j .
for TF binding peaks in enhancers and promoters. For                                                                       j
each enhancer–promoter pair, if TFa binds to the enhancer           Hence, based on the stochastic model of random-walks on
and TFb binds to the promoter, then the directional PPI             graphs (75), the 1-step transition probability from node i
                                                                                        W
feature TFa –TFb is labeled as 1. Therefore, a matrix of            to node j is Diii j , and the p-step transition matrix Tr ans p
TF PPI features is constructed for all enhancer–promoter            can be calculated as Tr ans p = (D−1 ∗ W) P . Based on the
pairs. Combining with the activity-based features and ge-           p-step transition matrix, the pairwise distance matrix be-
nomic distances, the full matrix of features is then built          tween TFs (denoted as R) can be further calculated as: R =
(Figure 1E).                                                        di ag(G)t ∗ 1 + 1t ∗ di ag(G) − 2G, where G = Tr ans p ∗
                                                                    Tr ans p t . Each entry in the matrix R quantifies the dis-
Hierarchical TF community detection on the PPI network              tance between a pair of TFs based on the PPI network
                                                                    structure. Hierarchical clustering is then applied to the pair-
Due to the large number of TF PPI features, dimension               wise distance matrix R to identify hierarchical PPI mod-
reduction is fundamentally important for the construction           ules of TFs (Figure 1E). ‘wald’ method is used in the hi-
of robust predictive models. Without dimension reduction,           erarchical clustering as suggested by previous studies of
there are 1888 TF PPI features in GM12878 and 7066 TF               network-community detections (76). By testing multiple
PPI features in K562 cells. Although a number of TF PPIs            values (Supplementary Figure S4A and 4B), p is set to be
are enriched in enhancer–promoter interactions (Figure 1B           20 in order to balance the detection of both local (i.e. small-
and C), direct incorporation of these TF PPI features makes         size) and global (i.e. large-size) modules (Supplementary
the model to be over-complicated, leading to poor general-          Methods).
ization of predictions. To illustrate the significant overfitting      In the constructed hierarchical clustering tree, the leaf
issues of direct incorporation of high-dimensional TF PPI           nodes are individual TF PPIs. By applying the bottom-up
features, a basic random forest model is used to test the per-      merging strategy on the tree, individual TF PPIs are first
formance in GM12878 (29). The features include the activ-           grouped into small-size PPI modules, i.e. S-modules, with
ity correlations between enhancers and genes, genomic dis-          the maximum size of Smax . S-modules represent densely
tances and 1888 active TF PPI features. Although the reg-           connected TFs in the PPI network, corresponding to can-
ular 5-fold cross-validation shows an AUC of 0.89, a rigor-         didate protein complexes. S-modules are further merged to
ous genomic-bin split cross-validation (see subsequent sec-         form large-size PPI modules, i.e. L-modules, with the max-
tions on cross-validation) shows the unbiased AUC as 0.55,          imum size of Lmax . L-modules represent larger PPI net-
suggesting strong overfitting problems without advanced             work components that cover multiple densely connected
feature dimension reductions (Supplementary Figure S3).             S-modules. Biologically, L-modules represent candidate
Thus, a novel predictive model is needed for predicting long-       groups of highly interacting protein complexes. The max-
range enhancer–promoter interactions based on PPI fea-              imum sizes for S-modules (Smax ) and L-modules (Lmax )
tures among transcription factors.                                  are selected based on the modularity score of the cluster-
   To address the over-fitting problem, we substantially re-        ing (77) (Supplementary Figure S4, Supplementary Meth-
duce the feature dimensions by hierarchically grouping in-
                                                                    ods). The modularity score Q is defined as Q = 2m          1
                                                                                                                                  ∗
dividual TF PPIs into TF PPI modules based on the topol-                        ki k j
ogy of the PPI network, while maintaining the predictabil-             (Wi j − 2m ) ∗ δ(ci , c j ) where W is the adjacency matrix,
                                                                    ij
ity of the model (Figure 1E). TF PPI modules represent
densely connected groups of TFs in the PPI network, and             ki is the degree of node i , m
                                                                                                   is the total number of edges
they are hierarchically organized where smaller PPI mod-            in the PPI network (m = 12        ki ), and ci is the member-
                                                                                                    i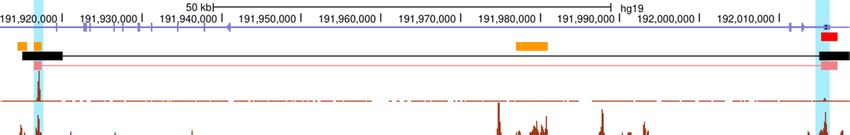
Nucleic Acids Research, 2021, Vol. 49, No. 18 10353

ship assignment to modules for node i . Modularity scores       Predictive model of long-range enhancer–promoter interac-
are extensively calculated for different choices of maximum     tions
module sizes (Supplementary Figure S4C and D), because
                                                                Random forest model is used to predict cell-type specific
the choice of specific maximum module sizes automatically
                                                                long-range enhancer–promoter interactions based on the
determines the total number of modules and results in the fi-
                                                                feature matrix constructed above, after module-based di-
nal module membership assignments. The optimal size of S-
                                                                mension reduction (Figure 1E). Random forest model is
modules is selected as the one yielding the maximum modu-
                                                                selected due to its superior performance of handling non-
larity score, which guarantees that the generated S-modules
                                                                linear feature dependency and its capability of prioritizing
represent densely connected TF groups. The optimal size of
                                                                the key set of important features for subsequent biological
L-modules is selected as the one corresponding to the elbow
                                                                interpretations. As a free model parameter, the number of
point of modularity score curves, leading to the delineation
                                                                decision trees in the model is extensively tested with differ-
of large-scale PPI components without significant loss of
                                                                ent values, and the accuracy of predictions is found to be
modularity. Compared to Markov Cluster Algorithm, the

                                                                                                                                 Downloaded from https://academic.oup.com/nar/article/49/18/10347/6376026 by guest on 28 November 2021
                                                                robust (Supplementary Figure S7).
PPI modules from our approach demonstrate higher modu-
                                                                   Additionally, to quantitatively demonstrate the contribu-
larity scores and larger module sizes (Supplementary Figure
                                                                tions from TF PPIs, we train random forest models based
S6), which is desired for feature dimension reductions. Us-
                                                                on two versions of input features: (i) the model is trained
ing this procedure, a two-layer hierarchical modular struc-
                                                                using only activity-based features and genomic distances;
ture is finally built and each individual TF PPI is assigned
                                                                and (ii) the full set of features including module-level TF
with the memberships belonging to a specific S-module and
                                                                PPI features. The Area Under Curve (AUC) values of cross-
a specific L-module.
                                                                validations are calculated for the two versions. The in-
   Based on the TF PPI module assignments, individual
                                                                creased AUC from version 2 is the quantitative measure-
TF PPI features (i.e. direct TF–TF PPIs) are merged into
                                                                ment of the additional information contributed from TF
module-level PPI features, and, therefore, the feature matrix
                                                                PPIs that is not encoded in activity-based or genomic dis-
of TF PPIs are restructured accordingly (Figure 1E). There
                                                                tance features.
are two types of module-level PPI features: (i) intra-module
features, which include all S-modules and L-modules. The
intra-module features cover PPIs between TFs within the
                                                                Feature selection
same modules. (ii) inter-module features, which include in-
ter S-module features and inter L-module features. The          In the random forest model, the backward feature elimi-
inter-module features cover PPIs linking TFs from two dif-      nation approach is used to select useful module-level TF
ferent modules. Given a pair of S-modules, e.g. S-module a      PPI features, where the features with the minimum impor-
and S-module b, if there exists a TF member from S-module       tance are recursively eliminated from the model. Further-
a that has PPI with a TF member from S-module b, then the       more, the statistical significance of the directions of TF PPI
pair of S-modules a and b is included into the feature matrix   features are evaluated. As described in the previous section,
as one inter S-module PPI feature. The inter L-module PPI       every module-level PPI feature is split into a pair of two di-
features are defined in the same way by checking PPIs of        rectional features, based on the binding sites of TFs in en-
TF members from two L-modules. Each inter-module fea-           hancers or promoters. For example, the feature module a–
ture is further split into two directional features, depend-    module b represents the PPI between an enhancer-binding
ing on the binding sites of TF members in enhancers and         TF member from module a and a promoter-binding TF
promoters. Using this approach, the PPI features are sub-       member from module b. Reversely, the feature module b –
stantially reduced. For example, the 1,888 individual TF        module a represents the PPI between an enhancer-binding
PPI features are reduced to only 78 module-level PPI fea-       TF member from module b and a promoter-binding TF
tures in GM12878 and the 7066 individual TF PPI features        member from module a. Based on the statistical evaluation
are reduced to only 238 module-level PPI features in K562       of the feature directions, insignificant directional features
cells.                                                          are merged into un-directional features. This feature merg-
   The training set of enhancer–promoter pairs are then         ing procedure not only reduces the number of features but
scanned for module-level PPI features. For each specific        also reveals the biological roles of TF bindings in the con-
enhancer–promoter pair, based on the counts of individual       text of different binding orientations.
TF PPI features calculated in the previous step, the counts        The determination of whether a pair of directional TF
of module-level PPI features are generated depending on the     PPI features to be merged into an un-directional fea-
module memberships of TFs (Figure 1E). For each module-         ture is a model selection problem. While Akaike Infor-
level PPI feature, if multiple TF PPI features are found for    mation Criterion (AIC) has been a widely used met-
an enhancer–promoter pair, the maximum count is used for        ric for parametric models, it can not be applied to ran-
the module-level feature. Although the number of features       dom forest models, which are non-parametric. Instead, we
is substantially reduced after using module-level PPIs, the     use the Generalized Degrees of Freedom (GDF) method
specific PPI information is still maintained in this proce-     to calculate a relaxed AIC (78) for the random forest
dure, as shown in Supplementary Figure S5. It suggests that     model. GDF is a metric to evaluate the degrees of free-
the module-based dimension reduction does not cause the         dom for Bernoulli distributed data, e.g. the binary labels
loss of information, while substantially reducing the risk of   for enhancer–promoter
                                                                                         interactions. And it is defined as

over-fitting.                                                   G DF ≈ (yi − ŷi )/(y i − yi ), where yi is the observed
                                                                          i
10354 Nucleic Acids Research, 2021, Vol. 49, No. 18
label for data point i , yi is the perturbed label by invert- forest model. The remaining 20% bins are selected as testing
ing yi , i.e. yi = 1 − yi ,
yi is the predicted label from the bins, and the samples of enhancer–promoter pairs from the
model using the unperturbed yi , and yi is the predicted la- testing bins are used to test the model. Using this genomic
bel from the model using the perturbed yi . As suggested by bin-split cross-validation method, the dependency between
previous studies (78), to calculate GDF, 20% samples are training and testing samples are broken and the model per-
simultaneously perturbed. The relaxed AIC of random for- formance can be rigorously quantified.
est models are then estimated as AIC = −2lm + 2G DF + The performance of our model, ProTECT, is compared
G DF(G DF + 1)/(N − G DF − 1), where N represents the with two most recent supervised methods that also leverage
total number of data points and lm represents the goodness- TF information: IM-PET (45) and TargetFinder (46). In ad-
of-fit of the random forest model. As suggested by previous dition to activity-based features and genomic distances, IM-
analyses (78), lm is calculated as the averaged R2 value from PET and TargetFinder also includes the TF binding fea-
5-fold cross-validations. tures in enhancers and promoters, while TargetFinder fur-
For each pair of directional TF PPI features, the relaxed ther incorporates TF binding information in the genomic
Downloaded from https://academic.oup.com/nar/article/49/18/10347/6376026 by guest on 28 November 2021
AIC metrics are calculated before and after they are merged windows between enhancers and promoters. By comparing
into an un-directional feature. If a smaller AIC is observed with these two algorithms, we can further demonstrate the
by merging the two directional features, the model with improved accuracy is obtained purely from the unique fea-
the merged un-directional feature is then selected, because tures of our model, i.e. the PPIs between TFs.
the reduced AIC suggests the directions of the pair are not The stand-alone package of IM-PET (https://github.
statistically important. This procedure is conducted for all com/tanlabcode/IM-PET) is applied to the same dataset.
pairs of directional TF PPI features, and a final random for- Since IM-PET automatically makes predictions for all
est model with the selected features is built. In GM12878 enhancer-gene pairs with distancesNucleic Acids Research, 2021, Vol. 49, No. 18 10355
dataset. Based on the null distribution, the P-value for each the fractions calculated from the Hi-C training samples in
enhancer–promoter pair is then calculated. model training, and are more robust, given the larger pool
Unlike the phase of model training, where the genomic of genome-wide enhancer–promoter pairs (see Results). Us-
distances are controlled in order to learn specific TF PPI sig- ing the fractions, the top-ranking TF-level PPI features are
natures, the phase of genome-wide predictions requires the thus identified for each important module-level PPI fea-
incorporation of genomic distance information. As shown ture. The prioritized features, both module-level and TF-
by chromatin contact maps, e.g. Hi-C datasets, enhancer– level, shed light on new biological insights on long-range
promoter pairs with shorter genomic separation distances enhancer regulation.
have higher probability to interact and the probabilities de-
cay as the distances increase (Supplementary Figure S1C).
Pathway enrichment analysis for genes regulated by specific
To statistically incorporate the genomic distances based on
TF PPIs
this prior knowledge, we use the pFDR algorithm (79) to
transform P-values into distance-aware q-values. In pFDR, To investigate whether chromatin interactions mediated by
Downloaded from https://academic.oup.com/nar/article/49/18/10347/6376026 by guest on 28 November 2021
the distribution of distances between Hi-C linked enhancers different TF PPIs may participate in distinct biological
and promoters is treated as prior probabilities of interac- pathways, we classify genes based on the specific TF PPI
tions for enhancer–promoter pairs. Based on Hi-C data, features involved in their interactions with enhancers. For
ProTECT divides the range of distances into consecutive each top-ranking module-level PPI feature, we first iden-
20 kb bins, and the prior probability of interactions for each tify the top five TF-level PPI features using the method de-
distance bin is calculated as: scribed above. Then, we scan the genome-wide predictions
πi = 5% ∗ (number o f signi f i cant Hi − C i n bi n i )/ of enhancer–promoter interactions and collect the subset of
(number o f signi f i cant Hi − C i n bi n 1 ) , where πi interactions that contain at least one of the top five TF-level
is the prior probability for distance-bin i . The prior PPI features. Finally, the subset of interactions are ranked
probability for bin 1 (i.e. the shortest distance bin) by their q-values, and the top 1000 genes regulated by these
is set to be the default 0.05. The pFDR under rejec- interactions are selected. In this way, the prioritized sub-
tion region [0, γ ] in distance-bin i is then calculated as set of genes represent strong targets of long-range enhancer
p F DR(γ ) = πi Pr (P ≤ γ |H = 0)/Pr (P ≤ γ ) = regulation mediated by the important TF PPIs. Gene On-
πi γ /Pr (P ≤ γ ), where P represents the P-value for each tology enrichment analyses are performed on different gene
enhancer–promoter interaction. P follows the uniform sets using DAVID (80) to check whether they are enriched
distribution under the null hypothesis, i.e. H = 0, so that with specific biological pathways.
Pr (P ≤ γ |H = 0) = γ . Pr (P ≤ γ ) can be estimated
N
by Pr (P ≤ γ ) = ( δ(Pj ≤ γ ))/N, where Pj is the cis-eQTL enrichment analysis for predicted long-range
j =1 enhancer–promoter interactions
P-value for the enhancer–promoter interaction j , N repre-
As the orthogonal information to validate the accuracy
sents the total number of P-values, and δ(x) equals to 1 if
of genome-wide predictions made by ProTECT, cis-eQTL
x is true and equals to 0 otherwise. Therefore, the q-values
datasets from the matched human tissues and cell-types
can be calculated as Q(P) = i n fγ >P (πi γ / Pr (P ≤ γ )),
are compared with the predicted enhancer–promoter in-
which combines the information from both the distance-
teractions. Because our genome-wide predictions are made
aware prior probabilities (πi ) and the P-values from the
in human GM12878 and K562 cells, we selected four
random forest model (P). Based on the q-value threshold
eQTL datasets (81–84) which were profiled from either
of 0.05, the final genome-wide predictions of significant
whole blood tissues or lymphoblastoid cells. A predicted
enhancer–promoter interactions are obtained.
enhancer–promoter interaction is considered to be sup-
ported by a cis-eQTL (i.e. a significantly associated SNP-
Feature interpretation for mechanistic insights
gene pair), if the enhancer contains the SNP and the pro-
Using the trained random forest model of ProTECT, we moter matches with the gene. For each eQTL dataset, the
evaluate and rank the importance of features, i.e. the fraction of predicted enhancer–promoter interactions that
module-level PPI features in the model. The top-ranking are supported by cis-eQTLs is calculated, and is compared
module-level PPIs are considered as important features, to two versions of negative controls. The first version of neg-
which represent putative protein complexes that may reg- ative control is based on random pairing enhancers with
ulate chromatin interactions. Furthermore, in order to ob- promoters that are within 2 Mb distances. The second ver-
tain detailed mechanistic understandings of important PPIs sion of negative control further requires the genomic dis-
between specific TFs, we decode the module-level PPI fea- tances of random enhancer–promoter pairs follow the same
ture importance into TF-level PPI feature importance. For distribution from our predicted enhancer–promoter inter-
each prioritized module-level PPI feature, we decompose it actions. Therefore, the second version is a more stringent
into individual TF–TF PPI features, i.e. specific PPIs be- control. For each version, 1000 random samples are gen-
tween an individual enhancer-binding TF and an individ- erated. And the statistical significance, i.e. P-values, of the
ual promoter-binding TF. Then the genome-wide predic- observed overlapping fractions from our predictions is cal-
tions of enhancer–promoter interactions are scanned, and culated as the portion of random samples showing a higher
the fractions of predictions that contain the specific TF- overlapping fraction than the real observed one.
level PPI features are calculated. The fractions scanned In addition to cis-eQTLs, we also use cis-hQTLs, i.e. his-
from genome-wide predictions are highly correlated with tone QTLs, to evaluate the accuracy of our predictions. The10356 Nucleic Acids Research, 2021, Vol. 49, No. 18
hQTL dataset was also profiled from the human GM12878 located within the TF’s gene body and the gene is the same
cells (85). Similarly, a predicted enhancer–promoter inter- as the trans-eQTL’s target gene. As comparisons, two ver-
action is considered to be supported by a cis-hQTL (i.e. a sions of controls are generated based on the same set of TFs
significantly associated SNP-histone pair), if the enhancer and enhancers. The first version uses the nearest genes to the
contains the SNP and the promoter overlaps with the hi- enhancers as target genes, instead of using ProTECT’s pre-
stone modification peak. The overlapping fraction is also dictions. The second version randomly selects genes within
compared with the two versions of negative controls to jus- 2 Mb distances as target genes. In each version, the same
tify the enrichment of cis-hQTLs in support of our predic- number of enhancer–promoter interactions are generated as
tions. seen from the foreground for each sample, and totally 1000
random samples are created, along with the hypergeometric
P-values.
cis-eQTL enrichment around TF binding sites
For cis-eQTLs that overlap with predicted enhancer–
Downloaded from https://academic.oup.com/nar/article/49/18/10347/6376026 by guest on 28 November 2021
promoter interactions, the genomic locations of the SNPs RESULTS
from cis-eQTLs are further compared with TF binding sites
Long-range enhancer–promoter interaction prediction based
within enhancers. Here, the TF binding sites are defined as
on PPIs among TFs
the ChIP-seq peak summits. For each enhancer included in
this analysis, the TFs involved in important PPI features As discovered by recent experimental studies (4–6,8–
prioritized from the previous steps are selected. The ge- 13,58,59), the protein–protein interactions between spe-
nomic distances between the SNPs and the binding sites of cific transcription factors have been found to participate
these TFs are calculated. To statistically test whether the in the regulation of long-range chromatin loops, where the
SNPs are closer to these important PPI-related TFs, two TFs bind to enhancers and promoters respectively (Fig-
versions of random controls are generated. The first ver- ure 1A). The PPIs between the enhancer-binding TFs and
sion is generated by randomly sampling binding sites of any promoter-binding TFs facilitate the 3D proximity of en-
TFs within the same set of enhancers. And the second ver- hancers and the target gene’s promoters. By analyzing the
sion is generated by randomly sampling binding sites of TFs Hi-C interactions between enhancers and promoters in hu-
that are members of bottom-ranking PPI features, based on man GM12878 cells, a specific set of TF–TF pairs are
feature importance calculations from the previous sections. found to be enriched in enhancer–promoter interactions
For each version of negative controls, P-values are calcu- (Figure 1B), compared to their frequencies in distance-
lated using Kolmogorov–Smirnov tests by comparing the controlled random enhancer–promoter pairs. Interestingly,
cumulative distributions of distances. these TF–TF pairs are also enriched with known PPIs (Fig-
ure 1C, P-value = 10–3 ), suggesting that the TFs within each
pair can establish interactions at the protein level. Figure
trans-eQTL enrichment analysis for enhancer-mediated TF–
1D shows two examples, where both enhancer–promoter
gene pairs
Hi-C interactions contain enhancer-binding CTCF peaks
Compared to cis-eQTLs, trans-eQTLs can provide addi- and promoter-binding RUNX3 peaks. And the physical
tional evidence to support the functional associations be- interaction between RUNX3 and CTCF is validated by
tween the prioritized TFs and specific genes, where the TF’s the PPI database STRING (67), suggesting the RUNX3-
PPIs are predicted to mediate enhancer–promoter interac- CTCF interaction as a putative mechanism linking the en-
tions of the target genes. For enhancer-binding TFs that are hancers with specific promoters. These observed enrich-
members of the important PPI features, we first collect the ments strongly indicate the functional importance of TF
predicted enhancer–promoter interactions mediated by the PPIs in long-range chromatin loops and the possibility
corresponding PPI features. Genes regulated by these pre- of predicting cell-type specific enhancer–promoter interac-
dicted interactions are thus considered as the downstream tions using TF PPI features.
target genes of the specific enhancer-binding TFs. We de- Due to the large number of TF PPI features, i.e. PPIs
fine this relationship as enhancer-mediated TF–gene pairs. between enhancer-binding TFs and promoter-binding TFs,
To exclude the possibility of promoter-mediated effects, we basic predictive models significantly suffer from overfitting
remove the genes whose promoters are also bound by the problems, as shown in Supplementary Figure S3. Therefore,
specific TF. to efficiently leverage the information of TF PPIs from the
Using the trans-eQTLs from the published database (86), high-dimensional feature space and overcome the overfit-
we identify a subset of trans-eQTLs whose SNPs are lo- ting risks, we developed a new machine learning classifier,
cated within TF’s gene bodies (plus –10 kb from TSS) and ProTECT, to predict cell-type specific long-range enhancer–
target genes are covered in our input dataset. For this spe- promoter interactions (Figure 1E). Detailed algorithmic de-
cific subset of trans-eQTLs, the SNPs are likely to disrupt signs have been described in Materials and Methods. Over-
the transcription of the TF genes, which in turn affects the all, there are four main steps to achieve the final predictions:
TF’s regulation on the downstream target gene’s expression (i) generation of the balanced Hi-C based training dataset,
(Supplementary Methods). along with cell-type specific TF PPI features; (ii) dimension
Hypergeometric test is used to statistically test whether reduction of features based on hierarchical network com-
the enhancer-mediated TF–gene pairs significantly overlap munity detection; (iii) predictive model construction using
with the subset of trans-eQTLs described above. A TF–gene random forest and (iv) Genome-wide predictions of cell-
pair is considered to overlap with a trans-eQTL if the SNP is type specific enhancer–promoter interactions.You can also read