CPB - Performance of Maritime Logistics
←
→
Page content transcription
If your browser does not render page correctly, please read the page content below
CPB
               Corporate Partnership
               Board

Performance of
Maritime Logistics
                                       Case-Specific Policy Analysis
Performance of
Maritime Logistics
                     Case-Specific Policy Analysis
The International Transport Forum

The International Transport Forum is an intergovernmental organisation with 64 member countries. It acts
as a think tank for transport policy and organises the Annual Summit of transport ministers. ITF is the only
global body that covers all transport modes. The ITF is politically autonomous and administratively
integrated with the OECD.
The ITF works for transport policies that improve peoples’ lives. Our mission is to foster a deeper
understanding of the role of transport in economic growth, environmental sustainability and social
inclusion and to raise the public profile of transport policy.
The ITF organises global dialogue for better transport. We act as a platform for discussion and pre-
negotiation of policy issues across all transport modes. We analyse trends, share knowledge and promote
exchange among transport decision makers and civil society. The ITF’s Annual Summit is the world’s largest
gathering of transport ministers and the leading global platform for dialogue on transport policy.
The Members of the Forum are: Albania, Armenia, Argentina, Australia, Austria, Azerbaijan, Belarus,
Belgium, Bosnia and Herzegovina, Bulgaria, Cambodia, Canada, Chile, China (People’s Republic of),
Colombia, Croatia, Czech Republic, Denmark, Estonia, Finland, France, Georgia, Germany, Greece,
Hungary, Iceland, India, Ireland, Israel, Italy, Japan, Kazakhstan, Korea, Latvia, Liechtenstein, Lithuania,
Luxembourg, Malta, Mexico, Republic of Moldova, Mongolia, Montenegro, Morocco, the Netherlands,
New Zealand, North Macedonia, Norway, Poland, Portugal, Romania, Russian Federation, Serbia,
Slovak Republic, Slovenia, Spain, Sweden, Switzerland, Tunisia, Türkiye, Ukraine, the United Arab Emirates,
the United Kingdom, the United States and Uzbekistan.
                                      International Transport Forum
                                            2 rue André Pascal
                                          F-75775 Paris Cedex 16
                                           contact@itf-oecd.org
                                             www.itf-oecd.org

                    Case-Specific Policy Analysis Reports
The ITF’s Case-Specific Policy Analysis series presents topical studies on specific issues carried out by the
ITF in agreement with local institutions. Any findings, interpretations and conclusions expressed herein are
those of the authors and do not necessarily reflect the views of the International Transport Forum or the
OECD. Neither the OECD, ITF nor the authors guarantee the accuracy of any data or other information
contained in this publication and accept no responsibility whatsoever for any consequence of their use.
This work is published under the responsibility of the Secretary-General of the ITF. This document, as well
as any data and map included herein, are without prejudice to the status of or sovereignty over any
territory, to the delimitation of international frontiers and boundaries and to the name of any territory,
city or area.
Cite this work as: ITF (2022), “Performance of Maritime Logistics”, International Transport Forum Policy
Papers, No. 106, OECD Publishing, Paris.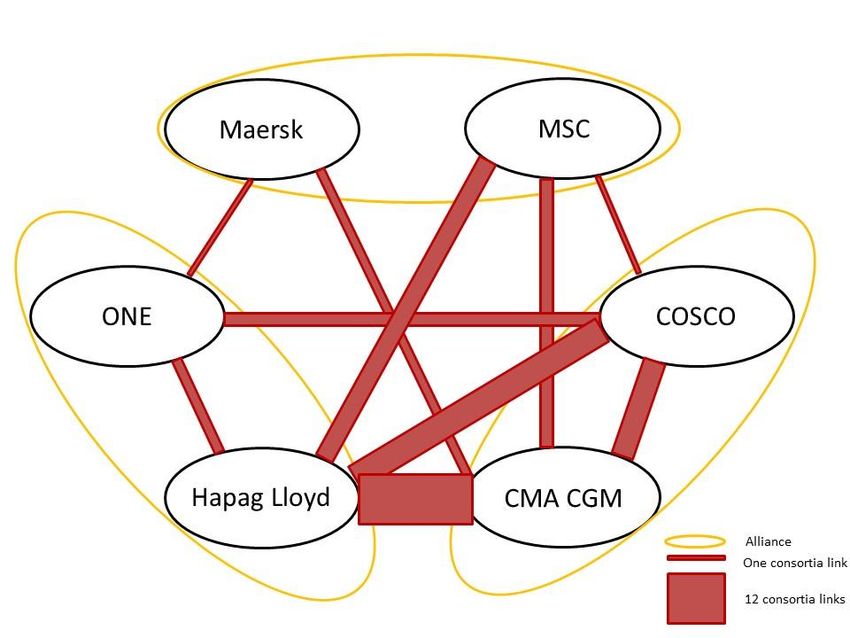
Acknowledgements

This report was written by Olaf Merk of the International Transport Forum (ITF) and Antonella Teodoro
(MDS Transmodal). It builds on discussions on maritime logistics performance within the framework of the
ITF Global Maritime Logistics Dialogue. As such, it benefits from discussions with: Pyers Tucker (Hapag
Lloyd), Henning Schleyerbach (Digital Container Shipping Association), Chong Meng Tan (PSA
International), Ghim Siew Ho (PSA International), Lamia Kerdjoudj-Belkaid (Federation of European Private
Port Companies and Terminals, Feport), Daniel Hosseus (Feport), Isabelle Ryckbost (European Seaports
Organisation) Anne Stuhlmann (European Seaports Organisation), Nicolette van der Jagt (European
Association for Forwarding, Transport, Logistics and Customs Services, CLECAT), Miglė Blusevičiūtė
(CLECAT), Jens Roemer (International Federation of Freight Forwarders Associations, FIATA), Gene Seroka
(Port of Los Angeles), Eric Caris (Port of Los Angeles), Iris Scheel (Port of Hamburg), Andrea Thiel (Port of
Hamburg), Luc Arnouts (Port of Antwerp), Pieter de Waard (Port of Rotterdam), Katherine Bamford (Port
of Vancouver), Jordi Espin (European Shippers Council) and James Hookham (Global Shippers Forum). It
also benefits from data provided by container terminal operators.
The report was reviewed by Stephen Perkins (ITF), Ingrid Bocqué (Hamburg Port Authority) and
representatives from the Danish Maritime Authority, the European Community Shipowners’ Associations,
the Global Shippers Forum, the European Association for Forwarding, Transport, Logistics and Customs
Services, the International Federation of Freight Forwarders Associations and the Federation of European
Private Port Companies and Terminals. The report was edited by Hilary Gaboriau (ITF). The report was
made possible by a voluntary contribution from the Hamburg Port Authority.
TABLE OF CONTENTS

                                                   Table of contents

    Executive summary.............................................................................................................................. 7
    Performance of containerised maritime transport............................................................................. 10
       The price of container shipping ..................................................................................................... 10
       Reliability ....................................................................................................................................... 16
       Speed............................................................................................................................................. 18
       Direct liner connectivity ................................................................................................................ 23
    Causes and effects of maritime performance .................................................................................... 25
       Demand for containerised transport ............................................................................................. 25
       Container shipping capacity .......................................................................................................... 29
       Ship reliability and port congestion ............................................................................................... 35
    Maritime performance’s impact on trade, modal shift and vertical integration ................................. 38
       Trade patterns .............................................................................................................................. 38
       Modal shifts .................................................................................................................................. 40
       Vertical integration ....................................................................................................................... 42
    Policy implications ............................................................................................................................. 44
       Improve competition monitoring in container shipping................................................................ 45
       Reconsider competition arrangements for liner shipping ............................................................. 47
       Focus regulatory attention on fair door-to-door container transport........................................... 48
       Increase transparency of container shipping rates and charges ................................................... 49
       Collect comprehensive indicators on performance ...................................................................... 51
       Secure the strategic value of container shipping .......................................................................... 52
       Reconsider port networks ........................................................................................................ .....53
       Increase cost coverage of public maritime infrastructure ............................................................. 54
    References......................................................................................................................................... 55

                                                                  Figures

    Figure 1. Evolution of containerised spot rates, 2016-2022 ............................................................... 11
    Figure 2. Evolution of containerised spot rates by trade lane ............................................................ 12
    Figure 3. Container Trade Price Index (CTS), 2016-22 ........................................................................ 13
    Figure 4. Link between spot rates and contract rates on Asia-Europe and
    Asia-North America routes, 2019-21 ................................................................................................. 14

4                                                                                        PERFORMANCE OF MARITIME LOGISTICS © OECD/ITF 2022
TABLE OF CONTENTS
Figure 5. Changes in detention and demurrage charges for container carriers
since January 2020 ............................................................................................................................ 15
Figure 6. Container shipping schedule reliability, 2018-22 ................................................................. 16
Figure 7. Global average arrival delays for container ships, 2018-22 ................................................. 17
Figure 8. Actual calls per scheduled port calls, 2019-21 ..................................................................... 18
Figure 9. Evolution of time at sea between 2019 and 2021 ............................................................... 19
Figure 10. Time in port and time at anchorage in container ports globally, 2019-21 ......................... 20
Figure 11. Time in port and time at anchorage in United States container ports, 2019-21 ................ 21
Figure 12. Time in port and time at anchorage in Chinese container ports, 2019-21 ......................... 21
Figure 13. Time in port and time at anchorage in European container ports, 2019-21 ...................... 22
Figure 14. Average waiting time for inland barges in the ports of
Antwerp and Rotterdam, 2020-22 ..................................................................................................... 23
Figure 15. Scheduled deployed capacity by regions served and number of
direct connections, 2019-21 .............................................................................................................. 24
Figure 16. Development of direct liner connectivity .......................................................................... 24
Figure 17. Global container volumes transported per month, 2013-21 ............................................. 25
Figure 18. Container volumes transported to and from the Far East per month, 2019-21 ................. 26
Figure 19. Container volumes transported to from North America per month, 2019-21 ................... 26
Figure 20. Freight container volumes transported to and from Europe per month, 2019-21............. 27
Figure 21. Ship utilisation rate, Far East-North America, 2019-21 ...................................................... 28
Figure 22. Ship utilisation rate, Far East-Europe, 2019-21 ................................................................. 28
Figure 23. Idle container ship capacity in twenty-foot equivalent units, 2009-21 .............................. 29
Figure 24. Scheduled and actually deployed capacity, 2019-21 ......................................................... 30
Figure 25. Global container transport demand versus scheduled liner service capacity, 2010-20...... 31
Figure 26. Net shift of Asia-Europe capacity to trans-Pacific routes ................................................... 31
Figure 27. Share of container ship capacity operated via consortia, 2006-21 .................................... 32
Figure 28. Interlinkages between carriers via alliances and consortia ................................................ 34
Figure 29. Industry concentration on the trade route between North Europe and the
east coast of North America, 2006–21............................................................................................... 34
Figure 30. Added, cancelled and diverted calls in the port of Rotterdam according to ship size,
January to March 2021 ...................................................................................................................... 35
Figure 31. Added, cancelled and diverted calls in the ports of Los Angeles and Long Beach
according to ship size, January to March 2021................................................................................... 36
Figure 32. Expected and actual port calls in the port of Oakland, 2019-21 ........................................ 37
Figure 33. Far-East market share in global exports per industry sector, 2016, 2020 and 2021........... 38
PERFORMANCE OF MARITIME LOGISTICS © OECD/ITF 2022 5TABLE OF CONTENTS
Figure 34. Shifts in Far East market shares in the clothing and accessories sector
by importing region ........................................................................................................................... 39
Figure 35. Shifts in European import shares for the clothing and accessories sector
by exporting region............................................................................................................................ 40
Figure 36. Containerised deep-sea cargo flows and volumes transported by container
shipping lines, 2016-21 ...................................................................................................................... 41
Figure 37. Asia-Europe containerised rail transport, 2016-21 ............................................................ 41
Figure 38. Operational profit margins of the ten largest container carriers, 2008-21 ........................ 42
Tables
Table 1. CTS Price Index developments for main trade lanes, 2020-22 .............................................. 13
Table 2. Number of links between the top ten carriers via consortia in 2021 .................................... 33
Table 3. Acquisitions by selected container carriers in maritime logistics, 2020-21 ........................... 43
Table 4. Maritime logistics performance indicators ........................................................................... 51
Boxes
Box 1. Federal Maritime Commission: Functions and responsibilities ................................................ 45
Box 2. Merchant shipping reform in the United States ...................................................................... 49
Box 3. Merchant shipping reform in the Philippines .......................................................................... 50
Box 4. Merchant shipping reform in India.......................................................................................... 50
6 PERFORMANCE OF MARITIME LOGISTICS © OECD/ITF 2022EXECUTIVE SUMMARY
Executive summary
What we did
Liner shipping and container ports have repeatedly made headline news since 2020, as companies across
supply chains were hit with price hikes and shipment delays. Predictability became a thing of the past. This
report assesses these disruptions to containerised maritime transport and analyses their causes and
impacts.
What we found
The price of container shipping has increased substantially since the beginning of 2020. Spot rates were
around six times higher on average by the end of 2021 and contract rates 2.9 times higher. However, these
numbers underestimate the cost increase of container transport. Shippers confront a range of additional
surcharges and increased fees for demurrage and detention. During the same period, ship schedule
reliability decreased from 65% to 34%, meaning that two out of three ships arrive in port at least one day
behind schedule. Moreover, unscheduled port cancellations have also increased.
The ship turnaround time in ports in the People’s Republic of China and the United States has doubled
since the beginning of 2020, while in Europe it rose by less than 15%. Many countries in Europe, Latin
America and sub-Saharan Africa saw fewer direct liner connections following reconfigurations of liner
shipping networks. These challenges, plus the strain on port and inland logistics capacity as well as Covid-
19-related labour shortages, have undermined just-in-time business and logistics models.
The globalised nature of container shipping has resulted in local supply chain problems spilling over to
other regions and creating worldwide difficulties. Shippers and freight forwarders in Europe face
exponential increases in ocean freight rates to and from Europe and increasing difficulties booking cargo
space - even though in Europe demand for container shipping is essentially flat and port congestion is
negligible.
Global container shipping companies have used capacity-management strategies to shift ship capacity to
trans-Pacific trade routes in order to accommodate increased demand for consumer goods in the
United States. Public policies have facilitated this situation. Regulators have allowed carriers to use co-
operation arrangements to jointly manage fleet capacity. This option has become the main element of co-
ordination between shipping lines following regulatory initiatives in the European Union and the
United States in the early 2000s to prohibit joint price-fixing in shipping conferences. Expectations that
this intervention would stimulate price competition and lower shipping prices were confounded, however,
by the record-high freight rates since 2020. Thanks to these freight rates, the operational profit margin of
the ten largest container shipping companies reached an estimated USD 160 billion in 2021, a substantial
part of which has been used to fund acquisitions in the freight forwarding and logistics business to achieve
vertical integration.
PERFORMANCE OF MARITIME LOGISTICS © OECD/ITF 2022 7EXECUTIVE SUMMARY What we recommend Improve competition monitoring in container shipping Governments should build up their capacity to monitor competition in maritime transport. The role of specialised agencies should strengthened. Competition authorities should enhance cross-border co- operation, as their actions are interdependent. Reconsider the competition arrangements for liner shipping The current institutional arrangements for competition in liner shipping have not resulted in price stability, lower prices or more competition. A reconsideration is warranted to ensure a sufficiently wide choice of operators and reliable services. Competition arrangements for liner shipping could limit joint capacity management by carriers to foster more competition between them. Focus regulatory attention on fair competition in door-to-door container transport The ongoing vertical integration of the container shipping industry poses new challenges for competition regulation. Shipping companies can use their exemptions from competition law in many jurisdictions and their leverage as carriers to acquire competitive advantages in markets where they now directly compete with freight forwarders, port service providers or logistics operators that do not have such competition law exemptions. Regulators should ensure sufficient competition in the land-side port and logistics markets that the maritime container carriers have entered. Increase transparency of container shipping rates and charges Governments should put in place measures to make the various surcharges levied by maritime shipping companies more transparent. One measure could be making lists of accepted surcharges, and requirements on how these are calculated. The burden of proof for justifying surcharges should be on the carrier, rather than on the shippers, who now often have to prove that these lack justification. The demurrage and detention charges levied on shippers to smooth transport flows in ports should be made more effective by ensuring they are related to costs incurred. They should only be charged if shippers and freight forwarders can remedy the situation, not where others are responsible. Collect performance information on the containerised transport chain Containerised transport will benefit from better information about its performance, notably by benchmarking the efficiency of the interfaces between the different actors in the logistic chain. Governments could adopt the comprehensive set of indicators developed by the International Transport Forum together with maritime transport stakeholders and collect relevant data to feed it. Secure the strategic value of container shipping Governments will need to clearly articulate their expectations for liner shipping and outline how to achieve them. Considering their substantial support to the shipping industry, governments are in a position to expect that shipping companies provide the strategic value that they are supposed to provide. Governments could make clear that their support hinged on the continued proof of this strategic value. Charge users of public maritime infrastructure more to increase cost coverage Cost coverage of public maritime infrastructure is currently low. In the European Union, carriers contribute only 4% of the cost of financing and maintaining infrastructure in ports and in inter-oceanic canals. 8 PERFORMANCE OF MARITIME LOGISTICS © OECD/ITF 2022
EXECUTIVE SUMMARY

Generally, carriers only pay a fraction of these costs and less than in all other transport modes. Ports also
cause considerable external costs (e.g. via air pollution from ships). For more efficient public policy
outcomes, governments should recover a larger share of infrastructure costs via fees and charges.

PERFORMANCE OF MARITIME LOGISTICS © OECD/ITF 2022                                                        9
PERFORMANCE OF CONTAINERISED MARITIME TRANSPORT

     Performance of containerised maritime transport

The performance of containerised transport can be described by four main criteria: price, reliability, speed
and direct liner connectivity. These criteria have evolved over recent years. The price of container
transport and transit times have increased, whereas reliability and connectivity have decreased.

The price of container shipping

Companies that want their goods to be moved – shippers – generally have two ways to directly procure
shipping services: via a contract with a container shipping company (a carrier) for a certain period, or on a
flexible, last-minute basis on the spot market. In the case of contracted shipping services, prices are
negotiated between the shipper and the carrier, and fixed for a certain period, often one or more years.
In the case of flexible, last-minute shipping services, prices are determined on what is called the spot
market, which fluctuates on a daily basis. The prices for last-minute shipping services are called spot rates.
Large shippers with predictable and steady containerised cargo flows engage in contracts with carriers,
whereas companies with low and unpredictable container volumes more frequently use the container spot
markets. Large shippers often use a combination of both methods: contracts for cargo that can be
guaranteed and spot markets for additional or incidental cargo flows. Alternatively, shippers can outsource
the procurement of shipping services to a logistics service provider or freight forwarder. Most small and
medium-sized enterprises use freight forwarders who consolidate shipments and negotiate contract rates
that they would likely not be able to acquire themselves.
The container shipping revenues are a mix of revenues from contract rates and spot rates. The advantage
of contract rates for container carriers is that it locks in future revenues if spot rates fall. Should the spot
rates rise, carriers will try to accommodate containers on the spot market as much as possible to increase
their revenues. Container shipping companies have different strategies as to the share of trade from
contract and spot markets. Unsurprisingly, the contract shares are different depending on the carrier,
maritime route and period. A variety of indexes monitor contract and spot rates, some of which will be
mentioned here.

Spot rate developments

The Drewry World Container Index is frequently used to assess the increases of container spot rates. It is
a composite of container freight rates on eight major routes to and from Asia, Europe and the
United States in USD per 40-foot container per week.
The Drewry World Container Index shows that spot rates at the end of 2021 (week 47) were approximately
six times higher than two years earlier. The Index started to rise in June 2020, first fairly gradually and then
more abruptly during November-December 2020 and between May 2021 and September 2021 (Figure 1).
Fluctuations in this index reflect the various price increases on different trade routes during different
periods (Drewry n.d.).

10                                                             PERFORMANCE OF MARITIME LOGISTICS © OECD/ITF 2022
PERFORMANCE OF CONTAINERISED MARITIME TRANSPORT
Asia-Europe spot rates rose by a factor 4.7 (Shanghai-Genoa) to 5.9 (Shanghai-Rotterdam) between the
first week of 2020 and the end of 2021, trans-Pacific rates (Shanghai-Los Angeles) by a factor 5.5 and
Transatlantic rates (Rotterdam-New York) by a factor 2.4 (Figure 2). The trans-Pacific rates were the first
to rise substantially. This increase started in June 2020 and reached a plateau by November 2020 that
lasted until May 2021. Over this same period, the Transatlantic rates remained more or less stable. The
Asia-Europe rates started to move up very quickly between November and December 2020, after which
they declined slightly until April 2021. From May 2021 onwards the spot rate developments on the two
main East-West routes (Asia-Europe and trans-Pacific) moved in parallel and showed a more or less similar
rapid upward swing until September 2021. The Transatlantic rate increase started at the same date (May
2021) but halted around July 2021 (Drewry n.d.).
Figure 1. Evolution of containerised spot rates, 2016-2022
12 000
Freight rate (USD per 40ft container)
10 000
8 000
6 000
4 000
2 000
0
2 3 4 1 2 3 4 1 2 3 4 1 2 3 4 1 2 3 4 1 2 3 4 1 2
2016 2017 2018 2019 2020 2021 2022
Year and quarter
Source: Drewry (n.d.).
PERFORMANCE OF MARITIME LOGISTICS © OECD/ITF 2022 11PERFORMANCE OF CONTAINERISED MARITIME TRANSPORT
Figure 2. Evolution of containerised spot rates by trade lane
16 000
Freight rate (USD per 40-foot container)
14 000
12 000
10 000
8 000
6 000
4 000
2 000
0
1 2 3 4 5 6 7 8 9 10 11 12 1 2 3 4 5 6 7 8 9 10 11 12 1 2 3 4 5 6
2020 2021 2022
Year and month
Shanghai-Los Angeles Shanghai-Rotterdam Shanghai-Genoa Rotterdam-New York
Source: Drewry (n.d.).
Contract rate developments
Contract rates are negotiated between shippers and carriers. For reasons of confidentiality, they are not
publicly available. What are available are container trade price indexes, as communicated by Container
Trade Statistics (CTS), the organisation that releases statistics derived from data supplied by major
container shipping lines. CTS Price Indexes are based on the weighted average of the sea-freight rates
including all surcharges and ancillary charges – with the exception of inland haulage. As such, the CTS Price
Index includes both contract and spot rates.
The CTS Price Index multiplied by a factor of 2.9 between January 2020 and January 2022 (Figure 3).
Similarly to the spot-rate developments, there is considerable variety between different trade routes, with
increases ranging between a factor of 1.5 and 5.4 for the main trade lanes (Table 1). The largest observed
increases took place on the Far East-Europe and Indian Subcontinent-Europe trades, whereas intra-Europe
and intra-US trades showed relatively limited increases (CTS, n.d.).
12 PERFORMANCE OF MARITIME LOGISTICS © OECD/ITF 2022PERFORMANCE OF CONTAINERISED MARITIME TRANSPORT
Figure 3. Container Trade Price Index (CTS), 2016-22
250
200
CTS Price Index
150
100
50
0
1 2 3 4 1 2 3 4 1 2 3 4 1 2 3 4 1 2 3 4 1 2 3 4 1 2
2016 2017 2018 2019 2020 2021 2022
Year and quarter
Source: Container Trade Statistics (n.d.).
Table 1. CTS Price Index developments for main trade lanes, 2020-22
Trade route Index value at Index value at Increase
January 2020 January 2022 (in %)
Far East-Europe 61 331 443%
Indian Subcontinent and Middle East-Europe 47 207 340%
Far East-South and Central America 57 244 328%
Intra Far East 81 268 231%
Far East-North America 89 293 229%
Europe-South and Central America 56 165 195%
Europe-North America 84 231 175%
Indian Subcontinent and Middle East-sub-Saharan Africa 62 167 169%
Intra-North America 83 150 81%
Intra-Europe 76 128 68%
North America-South and Central America 60 89 48%
Source: Container Trade Statistics (n.d.).
There is a clear link between spot rates and contract rates. Increases in spot rates generally lead to
increases in contract rates but with a certain time lag, as contract rates are fixed for a certain pre-
determined period. A comparison of the Shanghai Containerised Freight Index (SFCI), considered a proxy
for spot rates, with the CTS Price Index, considered a proxy for contract rates, shows that the price increase
in contract rates over 2020-21 occurred approximately a yearly quarter later than in spot rates. The price
developments of spot rate and CTS index followed a remarkably parallel pattern on the Asia-North America
PERFORMANCE OF MARITIME LOGISTICS © OECD/ITF 2022 13PERFORMANCE OF CONTAINERISED MARITIME TRANSPORT
trade route, whereas the spot-rate increases on the Asia-Europe trade route in 2021 were significantly
steeper than the increases of the CTS Price Index for that trade route (Figure 4). The differences between
the two trade routes could be explained by differences in long-term contract shares on these trade routes,
with Asia-Europe routes likely subject to more contracts than the Asia-North America route. The limited
time lag between spot rate and contract rate could indicate that the majority of contracts have very short
time spans or might suggest other phenomena.
Figure 4. Link between spot rates and contract rates on Asia-Europe and
Asia-North America routes, 2019-21
900
800
700
Freight rate development
600
500
400
300
200
100
0
1 2 3 4 1 2 3 4 1 2 3
2019 2020 2021
Year and quarter
Asia to Europe contact rate Asia to N America contract rate
Asia to Europe spot rate Asia to N America spot rate
Note: Index 2019 Q1 = 100. The Container Trade Statistics (CTS) Price index is used as a proxy for contract
rates. The Shanghai Containerised Freight Index (SCFI) is used as a proxy for container spot rates.
Source: CTS (n.d.), Shanghai Shipping Exchange (n.d.)
Several carriers have managed to use the current situation to increase their share of contract business. In
2021, Maersk managed to secure 64% of the long-haul volumes on long-term contracts compared to 50%
the year before (Maersk, 2021). COSCO is reported to have increased its contract share on the Asia-Europe
routes to 45% in 2022 (Alphaliner, 2021a). This rise in contract business implies that the current high
container transport prices are increasingly locked in, which means they will be sustained for at least
another year, regardless of the development of the spot rates.
Two carriers announced in September 2021 that they would freeze spot rates: CMA CGM until
February 2021 and Hapag Lloyd “for the time being” (Porter, 2021). Notably, this freeze does not apply to
contract rates, nor to surcharges that carriers apply in addition to spot or contract rates.
14 PERFORMANCE OF MARITIME LOGISTICS © OECD/ITF 2022PERFORMANCE OF CONTAINERISED MARITIME TRANSPORT
Surcharges
Container shipping companies regularly apply demurrage and detention surcharges. Demurrage charges
are applied when a container remains in the terminal beyond its allotted free days (e.g. because it has not
been picked up by a truck or ship). The idea of demurrage charges is to minimise the dwell time of
containers in terminals. Detention refers to the time outside the port. Detention charges are applied when
a container has been picked up in a terminal but not returned to the carrier in the allotted free time. The
purpose of the introduction of detention charges is to decrease the turnaround time of a container.
Information on demurrage and detention charges of carriers is not systematically collected. There is no
overview of these surcharges and their development over time. Some carriers provide this kind of
information on their websites, which makes it possible to assess the extent to which demurrage and
detention charges have increased since January 2020. Assessment of these data on surcharges applied by
the carrier Hapag Lloyd in EU countries shows that demurrage and detention charges in most EU countries
with seaports have increased substantially, and by more than 100% in Italy and Poland (Figure 5).
Figure 5. Changes in detention and demurrage charges for
container carriers since January 2020
Sweden
Slovenia
Romania
Poland
Netherlands
Malta
Italy
Germany
France
Finland
Croatia
Bulgaria
Belgium
-40% -20% 0% 20% 40% 60% 80% 100% 120% 140% 160%
Detention and Demurrage import Detention import Demurrage import
Detention and Demurrage export Detention export Demurrage export
Source: Based on data from Hapag Lloyd (n.d.).
PERFORMANCE OF MARITIME LOGISTICS © OECD/ITF 2022 15PERFORMANCE OF CONTAINERISED MARITIME TRANSPORT
Container shipping companies have applied additional charges since the Covid-19 crisis that are not
included in the spot or contract rates. An example is a congestion surcharge levied by several carriers
following the surge in container traffic to European ports (Knowler, 2021a). Another example is the
premium that shippers are reportedly expected to pay to get an assured booking, with carriers charging
premiums of up to USD 10 500 per container in addition to the regular rate (Knowler, 2021b). Carriers
have also charged shippers with peak season surcharges and equipment imbalance surcharges. It is difficult
to understand how such surcharges can be justified as covering additional costs for carriers, considering
that congestion and equipment imbalance are also contributing to the scarcity of cargo space that is driving
the increase in freight rates. Given the limited choice of carriers and the fact that most of them apply
similar surcharges, most container shippers have no choice but to accept the surcharges.
Reliability
The schedule reliability of container carriers has worsened considerably since the pandemic, according to
data from maritime consultancy firm Sea-Intelligence (2022). In February 2022, two out of three vessels
arrived with a delay of one calendar day compared to the official schedule. Put differently, the global
schedule reliability in that month was 34%, compared to average scores of 75% in the years prior to the
outbreak of Covid-19 (Figure 6). The global schedule reliability went up at the beginning of the Covid-19
crisis, from 65% in February 2020 to 78% in June 2020, but deteriorated thereafter, dropping to 35% in
January 2021. During the whole of 2021, schedule reliability improved slightly between March and June,
but decreased again to 33-34% in August 2021. (Sea-Intelligence, 2022)
Figure 6. Container shipping schedule reliability, 2018-22
90%
80%
70%
Schedule reliability
60%
50%
40%
30%
20%
10%
0%
1 2 3 4 1 2 3 4 1 2 3 4 1 2 3 4 1 2
2018 2019 2020 2021 2022
Year and quarter
Source: Sea-Intelligence (2022).
16 PERFORMANCE OF MARITIME LOGISTICS © OECD/ITF 2022PERFORMANCE OF CONTAINERISED MARITIME TRANSPORT
The average delays of late container ships rose during that period, from 4.9 days in January 2020 to
7.3 days in December 2021 (Figure 7). The improvement in global schedule reliability in the second quarter
of 2020 did not translate into shorter average delays of late vessels. A slight improvement in that respect
occurred during July-August 2020, followed by a continuous increase in average delay times until February
2021, reaching an average global delay of seven days. After some fluctuations, the average delay time of
late vessels reached 7.1 days in February 2022. (Sea-Intelligence, 2022)
Figure 7. Global average arrival delays for container ships, 2018-22
9
Average container ship delays (in days)
8
7
6
5
4
3
2
1
0
1 2 3 4 1 2 3 4 1 2 3 4 1 2 3 4 1 2
2018 2019 2020 2021 2022
Year and quarter
Source: Sea-Intelligence (2022).
During the Covid-19 crisis, the number of cancellations of scheduled port calls also increased. Figure 8
shows that actual port calls (as a share of the scheduled calls) started declining in the third quarter of 2019.
There was a temporary rise in the third quarter of 2020, when the number of actual calls reached 80% of
the scheduled calls. That percentage fell again, though, to 72% in the third quarter of 2021.
PERFORMANCE OF MARITIME LOGISTICS © OECD/ITF 2022 17PERFORMANCE OF CONTAINERISED MARITIME TRANSPORT
Figure 8. Actual calls per scheduled port calls, 2019-21
90%
Actual calls per scheudled port calls
85%
80%
75%
70%
65%
1 2 3 4 1 2 3 4 1 2 3 4
2019 2020 2021
Year and quarter
Source: MDS Transmodal (n.d.).
Speed
How quickly a container arrives at its destination depends on three different parts of the transport chain:
the time at sea, the time in port (which, in turn, is divided into the time at anchor before entering the port
and the time at berth in port) and the time in hinterland transport.
Time at sea
Ships’ average time at sea between ports has increased since 2019. Figure 9 shows that ships spent
5.7 days at sea in the first quarter of 2019, compared to 7.5 days in the third quarter of 2021. The peak
value – eight days – was reached in the third quarter of 2020.
This pattern of increased time at sea could be explained by two factors. First, average ship speed might
have gone down since 2019. Lower ship speeds might have been a way to reduce the effective ship
capacity during the Covid-19 lockdowns, as lower speed requires more ships to carry out the same weekly
service rotation. This is a way to use ships that would have otherwise been inactive during the drop in
demand for maritime transport. Second, it may also have been a strategy by carriers to reduce the number
of port calls per shipping service, an issue that will be explored in more depth in the section on direct liner
connectivity.
18 PERFORMANCE OF MARITIME LOGISTICS © OECD/ITF 2022PERFORMANCE OF CONTAINERISED MARITIME TRANSPORT
Figure 9. Evolution of time at sea between 2019 and 2021
9
Average number of days between two port calls
8
7
6
5
4
3
2
1
0
1 2 3 4 1 2 3 4 1 2 3
2019 2020 2021
Year and quarter
Source: MDS Transmodal (n.d.).
Time at anchor
The time at anchor for container ships has increased globally since the beginning of 2020, coinciding with
the economic lockdowns related to Covid-19 in the second quarter of 2020 and the associated drop in
maritime transport demand. Time at anchor tripled at the same time that the number of active container
ships declined from 4 725 to 4 542. Globally, time at anchor declined slightly after May 2020, but remained
at a structurally higher level than before the Covid-19 crisis. (MDS Transmodal, n.d.)
These higher times at anchor have frequently been interpreted as increased waiting times before entering
ports. This could be true in port regions that experienced surges in demand and port congestion due to
physical constraints, and to a lack of transport workers who were suffering from Covid-19. However, it may
also give testimony to the direct collation between time at anchor and the extent of idle container ships:
in case of cancelled services, ships are idled at anchor until services resume.
Changes in time at anchor have varied considerably in the different world regions. Time at anchor in
Chinese ports in October 2021 was seven times higher than in January 2019; in October 2021 time at
anchor was more than five times higher in US ports, but less than two times higher in European ports,
compared to January 2019. Since May 2020, the development of time at anchor in these three regions has
followed different patterns. The United States saw volatile movement in time at anchor, which fell sharply
after May 2020 to pre-Covid-19 levels, rose again in October that same year to peak in January 2021, only
to decline again until May 2021. After that, there was a steep rise in time at anchor that reached new
peaks in August and October 2021. In the People’s Republic of China, time at anchor remained more or
less at the level reached in May 2020, starting a continuous rise in May 2021 that reached a new peak in
PERFORMANCE OF MARITIME LOGISTICS © OECD/ITF 2022 19PERFORMANCE OF CONTAINERISED MARITIME TRANSPORT
August 2021, declining since then. In Europe, time at anchor has gone down since May 2020, subject to
fluctuations. (MDS Transmodal, n.d.)
The differences in time at anchor might be explained by the following factors. First, US ports generally
perform fewer transhipment functions than the main Chinese and European ports, leading to fewer
opportunities for idling ships due to service cancellations. Second, there is a link between time at anchor
and time in port. The increase in time in port has been very limited in European ports, which might have
resulted in the relatively limited increase of time at anchor, in contrast to US and Chinese ports.
Time in ports
The time that container ships spend in ports has increased since March 2020: in October 2021, the average
time in port was approximately 50% longer than in January 2019. There are various explanations for this.
Port terminals plan for the arrival of a ship by, for example, positioning containers in the yard in such a
way that the loading and unloading of the ship takes the least amount of time. As a result, the fewer the
ships that respect their announced arrival time, the more difficult terminal planning becomes, lowering
the terminal’s efficiency. The link between ship schedule reliability and port terminal congestion can turn
in a vicious circle whereby lower ship reliability leads to port congestion, leading to even lower ship
reliability. In various ports, Covid-19 affected port workers and protocols to minimise the spread of
Covid-19 slowed cargo handling operations. Some ports – none of them in Europe – were confronted with
closures.
Border closures also affected maritime trade flows and had a large impact on seafarers. They complicated
the process of crew changes, contributing to a large number of seafarers staying aboard ships much longer
than what is customary. Few governments facilitated crew changes effectively and the situation was not
helped by the decisions of market players, including shipping companies, registries, charterers and ports.
Figure 10. Time in port and time at anchorage in container ports globally, 2019-21
400 5 200 Number of active ships calling at ports
Time in port and at anchorage (index)
350 5 100
5 000
300
4 900
250 4 800
200 4 700
150 4 600
4 500
100
4 400
50 4 300
0 4 200
1 2 3 4 1 2 3 4 1 2 3 4
2019 2020 2021
Year and quarter
Number of active ships Time at anchorage Total time in port
Note: Index 2019 Q1 = 100
Source: Based on MDS Transmodal (n.d.).
20 PERFORMANCE OF MARITIME LOGISTICS © OECD/ITF 2022PERFORMANCE OF CONTAINERISED MARITIME TRANSPORT
Figure 11. Time in port and time at anchorage in United States container ports, 2019-21
700 800
Time in port and at anchorage (index)
Number of active ships calling at port
600 700
600
500
500
400
400
300
300
200
200
100 100
0 0
1 2 3 4 1 2 3 4 1 2 3 4
2019 2020 2021
Year and quarter
Number of active ships Time at anchorage Total time in port
Note: Index 2019 Q1 = 100
Source: Based on MDS Transmodal (n.d.).
Figure 12. Time in port and time at anchorage in Chinese container ports, 2019-21
800 2 000
Total time in port and at anchorage (index)
Number of active ships calling at port
700 1 800
1 600
600
1 400
500 1 200
400 1 000
300 800
600
200
400
100 200
0 0
1 2 3 4 1 2 3 4 1 2 3 4
2019 2020 2021
Year and quarter
Number of active ships Time at anchorage Total time in port
Note: Index 2019 Q1 = 100
Source: Based on MDS Transmodal (n.d.).
PERFORMANCE OF MARITIME LOGISTICS © OECD/ITF 2022 21PERFORMANCE OF CONTAINERISED MARITIME TRANSPORT
A ship’s time in port varies considerably among port regions. In China and the United States, the time in
port in October 2021 was twice as high as in January 2020, whereas port time in Europe over that same
period increased by less than 15% (Figure 13). The time in port in China consistently and gradually
increased since March 2020, whereas the development in US ports was subject to more fluctuations.
Another difference was the more significant decrease of active ships calling European ports since
March 2020, compared to US and Chinese ports, where the decrease was more moderate. (MDS
Transmodal n.d.)
Figure 13. Time in port and time at anchorage in European container ports, 2019-21
300 1 550
Time in port and at anchorage (index)
Number of active ships calling at port
250 1 500
1 450
200
1 400
150
1 350
100
1 300
50 1 250
0 1 200
1 2 3 4 1 2 3 4 1 2 3 4
2019 2020 2021
Year and quarter
Number of active ships Time at anchorage Total time in port
Note: Index 2019 Q1 = 100
Source: Based on MDS Transmodal (n.d.).
Time in hinterland transport
Limited information exists on time in hinterland transport modes (ie. transport modes in areas beyond
sea ports) or waiting time for hinterland transport modes in ports. Some ports collect such information
and provide these on a regular basis on their website, but this is generally rare. Unsurprisingly, there are
no publicly available data aggregated for port regions.
The data at the level of individual ports show certain patterns, but it is difficult to say if these are place-
specific or illustrative of a wider tendency. Data on average waiting times for inland barges – from the
barge company Contargo – in the ports of Antwerp and Rotterdam show a slight increase in waiting times,
but also many fluctuations, with peaks in March 2020, September 2021 and February 2022 (Figure 14).
22 PERFORMANCE OF MARITIME LOGISTICS © OECD/ITF 2022PERFORMANCE OF CONTAINERISED MARITIME TRANSPORT
Figure 14. Average waiting time for inland barges in the ports of Antwerp and Rotterdam, 2020-22
180
Average waiting time (in days)
160
140
120
100
80
60
40
20
0
1 2 3 4 1 2 3 4 1
2020 2021 2022
Year and quarter
Antwerp Rotterdam
Source: Contargo (n.d.).
Direct liner connectivity
Since the third quarter of 2020, shipping lines have been adjusting their networks, shifting capacity from
services serving more than two regions in favour of those serving only two. In doing so, shipping lines have
been reducing port calls, thus increasing the number of country pairs (countries that can be reached
directly – without transhipment – via container shipping from another country) without direct
connections. Based on capacity scheduled to be deployed in May 2022, this report estimates that the
number of countries directly connected has now reached its lowest level since the first quarter of 2006,
the start of the MDS Transmodal (n.d.) dataset. The deterioration in direct connectivity has only been
accelerated by the Covid-19 pandemic, as the downward trend was already occurring in 2019 (Figure 15).
PERFORMANCE OF MARITIME LOGISTICS © OECD/ITF 2022 23PERFORMANCE OF CONTAINERISED MARITIME TRANSPORT
Figure 15. Scheduled deployed capacity by regions served and number of direct connections, 2019-21
130
Scheduled deployed ship capacity
120
110
100
90
80
70
1 2 3 4 1 2 3 4 1 2 3 4 1 2
2019 2020 2021 2022
Year and quarter
Intra-region More than two regions
Two regions No of country pairs directly connected
Note: Index 2019 Q1 = 100
Source: MDS Transmodal (n.d.).
An assessment of the development of container shipping schedules shows that this direct liner connectivity
has decreased in particular in Latin America (where 35 countries were confronted with drops in direct
connections), in Europe (reductions for 26 countries) and sub-Saharan Africa (reductions for 26 countries).
France and Italy are among the countries with particularly large drops in direct connectivity. The region
that showed the lowest drop in direct liner connectivity was Australasia and Oceania (Figure 16).
Figure 16. Development of direct liner connectivity
from the second quarter of 2019 to the second quarter of 2022
35
Number of countries with direct
30 connections decreased by more than
Number of countries
50%
25
Number of countries with direct
20 connections decreased by less than 50%
15
10 Number of countries with same direct
connections
5
0 Number of countries with direct
connections increased by less than 50%
Number of countries with direct
connections increased by more than
50%
Source: MDS Transmodal.
24 PERFORMANCE OF MARITIME LOGISTICS © OECD/ITF 2022CAUSES AND EFFECTS OF MARITIME PERFORMANCE
Causes and effects of maritime performance
The maritime transport chain consists of many different, interconnected parts. It is not always easy to
distinguish between the causes and effects of certain phenomena. This section focuses on three possible
causes for the current situation in the containerised maritime transport chain: development in demand
for containerised transport, ship capacity management by carriers and port congestion.
Demand for containerised transport
The rapid increase in container freight rates could be explained by the combination of pent-up demand
during economic lockdowns and government fiscal stimulus policies at the start of the Covid-19 pandemic.
The combination of the two arguably created a situation of unprecedented demand for containerised
transport for which container shipping companies could not have prepared. However, when looking at the
actual container transport volumes and the utilisation rates of ships, this explanation does not hold.
The volume of containers transported by the major container shipping companies continues to increase
steadily, albeit with many seasonal fluctuations (including, for example, reductions at the time of the
Chinese New Year). The effect of the Covid-19 lockdowns shows up in a protracted slump in container
volumes during February-June 2020. Although volumes rebounded after June 2020, growth rates are in
line with trend growth (Figure 17).
Figure 17. Global container volumes transported per month, 2013-21
18
Twenty-foot equivalent units, millions
16
14
12
10
8
6
4
2
0
1 2 3 4 1 2 3 4 1 2 3 4 1 2 3 4 1 2 3 4 1 2 3 4 1 2 3 4 1 2 3 4 1 2 3 4
2013 2014 2015 2016 2017 2018 2019 2020 2021
Year and quarter
Source: Based on Container Trade Statistics (n.d.).
PERFORMANCE OF MARITIME LOGISTICS © OECD/ITF 2022 25CAUSES AND EFFECTS OF MARITIME PERFORMANCE
There is a remarkable difference between regions in the development of demand for containerised
transport. In the Far East and North America (Figures 18 and 19), there appears to have been a rebound
in demand for containerised goods in the second half of 2020 and the first half of 2021. However, the
volumes in container transport to and from Europe remained more or less flat, with the volumes in the
first eight months in 2021 almost the same as those in 2019 (Figure 20).
Figure 18. Container volumes transported to and from the Far East per month, 2019-21
18
Containers transported (million TEUs)
16
14
12
10
8
6
4
2
0
January February March April May June July August September October November December
2019 2020 2021
Note: TEU = twenty-foot equivalent unit
Source: Based on Container Trade Statistics (n.d.).
Figure 19. Container volumes transported to from North America per month, 2019-21
4.5
Containers trasnsported (million TEUs)
4.0
3.5
3.0
2.5
2.0
1.5
1.0
0.5
0.0
January February March April May June July August September October November December
2019 2020 2021
Note: TEU = twenty-foot equivalent unit
Source: Based on Container Trade Statistics (n.d.).
26 PERFORMANCE OF MARITIME LOGISTICS © OECD/ITF 2022CAUSES AND EFFECTS OF MARITIME PERFORMANCE
Figure 20. Freight container volumes transported to and from Europe per month, 2019-21
7
6
Containers transported
5
in million TEUs
4
3
2
1
0
January February March April May June July August September October November December
2019 2020 2021
Note: TEU = twenty-foot equivalent unit
Source: Based on Container Trade Statistics (n.d.).
The figures on containers transported could reflect a situation of unfulfilled demand: there might be
demand for container transport that cannot be serviced due to a lack of ship capacity. If this were the case,
it would normally show up in very high ship utilisation rates. However, utilisation rates are not extremely
high. On both the Far East-North America and Far East-Europe trades, the ship utilisation rate reached a
low during the first quarter 2020, after which it increased until the third quarter of 2020, followed by a
gradual decline of utilisation rates at around 70% for both trade routes at the time of the writing of this
report (figures 21 and 22). On the Far East-North America route, capacity has been growing at a faster rate
than demand since the third quarter of 2020.
PERFORMANCE OF MARITIME LOGISTICS © OECD/ITF 2022 27CAUSES AND EFFECTS OF MARITIME PERFORMANCE
Figure 21. Ship utilisation rate, Far East-North America, 2019-21
9 000 000 90%
8 000 000 80%
in twenty-foot equivalent units (TEU)
7 000 000 70%
Utilisation rates (in %)
Container volumes
6 000 000 60%
5 000 000 50%
4 000 000 40%
3 000 000 30%
2 000 000 20%
1 000 000 10%
0 0%
Q1 Q2 Q3 Q4 Q1 Q2 Q3 Q4 Q1 Q2
2019 2020 2021
Supply Demand Utilisation rate
Source: MDS Transmodal (n.d.).
Figure 22. Ship utilisation rate, Far East-Europe, 2019-21
7 000 000 90%
80%
in twenty-foot equivalent units (TEU)
6 000 000
70%
5 000 000
Utilisation rate (%)
Container volumes
60%
4 000 000 50%
3 000 000 40%
30%
2 000 000
20%
1 000 000
10%
0 0%
Q1 Q2 Q3 Q4 Q1 Q2 Q3 Q4 Q1 Q2
2019 2020 2021
Supply Demand Utilisation rate
Source: MDS Transmodal (n.d.).
28 PERFORMANCE OF MARITIME LOGISTICS © OECD/ITF 2022CAUSES AND EFFECTS OF MARITIME PERFORMANCE
Container shipping capacity
Container carriers have been able to adapt to the economic realities of the Covid-19 lockdowns via their
management of container ship capacity. More precisely: carriers collectively idled a considerable part of
their fleet during the economic lockdowns when demand for containerised maritime transport declined.
A large part of this took the form of cancelled services or cancelled port calls. At the peak of these
cancellations in June 2020, idle container ship capacity was at 12% of the total container ship fleet,
representing approximately 2.7 million twenty-foot equivalent units (TEU) in container ship capacity
(Figure 23). Idling capacity continued until September 2020, when most of the container ship capacity was
active again. The timing of this phasing in of active capacity is remarkable, considering that container spot
rates had already begun to increase in June 2020, reflecting a rebound in demand for containerised
transport. In a fully competitive market, such a strategy would not have been feasible, as there would
always be companies that would have provided more capacity or lower prices in order to gain
market share.
Figure 23. Idle container ship capacity in twenty-foot equivalent units (TEU), 2009-21
3 000 000
Idle containership capacity
2 500 000
(in TEUs)
2 000 000
1 500 000
1 000 000
500 000
-
1 2 3 4 1 2 3 4 1 2 3 4 1 2 3 4 1 2 3 4 1 2 3 4 1 2 3 4 1 2 3 4 1 2 3 4 1 2 3 4 1 2 3 4 123 4 12
2009 2010 2011 2012 2013 2014 2015 2016 2017 2018 2019 2020 2021
Year and quarter
Note: TEU = twenty-foot equivalent units
Source: Alphaliner (n.d.).
PERFORMANCE OF MARITIME LOGISTICS © OECD/ITF 2022 29CAUSES AND EFFECTS OF MARITIME PERFORMANCE
Figure 24. Scheduled and actually deployed capacity, 2019-21
115
Container ship capacity in TEUs (index)
110
105
100
95
90
85
1 2 3 4 1 2 3 4 1 2 3 4
2019 2020 2021
Year and quarter
Capacity actually deployed Scheduled capacity
Note: TEU = twenty-foot equivalent units
Source: MDS Transmodal (n.d.).
Container shipping companies attempted to accommodate the surge in demand for maritime transport in
in the second half of 2020 in the Far East and North America. However, they were constrained by their
decisions on capacity deployment prior to the crisis: whereas supply of deployed container ships
outstripped demand during 2010-17, the inverse was the case for 2017-20. During this period, compound
annual growth rates for container transport demand reached 3.5%, but only 2.3% for the supply of
deployed container ships (Figure 25). The scarcity of container ship capacity in the second half of 2020 was
born of the previous restraining of capacity since 2017. At the time of writing of this report, this scarcity is
projected to continue until at least 2024, with projected demand at around 3.2% – that is, higher than the
projected ship capacity (including ship orders, net of scrapping) estimated to be in the order of 2.5% over
2021-24.
Carriers reacted to the demand surge in the Far East and North America by shifting capacity to the trans-
Pacific trade from other routes, such as East-West round-the-world-services that touch Asia-Europe-North
America and Asia. As a result, a net shift of capacity from Asia-Europe to the trans-Pacific route occurred
in the second quarter of 2020. Asia-Europe capacity in the first quarter of 2021 was at a slightly lower level
than in the first quarter of 2020. This scarcity of capacity could have been one of the causes of the increase
in Asia-Europe freight rates (Figure 26). After the first quarter of 2021, Asia-Europe capacity increased.
30 PERFORMANCE OF MARITIME LOGISTICS © OECD/ITF 2022You can also read


