Operando Characterisation of Lithium-Sulfur Batteries - Diva ...
←
→
Page content transcription
If your browser does not render page correctly, please read the page content below
Digital Comprehensive Summaries of Uppsala Dissertations
 from the Faculty of Science and Technology 2075

 Operando Characterisation of
 Lithium–Sulfur Batteries

 YU-CHUAN CHIEN

 ACTA
UNIVERSITATIS
 UPSALIENSIS ISSN 1651-6214
 ISBN 978-91-513-1297-2
 UPPSALA URN urn:nbn:se:uu:diva-453442
 2021
Dissertation presented at Uppsala University to be publicly examined in Polhemsalen,
Ångströmlaboratoriet, Lägerhyddsvägen 1, Uppsala, Friday, 5 November 2021 at 09:15 for
the degree of Doctor of Philosophy. The examination will be conducted in English. Faculty
examiner: Professor Paul Shearing (University College London).

Abstract
Chien, Y.-C. 2021. Operando Characterisation of Lithium–Sulfur Batteries. Digital
Comprehensive Summaries of Uppsala Dissertations from the Faculty of Science and
Technology 2075. 63 pp. Uppsala: Acta Universitatis Upsaliensis. ISBN 978-91-513-1297-2.

Lithium–sulfur (Li–S) batteries have been under the spotlight of research on electrochemical
energy storage systems, primarily owing to their high theoretical specific energy (2552 Wh
kg-1). So far, Li–S cells on the market have presented a specific energy of 400 Wh kg-1, which
is superior to many commercial alternatives, but far below the theoretical value. At the same
time, Li–S batteries encounter other problems that are generally not associated with the standard
Li-ion batteries, such as low utilisation rate of active materials and short cycle life. These
often originate from the unique catholyte nature and/or the low reversibility of the metallic Li
electrode.
 The dissolution and precipitation of elemental sulfur and lithium sulfide in the positive
electrode are here investigated by operando X-ray diffraction (XRD) and small-angle neutron/X-
ray scattering (SANS/SAXS) coupled with the Intermittent Current Interruption (ICI) method.
The real-time internal and diffusion resistances are correlated to the kinetics of the precipitation
of the crystalline species by operando XRD. Through operando SANS and SAXS, the formation
of crystalline and amorphous solid-state discharge products and the compositional variation of
catholyte inside the mesopores are linked to features in the resistance profiles. These studies
indicate that the ionic transport limitation inside the positive electrode is the cause for the low
sulfur utilisation during battery discharge.
 To examine the impact of the repetitive precipitation on the functionality of the positive sulfur
electrode, a method based on electrochemical impedance spectroscopy (EIS) was developed
to track the electrochemically active surface area of the carbon matrix in-situ over extensive
cycling. The investigation found no progressive passivation on the positive electrode despite
the rapid decrease in specific discharge capacity. Additionally, a novel three-electrode setup for
Li–S cells reveals a faster growth of the resistance on the metallic Li electrode along cycling.
These findings suggest that primarily the negative electrode limits the cycle life.
 Through providing the mechanistic insights of operational Li–S cells, this thesis demonstrates
the value of simultaneous electrochemical and materials characterisations for understanding the
complex Li–S system.

Keywords: lithium–sulfur batteries, operando characterisation, intermittent current
interruption, X-ray diffraction, small-angle scattering, electrochemical impedance
spectroscopy

Yu-Chuan Chien, Department of Chemistry - Ångström, Structural Chemistry, Box 538,
Uppsala University, SE-751 21 Uppsala, Sweden.

© Yu-Chuan Chien 2021

ISSN 1651-6214
ISBN 978-91-513-1297-2
URN urn:nbn:se:uu:diva-453442 (http://urn.kb.se/resolve?urn=urn:nbn:se:uu:diva-453442)
To Ama and Agong
List of Papers

This thesis is based on the following papers, which are referred to in the text
by their Roman numerals.
 I. Chien, Y.-C., Menon, A. S., Brant, W. R., Brandell, D., Lacey,
 M. J. (2020) Simultaneous Monitoring of Crystalline Active Ma-
 terials and Resistance Evolution in Lithium–Sulfur Batteries.
 Journal of the American Chemical Society, 142(3):1449–1456
 II. Chien, Y.-C., Menon, A. S., Brant, W. R., Brandell, D., Lacey,
 M. J. (2021) Understanding the Impact of Precipitation Kinetics
 on the Electrochemical Performance of Lithium–Sulfur Batteries
 by Operando X-ray Diffraction. In manuscript.
 III. Chien, Y.-C., Lacey, M. J., Steinke, N.-J., Brandell, D., Rennie,
 A. R. (2021) Correlations between Precipitation Reactions and
 Electrochemical Performance of Lithium–Sulfur Batteries. Sub-
 mitted manuscript.
 IV. Li, H., Lampkin, J., Chien, Y.-C., Furness, L., Brandell, D.,
 Lacey, M.J., Garcia-Araez, N. (2021) Operando Characterization
 of Active Surface Area and Passivation Effects on Sulfur-Carbon
 Composites for Lithium-Sulfur Batteries. Submitted Manuscript.
 V. Chien, Y.-C., Brandell, D., Lacey, M. J. (2021) Towards Reliable
 Three-Electrode Cells for Lithium–Sulfur batteries. Submitted
 manuscript.

Reprints were made with permission from the respective publishers.

Disclaimer: Parts of this thesis are based on my licentiate thesis titled “Inves-
tigations of the performance-limiting factors in lithium-sulfur batteries” (Upp-
sala University, 2019).
My Contributions to the Papers

 I. I derived the theoretical foundation of the electrochemical method
 with my supervisors’ input, conceptualised, executed and analysed
 the experiments with co-authors’ assistance in the refinement of the
 diffraction data. I wrote the manuscript with input from co-authors.
 II. I conceptualised, executed and analysed the experiments with co-
 authors’ assistance in the refinement of the diffraction data. I wrote
 the manuscript with input from co-authors.
 III. I conceptualised, executed and analysed the experiments with co-
 authors’ assistance in the execution and interpretation of small-an-
 gle scattering data. I wrote the manuscript with input from co-au-
 thors.
 IV. I fabricated the optimised electrodes, conducted the operando
 measurements and participated in the data analysis. I participated
 in writing the manuscript.
 V. I conceptualised, executed and analysed the experiments. I wrote
 the manuscript with input from co-authors.
Papers not Included in the Thesis

 I. Chien, Y.-C., Pan, R., Lee, M.-T., Nyholm, L., Brandell, D., Lacey,
 M. J. (2019) Cellulose Separators With Integrated Carbon Nano-
 tube Interlayers for Lithium-Sulfur Batteries: An Investigation into
 the Complex Interplay between Cell Components. Journal of the
 Electrochemical Society, 166(14):A3235–A3241
 II. Hernández, G., Naylor, A. J., Chien, Y.-C., Brandell, D., Min-
 demark, J., Edström, K. (2020) ACS Sustainable Chemistry & En-
 gineering, 8(27):10041–10052
 III. Chien, Y.-C., Jang, H., Brandell, D. and Lacey, M. J. (2021)
 Poly(Ethylene Glycol-block-2-Ethyl-2-Oxazoline) as Cathode
 Binder in Lithium-Sulfur Batteries. ChemistryOpen, in press.
Contents

1 Introduction ......................................................................................... 13
 1.1 Electrochemical Energy Storage ..................................................... 13
 1.1.1 Rechargeable Batteries .......................................................... 14
 1.1.2 Lithium-ion Batteries ............................................................. 14
 1.2 Lithium–Sulfur Batteries................................................................. 15
 1.2.1 Cathode and Catholyte ........................................................... 15
 1.2.2 Anode and Catholyte ............................................................. 18
2 Scope of the Thesis .............................................................................. 20
3 Experimental Methods ......................................................................... 22
 3.1 Sample Preparation ......................................................................... 22
 3.1.1 Preparation of Sulfur/Carbon Composite Electrodes ............. 22
 3.1.2 Two- and Three-electrode Electrochemical Cells .................. 22
 3.1.3 Electrochemical Cell Designs for Operando Measurements . 23
 3.2 Characterisation Techniques ........................................................... 24
 3.2.1 Intermittent Current Interruption Method .............................. 24
 3.2.2 Electrochemical Impedance Spectroscopy ............................ 26
 3.2.3 X-ray Diffraction/Wide-angle X-ray Scattering .................... 27
 3.2.4 Small-angle X-ray and Neutron Scattering ............................ 28
4 Results and Discussions ....................................................................... 29
 4.1 Illustration of a Discharging Positive Electrode ............................. 29
 4.1.1 Precipitation and Energy Loss Processes ............................... 29
 4.1.2 From Cell Parameters to Electrochemical Performance ........ 33
 4.1.3 Dissolved, Crystalline and Amorphous Sulfur Species ......... 39
 4.2 Investigations into the Cycle Life Limitations ................................ 45
 4.2.1 Electrochemically Active Surface Area over Cycling ........... 45
 4.2.2 Resistance Distribution and Its Evolution.............................. 49
5 Conclusions ......................................................................................... 53
6 Sammanfattning på svenska ................................................................ 55
7 Acknowledgements.............................................................................. 57
8 References ........................................................................................... 58
Abbreviations

BET Brunauer–Emmett–Teller theory/method
CCC Carbon nanotube-coated cellulose
CE Counter electrode
CNF Carbon nanofiber
CNT Carbon nanotube
CPE Constant phase element
DME 1,2-dimethyloxyethane
DOL 1,3-dioxolane
ECM Equivalent circuit model
EIS Electrochemical impedance spectroscopy
E/S Electrolyte-to-sulfur (ratio)
FWHM Full-width at half-maximum
gS Mass of sulfur in grams
ICI Intermittent current interruption (method)
KB Ketjenblack®
LiFSI Lithium bis(fluorosulfonyl)imide
LiTFSI Lithium bis(trifluoromethanesulfonyl)imide
OCV Open-circuit voltage
PEO Poly(ethylene oxide)
PVP Poly(vinylpyrrolidone)
RE Reference electrode
SAS Small-angle scattering
SANS Small-angle neutron scattering
SAXS Small-angle X-ray scattering
SEI Solid electrolyte interphase
SEM Scanning electron microscopy
SLD Scattering length density
SoC State of charge
SoD State of discharge
SSA Specific surface area
WAXS Wide-angle X-ray scattering
WE Working electrode
XRD X-ray diffraction
1 Introduction

1.1 Electrochemical Energy Storage1,2
Electrochemical energy storage systems operate by guiding the electron in-
volved in a pair of reduction and oxidation reactions through an electric cir-
cuit, where the electric current can do work when the redox reaction is spon-
taneous. This process of harnessing the free energy of redox reactions is
termed discharge. By the sign convention, the electrode where reduction takes
place, and thus the electrons flow into, is the positive electrode. The other
electrode is the negative electrode by the same rationale. The substances going
through these redox reactions in the electrodes are the active materials. The
redox reaction is spontaneous because the active material at the positive elec-
trode has a higher potential to reduce than that on the negative electrode. The
difference in the reduction potentials gives rise to the electromotive force (E),
which can be related to the Gibbs free energy (∆G) of the redox reaction by

 ∆ = (1.1)

where n is the number of moles of electrons transferred in the reaction and F
is the amount of charge carried by one mole of electrons, i.e. the Faraday con-
stant. In an electrochemical energy source, the electromotive force is meas-
ured by the open-circuit voltage (OCV), which is the potential difference be-
tween the positive and negative electrodes when no current is present.
 To sustain the electric current, the charge difference caused by the move-
ment of electrons has to be balanced out. This is achieved by the ions in the
electrolyte. The electrolyte is an electron-insulating but ion-conducting me-
dium between the two electrodes, which is usually a liquid with high ionic
conductivity. As an electron moves out of the negative electrode, a positive
charge is left behind in the oxidized active material, whether it stays in the
electrode or dissolves in the electrolyte. This excess positive charge has to be
compensated either by an anion moving towards this electrode or a cation
leaving it. Due to the size difference, the ionic conductivity of the electrolyte
is usually much lower than the electronic conductivity of the electric circuit.
 Depending on where the active materials are stored, electrochemical energy
storage devices can be categorized as batteries or fuel cells. In a fuel cell, the
active materials are constantly replenished, used and exhausted, as its name

 13
suggests, whereas in a battery, the active materials are embedded and sealed
inside the cell.

1.1.1 Rechargeable Batteries2,3
Batteries discharge by spontaneous reduction at the positive electrode and ox-
idation at the negative electrode. The positive and negative electrodes are
therefore also named as the cathode and anode, respectively. For a rechargea-
ble battery, the process can be reversed by supplying electric current in the
opposite direction, which results in oxidation at the positive electrode and re-
duction at the negative electrode, also known as charging. The electrical en-
ergy is then stored chemically in a rechargeable battery.
 Besides the two electrodes and the electrolyte, a modern battery usually
consists of a separator to minimize the required distance between the elec-
trodes. The separator is a porous insulating membrane, whose pores are filled
with liquid electrolyte in a battery. The two electrodes with this combination
in between can be stacked together densely without being short-circuited. This
configuration not only enhances the energy density of the battery system but
also minimizes the energy dissipated by the solution resistance of the electro-
lyte.
 Battery systems are usually named after their components. For example:
lead-acid batteries, nickel metal hydride batteries, lithium-ion batteries. The
following subchapter will introduce the working principles of lithium-ion bat-
teries as the current dominant technology.

1.1.2 Lithium-ion Batteries3
Lithium-ion batteries are a set of battery systems that utilize Li ions as the
charge carriers but does not apply metallic Li as the negative electrode. This
distinction from Li batteries (or Li-metal batteries) was deliberately made in
the 1980’s due to the safety issue related to the Li metal anode. Metallic Li
has several advantages as an anode material, e.g. low reduction potential and
high specific capacity. However, it also has one problem that made it imprac-
tical in these early days of Li-battery development, which is still not really
solved to date: inhomogeneous Li deposition. The most dangerous impact of
dendritic growth of Li is that it can short-circuit the cell by penetrating the
separator. Therefore, researchers circumvented the use of metallic Li by pair-
ing graphite, as the negative electrode, with layered lithium metal oxides as
the positive electrode. Both active materials are categorized as intercalation
materials, which means that Li ions are inserted into the layered atomic struc-
ture of the material during the redox reaction while the layered structure re-
mains topologically the same. This setup sacrifices the specific energy but still
benefits from the high charge-to-mass ratio of Li ions and enhances safety
substantially. Thus, Li-ion batteries were successfully commercialized in

14
1990’s and has until now been the rechargeable battery system with the high-
est energy density on the market.

1.2 Lithium–Sulfur Batteries
The quest for more efficient battery technology did not stop after the commer-
cialization of Li-ion batteries. Despite the safety concerns discussed above,
the metallic Li anode is still regarded as one of the promising solutions to push
the specific energy density of commercial batteries beyond its current values.
To match the high specific capacity of Li, 3860 mAh g-1,3 sulfur is considered
a candidate for the positive electrode material due to its high specific capacity
among cathode materials, 1672 mAh g-1.4 Additionally, sulfur is non-toxic and
abundant in the earth’s crust.5,6 In an ideally balanced cell with complete uti-
lisation of both active materials, a Li–S battery has a theoretical specific en-
ergy of 2552 Wh kg-1 on the materials level based on the following reaction.4

 2Li + S → Li2S (1.2)

The overall reaction above is made up of the following half-reactions taking
place at the positive and negative electrodes, respectively.

 S + 2Li+ + 2e- → Li2S (1.3)

 Li → Li+ + e- (1.4)

On the cell level, a specific energy of 400 Wh kg-1 has been demonstrated
commercially.7–9 This performance is superior to that of the current Li-ion bat-
teries on the market but still falls behind the theoretical value of the Li–S sys-
tem by a factor of six, which is high if we consider the practical specific energy
of Li-ion batteries only lags its theoretical value by a factor of three. Moreo-
ver, the short cycle life of the Li–S cells also hinders their wider applica-
tion.10,11 These issues can be attributed to several challenges that the develop-
ment of the Li–S technology is facing, which will be discussed below with the
introduction to the corresponding cell components.

1.2.1 Cathode and Catholyte
Due to the low electronic conductivity of sulfur, 5∙10-30 S cm-1,5 a conductive
matrix is required to facilitate the electrochemical reactions. A wide variety
of conductive materials have been investigated in literature,6,12,13 among which
carbonaceous materials constitute the majority due to their high conductivity,
low density and versatility. To form a mechanically robust electrode with the

 15
above-mentioned powder materials, one or more polymers are used as bind-
ers.14–16 Various fractions of sulfur can be found in the published works with
the majority ranging from 50 % to 70 % by weight.17 Due to the relatively high
composition of the carbonaceous materials and their important role, the posi-
tive electrodes are often referred to as sulfur/carbon (S/C) composite elec-
trodes.
The working mechanism of a cathode in Li–S batteries is substantially differ-
ent from that in Li-ion batteries. The difference originates from the interme-
diate states between the charged state, elemental sulfur, and the discharged
state, lithium sulfide (Li2S).4 As sulfur is discharged in commonly used ether-
based electrolyte, lithium polysulfides (Li2Sx, x = 2–8) are formed first, before
they are eventually reduced to Li2S.18,19 These polysulfides are soluble to var-
ious extents in liquid electrolyte while sulfur and Li2S are not.20–22 Thus, in-
stead of staying in the solid state like a common cathode material of Li-ion
batteries, sulfur species go through dissolution and precipitation during the
course of discharge or charge. In other words, it is a catholyte system at most
states of charge (SoC) levels.
A typical potential profile of an S/C composite electrode consists of two plat-
eaus, which are more distinct upon discharge and closer to each other upon
charging, as shown in Figure 1.1. The assignment of redox reactions to the
potential plateaus are still being discussed since the exact reaction mechanism
is still under investigation. Nonetheless, it is widely accepted to associate the
upper plateau (~2.35 V vs Li/Li+) with the conversion of elemental sulfur to
the long-chained polysulfides (Li2Sx, x = 6–8) and the lower one (~2.1 V vs
Li/Li+) with that of the short-chained polysulfides (Li2Sx, x = 2–4) to Li2S.23,24

Figure 1.1. Schematic illustration of a Li–S cell (left) and a typical potential profile of
an S/C composite electrode (right), where E is the potential and Q is the specific ca-
pacity based on the mass of sulfur in grams (gS-1).

16
Given the solubility of the reaction intermediates in the electrolyte, it is not
difficult to imagine that the active material of the positive electrode can diffuse
to the other side of the separator and react with the negative electrode without
contributing any current to the external circuit. Moreover, the reduced poly-
sulfides may diffuse back to the positive electrode and be oxidized if the cell
is charging.25 This loop of redox reactions is commonly referred to as “poly-
sulfide shuttle. It can be inferred from the above description of the polysulfide
shuttle that its consequences are self-discharge and low Coulombic effi-
ciency.25 Due to the faster kinetics of the reduction of the long-chained poly-
sulfides, the redox shuttle occurs to a larger extent at the upper potential plat-
eau.26,27 Thus, it can often be identified by a prolonged upper charging plateau
on the potential profile.25
 Another challenge facing the positive electrode is the explanation for the
low sulfur utilisation. Despite the high theoretical specific capacity of sulfur,
only around 1000 mAh g-1 is reported in the majority of the current litera-
ture,6,28 which means only around 60% utilisation of the active material. This
discrepancy is a roadblock to the development of the Li–S technology since
there is already a considerable fraction of conductive carbon materials in the
positive electrode, which do not contribute to the capacity of the electrode.
 The final step of the discharge process, which involves the precipitation of
Li2S, has been extensively investigated to identify the reason for low sulfur
utilisation.29–37 Early studies proposed that a dense two-dimensional film of
Li2S is formed on the surface of the carbon matrix, which eventually passiv-
ates the electrode, and prevents further reduction of sulfur.37,38 However, re-
cent reports have shown that porous Li2S particles can also precipitate under
certain conditions, which do not cover the entire surface of the electrode. 32,39
Thus, instead of electrode passivation, the diffusion of polysulfides has been
suggested to be the reason for low sulfur utiliation.32 These conflicting claims
demonstrate that the complex discharge process in the positive electrode is yet
fully understood. A series of investigations of the discharge processes inside
the positive electrode will be presented in chapter 4.1.
 Following the hypothesis of the Li2S passivation at the end of discharge, a
frequently proposed reason for the capacity fade of Li–S cells is the drop in
the electrochemically active surface area due to the irreversible coverage of
an insulating layer on the carbon matrix.40,41 Longer cycle life was reported
for cells with a cycling protocol that avoids the formation of Li2S. Similar to
the disagreement about the end of discharge, contradictory reports can also be
found in the literature, where cells achieved longer cycle life by avoiding the
upper plateaus.42 Nevertheless, the missing information in these works is the
quantification of the surface area of the carbon matrix. In chapter 4.2.1, a
method based on electrochemical impedance spectroscopy (EIS) will be intro-
duced to track the surface area along with the cycle number.

 17
1.2.2 Anode and Catholyte
As mentioned in previously, metallic Li is the ideal material for the negative
electrode in Li-ion-based batteries for the reason of its high specific capacity
and low reduction potential. However, the safety risk brought by the dendritic
growth of Li is a roadblock yet to be removed, at least not in liquid electro-
lyte.43 In addition to the uneven deposition, inhomogeneous dissolution is also
a problem with the metallic Li electrode since it results in Li domains electri-
cally disconnected from the bulk. This so-called “dead Li” becomes inactive
and does not participate in the redox reaction anymore, which means a perma-
nent loss of capacity.44
 Metallic Li electrodes face further challenge in Li–S batteries due to the
catholyte nature of the sulfur electrode. As discussed above, the soluble poly-
sulfides can diffuse between the positive and negative electrodes and go
through repeated redox reactions, which waste the stored charge in the battery.
For Li-ion batteries, an ideal SEI is expected to be both electronically insulat-
ing to stop further electrolyte decomposition and Li-ion conductive to main-
tain the redox reactions at the anode.2 For Li–S cells, the SEI has one more
mission—shielding Li from the polysulfide shuttle.43

 The addition of lithium nitrate (LiNO3) as a co-salt in the electrolyte was
found to facilitate the formation of a protective SEI on Li to reduce the poly-
sulfide shuttle.45,46 It was concluded from surface analyses of Li that LiNO3 is
reduced by Li to LixNOy, which in turn oxidizes the sulfur species on Li.45,47
The oxidized sulfur species are effective to the passivation of Li because they
are stable components of the SEI, contrary to the reduced sulfur species.26,48
As introduced above, most of the reduced sulfur species, the lithium polysul-
fides, are soluble in the electrolyte. The insoluble Li2S can easily be oxidized
into polysulfides by disproportionation with the polysulfides in the catho-
lyte.45 This means the SEI on the metallic Li in a Li–S cell is much less robust
than that in a cell where the Li metal negative electrode is paired with a “stand-
ard” positive electrode, e.g. a Li+ insertion material.
 Nevertheless, it has been demonstrated that LiNO3 is continuously con-
sumed in a Li–S cell,46 which means that the above-mentioned benefits are
temporary. As the passivation on the surface of Li deteriorates, more electro-
lyte is gradually decomposed.45 This is corroborated by the strong dependence
of a Li–S cell’s cycle life on the electrolyte volume.9,49,50 It is thus reasonable
to infer that metallic Li electrode may not always act as a non-limiting counter
electrode (CE) even when used in excessive dimensions. However, it is a com-
mon practice in the literature to investigate S/C composite electrodes in two-
electrode “half-cells” with a Li CE. The cell performance of such two-elec-
trode cells is often interpreted as the performance of the working electrode
(WE), which is the S/C composite electrode in this case. Hence, it is critical

18
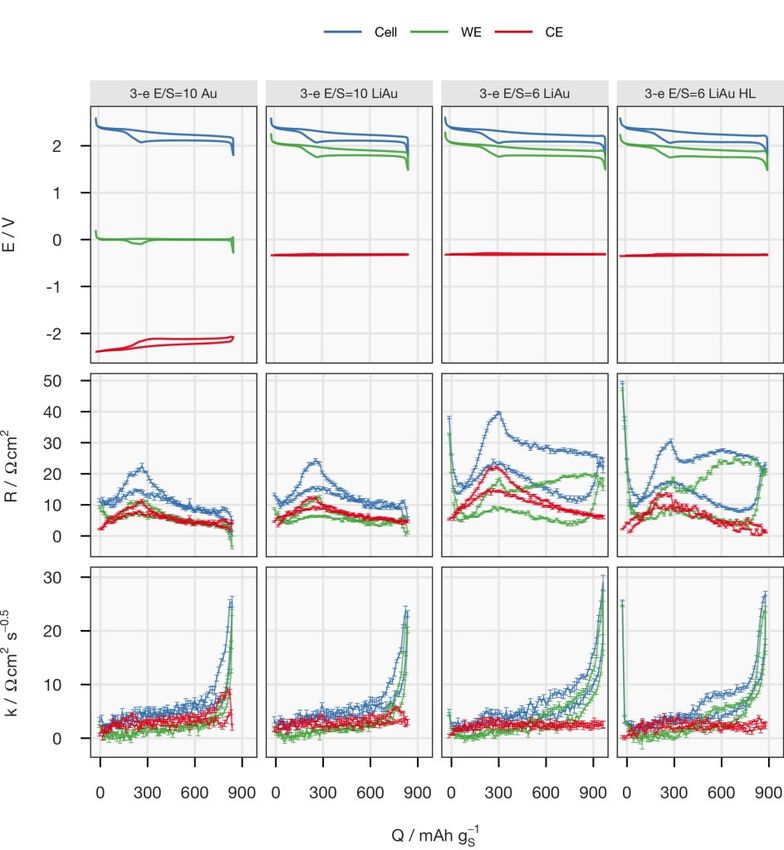
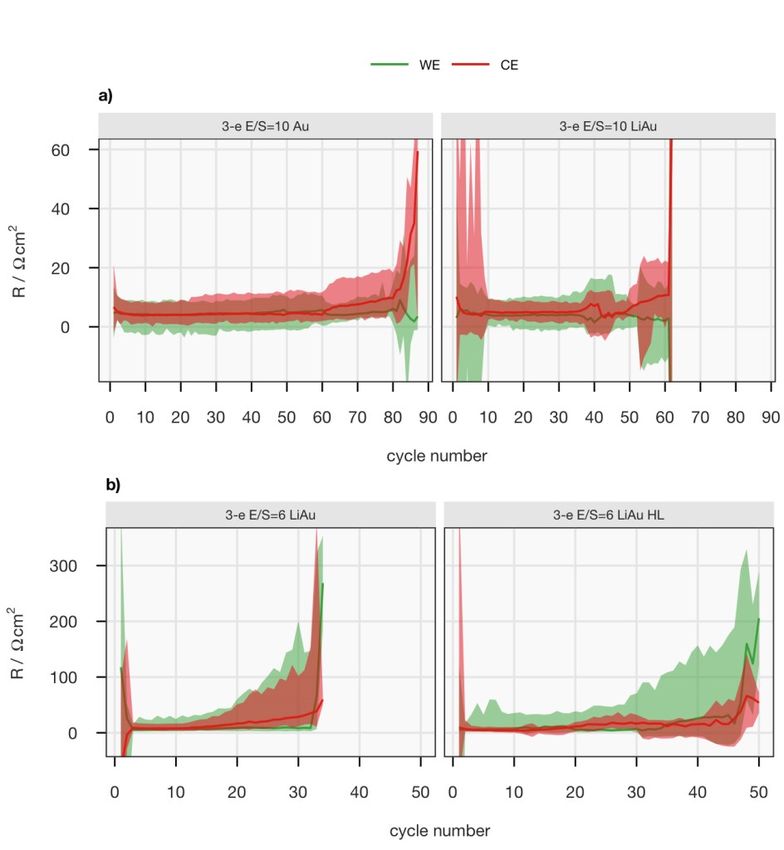
to quantify the impact of the Li CE on the overall cell properties. To distin-
guish the electrochemical responses from WE and CE, a reference electrode
(RE) needs to be introduced. In chapter 4.2.2, a simple three-electrode setup
for the Li–S system will be proposed. With the Intermittent Current Interrup-
tion (ICI) method, the resistance contributions from both the positive and neg-
ative electrodes will be tracked at all SoC over the entire cycle life.

 19
2 Scope of the Thesis

This thesis studied Li–S batteries during their operation in order to elucidate
the complex and changeable system. The ‘operando’ characterisations did not
only involve simultaneous materials characterisations, such as X-ray and neu-
tron scattering, but also real-time electrochemical characterisations, such as
resistance and specific surface area determinations, which were performed
while a Li–S cell was in operation. Two research questions were raised: What
mechanisms limits the discharge capacity of these cells? And what limits their
cycle life?
 To investigate the reason for the discrepancy between the practical and the-
oretical capacities of the positive electrode, an experimental framework com-
bining operando X-ray diffraction (XRD) and the Intermittent Current Inter-
ruption (ICI) method was developed in Paper I, which renders the internal
and diffusion resistances. The evolution of the diffraction signal and the
transport properties were correlated directly to study the precipitation and dis-
solution processes of Li2S. The advantage of the combination was further
demonstrated in Paper II, where a series of operando XRD measurements
were carried out to evaluate the effects of several cell parameters on the pre-
cipitation of Li2S. This investigation aimed at providing the mechanistic ex-
planations for the strong dependence of the electrochemical properties of Li–
S cells on these parameters. Subsequently, the methodology was further de-
veloped for small-angle neutron and X-ray scattering, which captured the evo-
lution of the catholyte and amorphous discharge products, in addition to the
crystalline Li2S, in Paper III. The results indicated that a decrease in Li+ con-
centration in the catholyte inside the carbon matrix terminated the discharge
process.
 In search of the limiting factor of the cycle life, the previously proposed
hypothesis of irreversible passivation of the carbon matrix in the positive elec-
trode was tested in Paper IV. An EIS-based technique was developed for in-
situ determination of the electrochemically active surface area, which indi-
cated that the decrease in discharge capacity is not correlated with the decrease
of electrode surface area. Lastly in Paper V, long-term cycling data of three-
electrode Li–S cells were reported. The resistance contributions from the pos-
itive and negative electrodes of an operational cell could thereby be measured

20
separately. The faster growth rate of the resistance of the metallic lithium elec-
trode suggested that electrolyte decomposition and/or the irreversibility of
lithium metal were the limiting factors for the cycle life.

 21
3 Experimental Methods

3.1 Sample Preparation
The specifications of the materials used are listed in the corresponding articles.

3.1.1 Preparation of Sulfur/Carbon Composite Electrodes
The positive electrode was produced by following a previously optimized rec-
ipe for S/C composite electrode,51 where the sulfur content is 65% and the
porous carbon matrix is Ketjenblack (KB). First, sulfur was mixed with KB in
a mortar and heated to 155 °C for 20 minutes. Together with the other com-
ponents, the S-impregnated KB was ball-milled with ethanol or isopropanol
solution in deionized water. The slurry was cast onto a carbon-coated alumin-
ium foil, and then cut into 13-mm-diameter discs.

3.1.2 Two- and Three-electrode Electrochemical Cells
Unless specified otherwise, the two-electrode electrochemical cells in this the-
sis were made with R2025-format coin cells. Coin cells were chosen to avoid
the uncertainty of electrolyte amount resulting from the vacuum sealing pro-
cess for pouch cells. In contrast to Li-ion batteries, the electrolyte-to-sulfur
(E/S) ratio strongly affects the performance of a Li–S cell.49,52 Moreover, due
to the high specific capacity of both sulfur and lithium, the weight of electro-
lyte can easily dominate the overall specific energy.17,53 Another important
parameter is the sulfur-loading,51,54 which is defined as the mass of sulfur per
electrode area here. Due to the constant sulfur content in this work (65%), the
sulfur-loading is proportional to the thickness of the electrode.
 Several three-electrode cells were employed in this thesis. In Paper I, a
three-electrode cell with a 16-mm-diameter Li metal disc as the reference elec-
trode was built with a homemade Swagelok® T-cell, as displayed schemati-
cally in Figure 3.2. In Paper V, a more robust three-electrode design was de-
veloped for long-term measurements. By inserting a polyimide-wrapped gold
microwire, minimal adjustment and thus minimal disturbance is introduced to
the commercial coin cell, as sketched in Figure 3.3.

22
Figure 3.1. Scheme of the components of a conventional coin cell

Figure 3.2. Scheme of the homemade three-electrode Swagelok® T-cell

Figure 3.3. Scheme of the homemade three-electrode coin cell

3.1.3 Electrochemical Cell Designs for Operando
 Measurements
A scheme of the modified coin cell can be found in Figure 3.4. 7-mm holes
were drilled on both the stainless steel cap and can to avoid its high X-ray
absorption. The holes were sealed by polyimide tape on both sides in Paper
I, which was replaced by aluminium-coated polyimide in Paper II Similar
cell designs were also used in the Paper III with only adjustments on the

 23
sealing material. Beryllium discs were used in place of the spacer owing to its
low X-ray absorption, rigidity to maintain a homogeneous stack pressure and
high electronic conductivity to establish a uniform current distribution. The
influence of the stack pressure and current distribution on the reactivity of the
electrode has been demonstrated computationally and experimentally.55 The
limitation of this cell design is the oxidation of beryllium at 4.2 V vs. Li/Li+,56
which is far above the maximum potential in the electrochemical tests carried
out in this work (2.6 V vs Li/Li+).

Figure 3.4. Scheme of the modified coin cell for operando X-ray-based measurements.

The modified cell for the neutron-based experiments share a design that is
similar to the above one. However, the windows are not made to increase the
transmission but to avoid the irregular scattering from the fine grains of stain-
less steel, which can vary substantially from sample to sample. In addition,
the cells have to be transported to the beamline at Institut Laue-Langevin in
France. Therefore, the sealing of the cells was made thicker.

3.2 Characterisation Techniques
3.2.1 Intermittent Current Interruption Method
The electrochemical cells in this work were mostly cycled at a constant current
but with periodic transient current pauses; a one-second pause every five
minutes. From the potential response to a current pause, resistance information
is derived. This technique of resistance measurement is termed the Intermit-
tent Current Interruption (ICI) method.49,57,58 The applied current is often la-
belled as the C-rate, where 1C equals 1672 mA gS-1.
 Based on the porous electrode model proposed by de Levie,59 it is derived
in the supporting information of Paper I that the potential change (∆E) during
a current interruption can be expressed as the following function of step time
(t, defined as the time passed after the current is switched off). The mathemat-
ical relationship is shown in (3.1), where I is the current before the interrup-
tion, R´ and C are the solution resistance and double-layer capacitance per unit
length inside the pore, respectively.

24
4 ′
 ∆ ( ) = ∆ (0) − √ √ (3.1)

During the data analysis, a linear regression of the potential against the square
root of the step time is performed for each current interruption, as illustrated
in Figure 3.4. The intercept is the time-independent part of the potential
change (∆E(0)), which can be divided by the current to obtain the internal
resistance (R).

 ∆ (0)
 =− (3.2)

The diffusion resistance coefficient (k) is acquired by dividing slope of the
regression line by the current.

 1 ∆
 = − ∙ (3.3)
 0.5

By comparing (3.1), (3.3) and the mathematical expression of a Warburg ele-
ment used in the analysis of impedance spectra, as demonstrated in the sup-
porting information of Paper I, k can be derived to be proportional to the
Warburg coefficient (σ), which will be introduced in the next chapter.

 4 ′ 8
 =√ = √ (3.4)

Figure 3.4. Example of the ICI analysis of a current interruption experiment. Data
points and the regression line are plotted in red and blue, respectively. ∆E and t are
the potential change and the step time as the current is switched off.

 25
3.2.2 Electrochemical Impedance Spectroscopy1
The electrochemical impedance spectroscopy (EIS) is an alternating current
(AC) technique, which resolves the energy loss processes with different time
constants in an electrochemical system. In this work, the EIS is carried out by
enforcing sinusoidal potential E perturbation with a small amplitude |E| on the
cell.

 = | | (3.5)

where j is the imaginary number, ω is the angular frequency and t is time. The
current response follows the general expression:

 = | | ( + ) (3.6)

where θ is the phase shift between the current and the potential. By applying
Ohm’s law, the impedance Z, which is analogous to the resistance under direct
current (DC), can be obtained.

 = = | | − (3.7)

 | |
 ℎ | | =
 | |

Z can also be expressed in its real and imaginary parts.

 = ′ − ′′ (3.8)

 ℎ ′ = | | cos ′′ = | | sin

This procedure is repeated at various frequencies of interest, so a spectrum of
impedance is obtained and usually presented on a Nyquist plot, where -Z´´ is
plotted against Z´. Equivalent circuit models (ECM) are used to analyse the
impedance spectra. Two of the basic elements are a resistor with a resistance
of R and a capacitor with a capacitance of C, whose impedance ZR and ZC
contains only real and imaginary parts, respectively.

 = (3.9)

 1
 = (3.10)

26
It is intuitive to visualise that ZR is a point on the Z´-axis and ZC is a line
overlapping the Z´´-axis. To fit the spectrum of an electrochemical system,
many or even infinite combinations of resistors and capacitors with different
resistance and capacitance, respectively, are used in series or in parallel. Com-
monly adopted complicated combinations can be found as individual elements
in the literature, such as the infinite Warburg element, which is used to de-
scribe diffusion processes and the retarded electrochemical double-layer ca-
pacitance in a porous electrode.59 Its impedance ZW can be expressed as:

 = −0.5 − −0.5 (3.11)

where σ is the coefficient of the Warburg element. Details on how it describes
a porous electrode can be found in the Supporting Information of Paper I.
In Paper IV, the analysis of impedance spectra was focused on the capacitor
at low frequencies, which is mostly contributed by the electrochemical dou-
ble-layer on the carbon matrix. With the specific capacitance of carbon, the
electrochemically active surface area can be calculated from the capacitance
derived from the impedance measurement.

3.2.3 X-ray Diffraction/Wide-angle X-ray Scattering
X-ray diffraction (XRD), also known as wide-angle X-ray scattering
(WAXS), is a materials characterisation technique that analyses the elastically
scattered photons with larger momentum transfer, which are attributed to the
diffraction phenomenon of crystals. As an array of atoms is illuminated by
photons with a wavelength close to their spacing, each atom behaves like a
point light source and the light from the atoms in the array can intensify or
cancel out each other in specific directions. The collective outcome of the
point light sources is termed diffraction. The relationship between the lattice
plane spacing (d) and the scattering angle (θ) is described by Bragg’s law:

 = 2 sin (3.12)

where n is a positive integer and λ is the wavelength of the incident X-ray. The
intensity of each peak is determined by the elements sitting on the planes in
the array since each element scatters X-rays differently. Generally, atoms with
more electrons interacts more with the electromagnetic wave, but this rela-
tionship is also wavelength-dependent. In summary, each crystalline material
has its own unique diffraction pattern, which can be used to identify it.60
 In chapter 4.1, XRD is applied to an operating battery. The coin cell has to
be modified to avoid the high X-ray absorption of the stainless steel casing, as
explained previously in chapter 3.1.3. Through operando XRD, the evolution
of the crystalline active materials can be followed as the cell goes through
different SoC levels. For Li–S batteries, as mentioned above in chapter 1.2.1,

 27
the active material of the positive electrode dissolves in the electrolyte as dis-
charging/charging starts, and precipitates at the end of discharge/charge. Since
both elemental sulfur and Li2S are crystalline, operando XRD is applied here
as a tool to track the process of precipitation and dissolution.

3.2.4 Small-angle X-ray and Neutron Scattering
Small-angle scattering (SAS) techniques also analyse the results from elastic
scattering, just like its wide-angle counterpart, but with small momentum
transfer, which are contributed by scatterers larger than atoms. Depending on
the specifications of the equipment, the probing scale can range from nano- to
micrometers.61 The momentum transfer (q) can be expressed in terms of scat-
tering angle (θ) and the wavelength (λ) of the incident beam:62

 4 sin
 = (3.13)

The scattering intensity (I) follows a general form:63

 ( ) = 2 ∆ 2 ( ) ( ) (3.14)

where N is the number of scatterers, V is the volume of a scatterer, ∆ρ is the
contrast of the scattering length densities (SLD) of the scatterers and their sur-
rounding medium, P is the form factor and S is the structure factor. In chapter
4.1.3, SAS experiments were conducted with both X-ray and neutrons. More-
over, cells with hydrogenous and deuterated electrolytes were probed by the
small-angle neutron scattering (SANS). These combinations rendered three
SLD contrasts and thus sufficient information for a definite interpretation of
the system. The simultaneously measured WAXS signal enabled the compar-
ison between crystalline and amorphous solid clusters in the system.

28
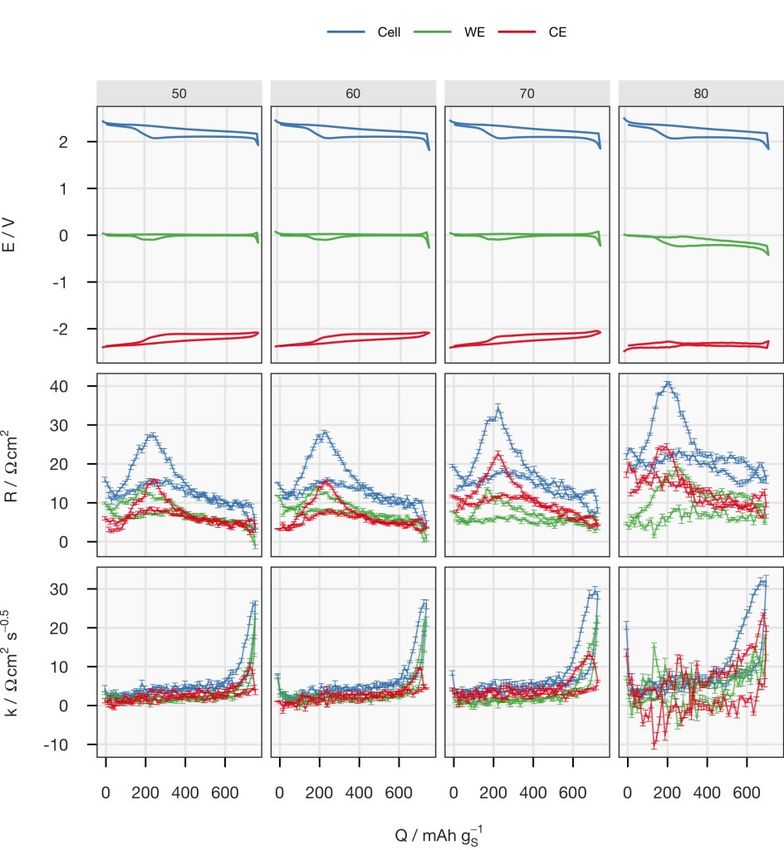
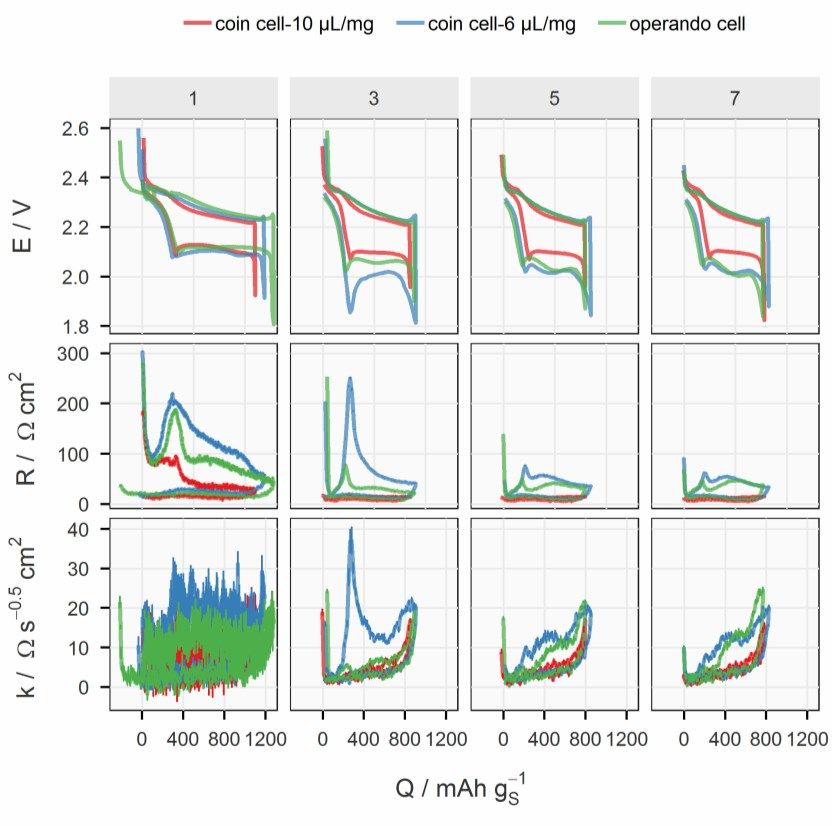
4 Results and Discussions

4.1 Illustration of a Discharging Positive Electrode
This chapter dives into the details of the discharge processes inside an operat-
ing S/C composite electrode and aims to provide a holistic picture of how
these processes are steered by the electrochemical cell parameters and how
they, in turn, impact the electrochemical properties of the cell.

4.1.1 Precipitation and Energy Loss Processes
In Paper I, an experimental framework of concurrent detection of the crystal-
line species and resistance measurements is established by combining oper-
ando XRD and the ICI method. The influence of the precipitation of the insu-
lating solid species on the functionality of the porous carbon matrix will be
exhibited.

4.1.1.1 Electrochemical equivalence of the modified coin cell
To justify the resistance measurement, the electrochemical properties of the
modified coin cell was first benchmarked against those of conventional coin
cells. The potential (E), internal resistance (R) and diffusion resistance coef-
ficient (k) of the modified and conventional cells are plotted in Figure 4.1. It
can be noticed that the electrochemical properties of the modified coin cell,
which has 10 µL gs-1 electrolyte, laid between those of the two conventional
coin cells with 6 and 10 µL gs-1 electrolyte. This suggests that the effective
loss of electrolyte was smaller than 4 µL gs-1. Therefore, it can be concluded
that the modified coin cell presented in this work had electrochemical proper-
ties that are comparable to a standard Li-S coin cell with a high S-loading
(>4 mgS cm-2), a moderate reversible specific capacity (~800 mAh gS-1) and a
relatively lean electrolyte volume (6–8 µL mgS-1). The sealing of the modified
cells were improved in Paper II and III, which enabled operando XRD meas-
urements with 6 µL mgS-1. Similar comparisons between the modified and
conventional cells are presented in the Supporting Information of the corre-
sponding manuscript.

 29
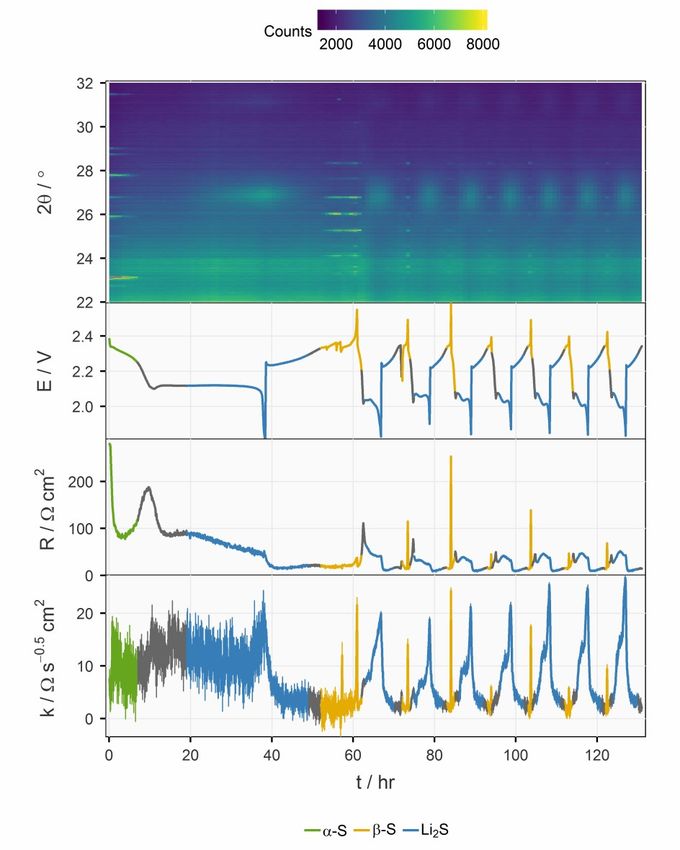
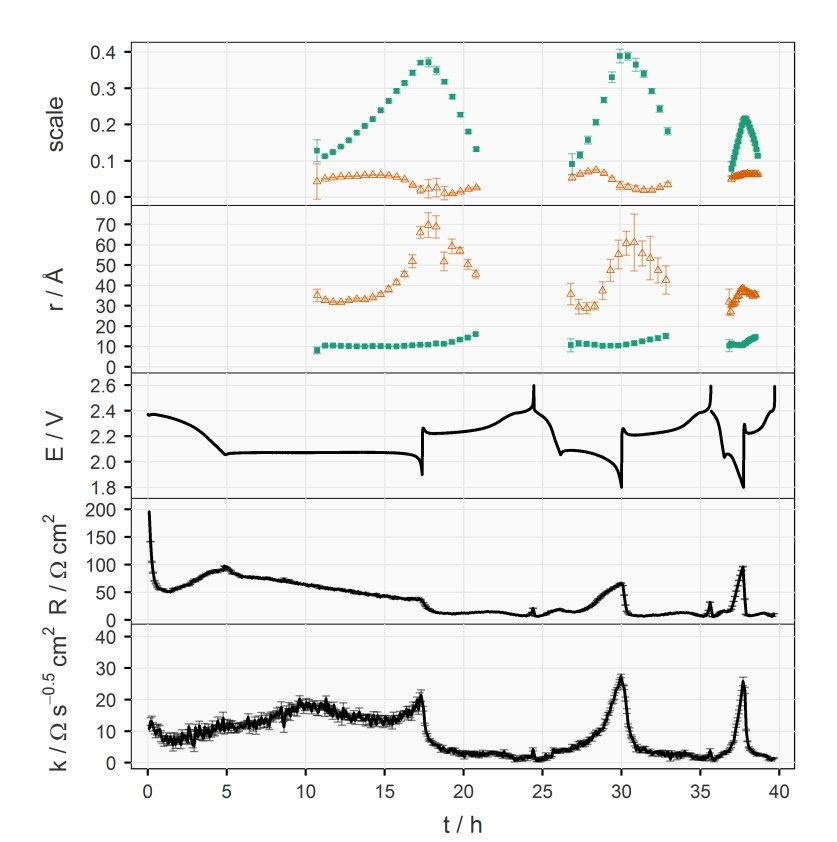
Figure 4.1. Potential (E), internal resistance (R) and diffusion resistance coefficient
(k) of the operando XRD cell (green) and two other unmodified coin cells with 6
(blue) and 10 (red) µL mgS-1 electrolyte, respectively. The electrochemical parameters
from the selected cycle (marked on the top of the panels) are plotted against the state
of charge (SoC) represented by specific charge (Q). A complete plot with data from
every cycle can be found in the supporting information of Paper I.

4.1.1.2 Operando XRD with concurrent resistance measurement
Figure 4.2 displays an overview of the operando XRD results with the elec-
trochemical properties plotted below it. The colour of the segments of the
curves of the potential, internal resistance and diffusion resistance coefficient
corresponds to the sulfur species present in the XRD pattern at the same time.
The initial orthorhombic α-S disappeared as the upper discharge plateau ended
in the first C/50 discharge. The internal resistance, which is the sum of solu-
tion and charge transfer resistance,49 decreased by a factor of one third as the
dissolution of α-S freed up the conductive surface in the porous carbon matrix
of the positive electrode. The internal resistance subsequently rose to a peak
situated at the SoC level between the two plateaus, which can be attributed to
the increased solution resistance caused by the high polysulfide concentration
at this SoC level,49,64,65 where no crystalline sulfur species were detected by
XRD. After one third of the lower discharge plateau, broad peaks of Li2S

30
started to appear in the XRD patterns. These can be ascribed to the very small
grain size and/or low crystallinity of Li2S according to previous work.66–68

Figure 4.2. Operando XRD data plotted against time. The XRD patterns are displayed
as a heat map at the top, followed by the potential (E), internal resistance (R) and
diffusion resistance coefficient (k). Error bars for R and k are estimated by the stand-
ard deviation from the linear regression.

As soon as the cell was charged at C/25 in the first cycle, both the internal
resistance and diffusion resistance coefficient dropped immediately, although

 31
there was still considerable intensity of the diffraction peaks of Li2S. This be-
haviour can be found in every cycle and corresponding data has also been
reported in EIS studies of Li-S cells.49,69,70 At the end of charging, elemental
sulfur crystallized in the monoclinic structure (β-S) instead of the initial or-
thorhombic structure (α-S). The formation of the thermodynamically less fa-
vourable allotrope have been frequently observed in previous operando XRD
works67,68,71 and has then been argued to be a consequence of precipitation
kinetics68.
 The C-rate for both discharge and charge was then switched to C/10 for the
remainder of the cycles. After the second cycle, the internal resistance de-
creased and stabilized around the fourth cycle. The diffusion resistance coef-
ficient stayed roughly the same, but the error bars were much smaller after the
second cycle due to the larger current.
 A trend in the diffusion resistance can be observed in Figure 4.2 after the
fourth cycle, where the profile of the internal resistance also had stabilized.
As Li2S appeared in the XRD patterns, the coefficient of diffusion resistance
jumped from below 5 Ω s-0.5 cm2 to a plateau around 12 Ω s-0.5 cm2, and there-
after increased rapidly again at the end of discharge. Upon charging, it
dropped immediately below 5 Ω s-0.5 cm2; the same as its value when there
was no Li2S detected. Since the diffusion resistance reflects the transport prop-
erties in the positive electrode, it is not surprising that it is influenced by the
evolution of Li2S. Nevertheless, it is interesting that the effect is asymmetric
upon discharging and charging.

4.1.1.3 Impact of Li2S precipitation on the transport properties inside
 the porous carbon matrix
To further analyse the correlation between the diffusion resistance and the
amount of Li2S, the diffusion resistance coefficient is plotted against the inte-
grated peak area of the 111 reflection of Li2S in Figure 4.3. As shown in Equa-
tion (3.4), the diffusion resistance coefficient increases when the solution re-
sistance (R´) inside the porous carbon increases and/or the capacitance (C) of
the carbon surface decreases. The morphology of Li2S growth on open struc-
ture carbon matrices, e.g. carbon nanotube scaffolds, has previously been stud-
ied by SEM.35,37 These studies suggested that the precipitation proceeds as a
two-dimensional growth covering the surface of the conductive carbon after
nucleation. Therefore, an explanation for the slow increase of the diffusion
resistance coefficient when Li2S started to appear in the XRD could be the
drop in capacitance, stemming from the progressive coverage of the surface
of the pores in the carbon matrix.
 As the Li2S phase continued to grow, more and more volume fraction of
the pores was occupied by insulating particles, instead of ion-conducting elec-
trolyte. This resulted in the increase in the solution resistance inside the pores
(R´) and consequently the diffusion resistance coefficient (k). On prolonged

32
discharge, the precipitates of Li2S may block the pores and the channels be-
tween them. Therefore, the diffusion resistance increased sharply, leading to
the termination of discharge. This reasoning is supported by several operando
spectroscopic experiments, which have demonstrated the presence of polysul-
fides in the positive electrode at the end of discharge.68,72,73

Figure 4.3. Diffusion resistance coefficient (k) plotted against the integrated area of
the 111 reflection of Li2S. Data are from the fourth to the eighth cycles.

In summary, Paper I demonstrated the value of coupling a materials charac-
terisation technique with simultaneous resistance measurements. More de-
tailed discussion about the combined observations are elaborated in Paper II.

4.1.2 From Cell Parameters to Electrochemical Performance
On the basis of the experimental framework developed in Paper I, the work
in Paper II applied the methodology to a series of Li–S cells to understand
how the Li2S precipitation is altered by different parameters of the cells and
how the precipitation in turn impacts their electrochemical properties. The
sealing of the modified coin cells was improved by using aluminium-coated
polyimide films, which rendered comparable electrochemical performance of
the operando cells with the same E/S ratio as the commercial coin cells, as
demonstrated in the Supporting Information of Paper II. The integrated in-
tensity from the uniform polyimide films also served as a normalising stand-
ard, which allowed a comparison between multiple cells. Moreover, the higher

 33
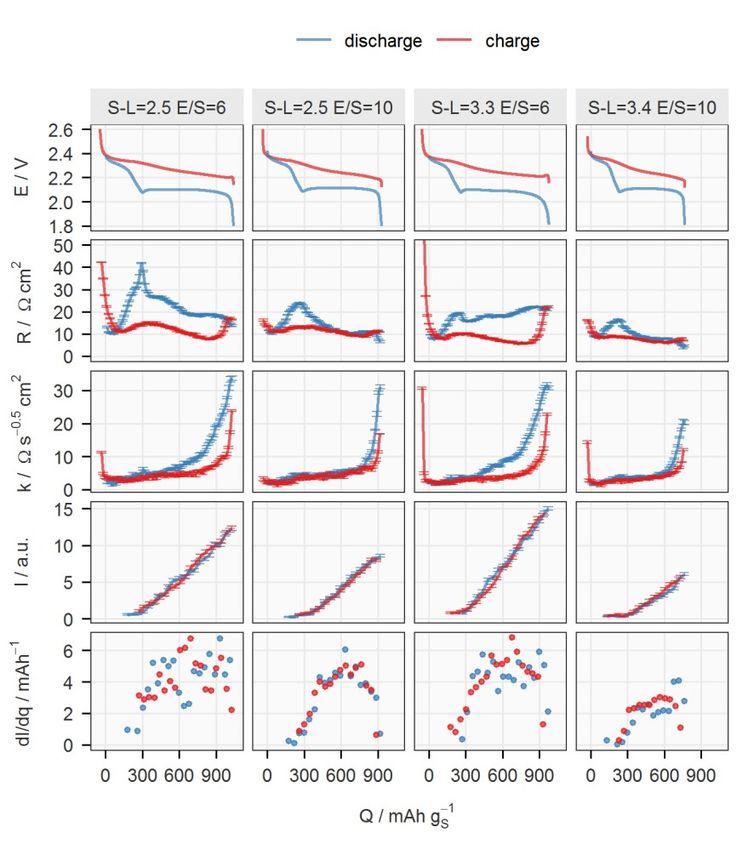
X-ray transmission of the new sealing enabled the collection of an XRD pat-
tern every 15 minutes, which is one fourth of the time required previously.

4.1.2.1 Effect of the sulfur-loading and E/S ratio
Four cells with two sulfur-loadings and two E/S ratios were fabricated with
the otherwise identical components to cross-examine the influence of both pa-
rameters. In contrast to Li-ion batteries, the electrode thickness and the elec-
trolyte amount have been well-recognised to be important factors in the spe-
cific capacity, which is proportional to the utilisation of active material, of the
Li–S system, even at low C-rates.20,51,54,74,75 However, their influence on the
electrochemical properties has not been fully mechanistically explained.
 Two major sources of resistances appearing when a Li–S cell discharges
are the solution resistance which increases with the polysulfide concentration,
and the charge-transfer and/or diffusion resistances raised by the precipitation-
related processes. The viscosity of the electrolyte increases with the concen-
tration of polysulfides in the catholyte, which has its maximum between the
two discharge plateaus (see Figure 1.1).76 The effect of the precipitation is
more complicated. Initially, it actually reduces the solution resistance since it
removes polysulfides from the electrolyte, which can be observed in the de-
crease of internal resistance right after the voltage entered the lower plateau;
see Figure 4.4. However, the subsequent formation of Li2S deteriorates the
carbon matrix, as discussed in the previous chapter.
 At the same sulfur-loading, the increase in E/S ratio decreases the concen-
tration of the polysulfides in the catholyte, which can be observed by the lower
peak in the internal resistance between the two discharge plateaus. The lower
polysulfide concentration also leads to a lower rate and amount of precipita-
tion. With less insulating precipitates, the ionic transport inside the porous
electrode remains undisturbed, as indicated by the low diffusion resistance
coefficient until the sudden increase at the end of discharge. However, the low
polysulfide concentration in the electrolyte could cause a more difficult re-
trieval of active material, resulting in a rapid increase in diffusion resistance.32
The mass transport overpotential may also have terminated the discharge pro-
cess earlier in comparison to the cell at a lower E/S ratio, and thus leading to
lower specific capacity.

34
Figure 4.4. Potential (E), internal resistance (R), diffusion resistance coefficient (k),
normalised intensity of the 111 peak of Li2S (I) and its rate of changing with respect
to the total charge passing through the cell (dI/dq) for cycle 5 plotted against the spe-
cific capacity (Q). Data on discharge and charge are in blue and red, respectively. See
Paper II for a detailed description.

The effect of sulfur-loading was more obvious at E/S = 6. Comparing the first
and third columns in Figure 4.4, the major difference can be identified as the
internal resistance. Since the precipitation rate, reflected by dI/dq, is similar
in both cells, the difference in the internal resistance, especially on the lower
discharge plateau, could be caused by the non-uniform reaction progress in
the axial direction of the electrode with higher sulfur-loading. The shorter up-
per discharge plateau of the cell with higher loading may also suggest an in-
complete dissolution process as a result of less homogeneous reactions across
the electrode.

 35
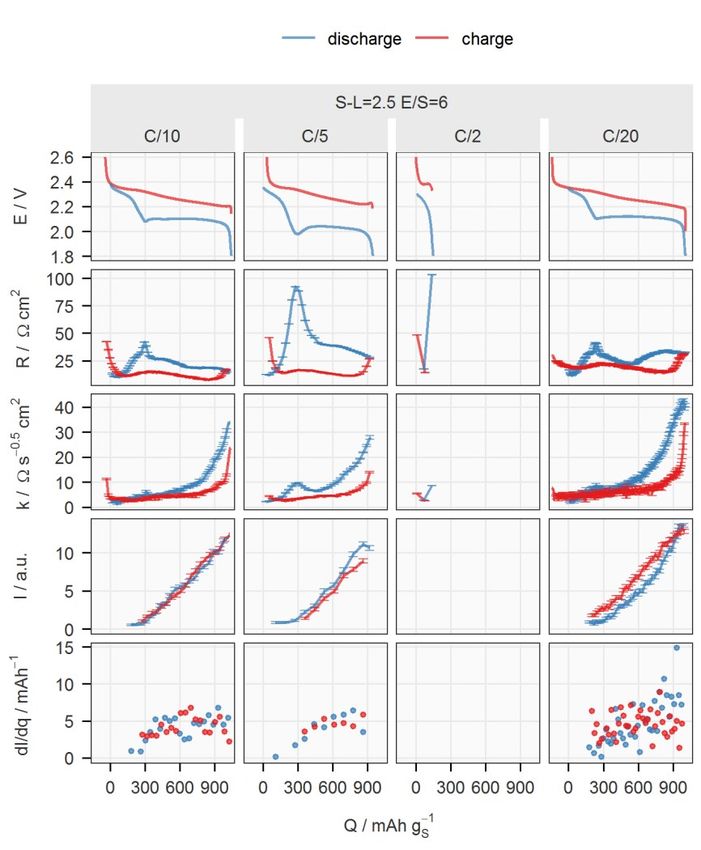
4.1.2.2 Effect of the specific current
The impact of the specific current on the formation of Li2S can be found in
Figure 4.5.

Figure 4.5. Potential (E), internal resistance (R), diffusion resistance coefficient (k),
normalised intensity of the 111 peak of Li2S (I) and its rate of changing with respect
to the total charge passing through the cell (dI/dq) of the cell ‘S-L=2.5 E/S=6’ cycled
at C/10, C/5, C/2 and C/20 are plotted against the specific capacity (Q). Data on dis-
charge and charge are in blue and red, respectively. See Paper II for a detailed de-
scription.

The first cell in Figure 4.4, ‘S-L=2.5 E/S=6’, was cycled at different C-rates.
An obvious feature in the results at C/2 was the missing lower plateaus. The
surge of the internal resistance could result from a more extreme case of non-
uniform reaction progression. It could be speculated that the Li+ transport in-
side the positive electrode cannot catch up with the high electronic current, so

36
the polysulfides on the separator have to be reduced further into shorter-
chained polysulfides, which causes the solution resistance to rise substantially.
A more mild case could happen at C/5, where the internal resistance between
the two discharge plateaus is substantially higher than that at C/10. The as-
sumption of the transport limitation of Li+ is supported by the peak of the dif-
fusion resistance coefficient at the same SoC.
 At C/20, an increasing trend in dI/dq could be observed, which suggested
that the precipitation is accelerated towards the end of discharge. This indi-
cated a more homogeneous reaction progress in the positive electrode, where
the polysulfides had a narrow distribution of oxidation states. Since the for-
mation of Li2S should be the final step of the reduction, the precipitation was
concentrated at the end of discharge.

4.1.2.3 Effect of the electrolyte salt with a high donor number
In the last part of Paper II, the influence of the electrolyte salt was studied by
replacing 50% of LiTFSI with LiBr. It has been previously reported that LiBr
promotes the disproportionation reactions between polysulfides, which en-
hances sulfur utilisation in a non-encapsulating carbon matrix,33 as discussed
in detail in the manuscript. Here, this effect was tested in an S/C electrode
optimised for the specific surface area. Despite the higher precipitation rate,
the discharge capacity was not higher than for the cell with standard electro-
lyte. As demonstrated by the larger I/qd,l values of the cell with LiBr in Table
4.1, more Li2S was formed for the same amount of charge passed during the
lower discharge plateau. This could explain the high overpotentials observed
from the cell.

 37
Table 4.1. Comparison of the specific discharge capacity (Qd,l) and total discharge
capacity (qd,l) of the lower plateau, integrated intensity of the 111 reflection of Li2S
(I), full-width half-maximum (FWHM) of the reflection from the second last meas-
urement during discharge (to avoid current switching during the measurements) and
ratio of the intensity to the total discharge capacity of the lower plateau (dI/dqd,l) of
the cells. Standard deviations are in brackets. See Paper II for the full table.
 Cell C-rate Qd,l / qd,l / I / a.u. FWHM / ° I/qd,l /
 mAh gS-1 mAh mAh-1
 S-L=2.5 C/10 725 2.434 11.5(3) 1.22(2) 4.7
 E/S=6 C/5 613 2.060 11.1(3) 1.36(3) 5.4
 C/2 0 0 0 n/a n/a
 C/20 761 2.556 13.3(3) 1.19(2) 5.2
 S-L=2.5
 C/10 627 2.091 8.2(2) 1.10(3) 3.9
 E/S=10
 S-L=3.3 C/10 710 3.140 14.4(3) 1.16(1) 4.6
 E/S=6 C/10 724 3.203 14.8(3) 1.22(1) 4.6
 S-L=3.4
 C/10 529 2.378 5.4(2) 1.11(4) 2.3
 E/S=10
 S-L=3.3 C/10 515 2.285 15.4(3) 1.31(2) 6.7
 E/S=6 C/20 613 2.718 19.0(3) 1.32(1) 7.0
 TFSI/Br
 C/13 470 2.085 14.1(3) 1.38(2) 6.8

38
You can also read