STUDIES OF NUCLEAR ENCODED MITOCHONDRIAL PROTEINS IN METABOLISM - Department of Laboratory Medicine Karolinska Institutet, Stockholm, Sweden
←
→
Page content transcription
If your browser does not render page correctly, please read the page content below
Department of Laboratory Medicine
   Karolinska Institutet, Stockholm, Sweden

STUDIES OF NUCLEAR ENCODED
 MITOCHONDRIAL PROTEINS IN
        METABOLISM

                  Qian Zhao

                Stockholm 2021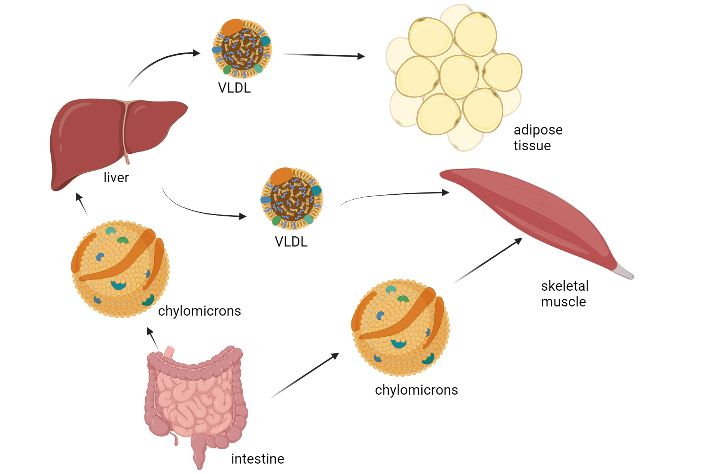
All previously published papers were reproduced with permission from the publisher.
Published by Karolinska Institutet.
Printed by Universitetsservice US-AB, 2021
© Qian Zhao, 2021
ISBN 978-91-8016-410-8
STUDIES OF NUCLEAR ENCODED MITOCHONDRIAL
PROTEINS IN METABOLISM
THESIS FOR DOCTORAL DEGREE (Ph.D.)

By

Qian Zhao

The thesis will be defended live online (a zoom link will be provided) at Karolinska Institutet,
Thursday, December 16th, 2021 at 13h.

Principal Supervisor:                          Opponent:
Anna Karlsson                                  Docent Liya Wang
Karolinska Institutet                          Swedish University of Agricultural Sciences
Department of Laboratory Medicine              Department of Anatomy, Physiology and
Division of Clinical Microbiology              Biochemistry

Co-supervisor(s):                              Examination Board:
Sophie Curbo                                   Professor Maria Eriksson
Karolinska Institutet                          Karolinska Institutet
Department of Laboratory Medicine              Department of Biosciences and Nutrition
Division of Clinical Microbiology
                                               Professor Martin Ott
Xiaoshan Zhou                                  Stockholm University
Karolinska Institutet                          Department of Biochemistry and Biophysics
Department of Laboratory Medicine
Division of Clinical Microbiology              Professor Andrei Chabes
                                               Umeå University
                                               Department of Medical Biochemistry and
                                               Biophysics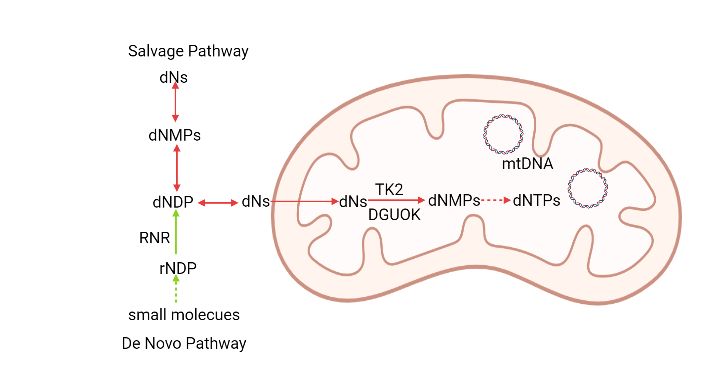
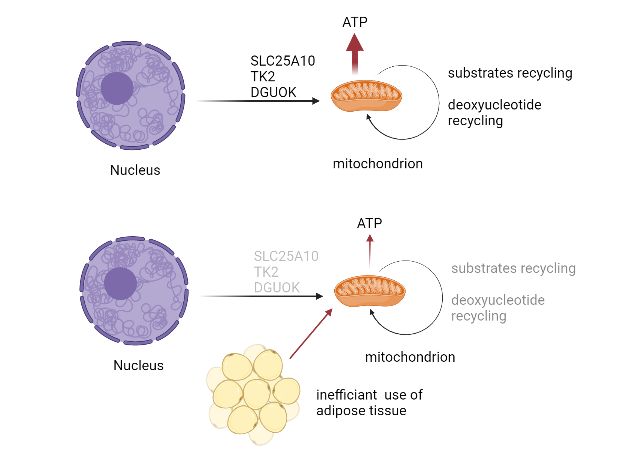
ABSTRACT
Mitochondrial function is vital for human health. Inherited genetic disease can cause
mitochondrial DNA (mtDNA) deficiency, disorders with generally poor prognosis. The
majority of the genes involved in keeping a normal mitochondrial function are nuclear encoded.
Deficiency in the nuclear encoded enzymes that provide building blocks for mtDNA synthesis,
thymidine kinase 2 (TK2) and deoxyguanosine kinase (DGUOK), cause myopathy,
encephalomyopathy and hepatocerebral disorders in humans. The nuclear encoded SLC25A10
is located in the mitochondrial inner membrane and is involved in regulation of cell
metabolism.

In the first study we hypothesized that SLC25A10 had a regulatory role in cancer metabolism.
Since the antidiabetic drug metformin was known to reduce the risk for cancer and to alter cell
energy production, we used the siSLC25A10 model to investigate effects of metformin. In the
siSLC25A10 cell line, metformin significantly downregulated the SLC25A10 carrier,
especially at low glucose conditions, at both mRNA and protein levels. Since SLC25A10 is a
mitochondrial transporter, this lower expression affects the exchange of nutrients with the
potential to alter metabolic pathways of cancer cells.

In addition to cell culture studies, animal models are important tools to study mitochondrial
functions. We constructed a DGUOK complete knockout mouse model to investigate the
phenotype with the aim to find a model for mechanistic studies and treatment strategies.
Interestingly, the Dguok−/− mice survived for more than 20 weeks despite very low mtDNA
levels in liver tissue. Lipid metabolism as well as the de novo serine synthesis and the folate
cycle were altered in the long surviving Dguok−/− mice. Two pyruvate kinase genes, PKLR and
PKM, were active to supply pyruvate for the mitochondrial citric acid cycle (TCA cycle),
which may be an explanation for the long-term survival although severely affected
mitochondrial function.

We also constructed a skeletal and cardiac muscle specific TK2 knockout mouse (mTk2 KO)
and a liver specific TK2 knockout mouse (livTK2 KO). The mTk2 KO mice showed dilated
hearts and markedly reduced adipose tissue, but livTK2 KO mice were not different compared
to the control group. A severe decrease of mtDNA was found only in skeletal muscle and heart
tissue in the mTk2 KO mice. The mTk2 KO mice survived for maximum 16 weeks, but livTK2
KO mice survived for more than one and a half years. The data suggested that TK2 was vital
for mtDNA maintenance in cardiac and skeletal muscle, while Tk2 deficiency in liver could be
compensated for. Despite low mtDNA levels in the liver of the livTK2 KO mice we did not
observe any difference compared to the control mice. The receptor for angiotensin-converting
enzyme 2 (ACE2), was also affected by mtDNA deficiency in mTk2 KO mice. Since ACE2 is
a receptor for the SARS-CoV-2 virus, its regulation in relation to mitochondrial function may
have important clinical implications.
LIST OF SCIENTIFIC PAPERS

  I.   Zhao, Q; Zhou, X; Curbo, S; Karlsson, A. Metformin downregulates the
       mitochondrial carrier SLC25A10 in a glucose dependent manner. Biochemical
       Pharmacology; 444-450, Volume 156, (2018)
 II.   Zhou, X; Curbo, S; Zhao, Q; Krishnan, S; Kuiper, R; Karlsson, A. Severe mtDNA
       depletion and dependency on catabolic lipid metabolism in DGUOK knockout mice.
       Human Molecular Genetics; 2874-2884, Volume 28 Issue 17, (2019)
III.   Zhou, X, Mikaeloff, F; Curbo S, Zhao, Q, Kuiper R, Végvári A, Neogi U and
       Karlsson A. Coordinated pyruvate kinase activity is crucial for metabolic adaptation
       and cell survival during mitochondrial dysfunction. In press 2021, Human Molecular
       Genetics
IV.    Zhao, Q; Zhou, X; Kuiper, R; Curbo, S; Karlsson, A. Mitochondrial dysfunction is
       associated with lipid metabolism disorder and upregulation of angiotensin-converting
       enzyme 2. Submitted
V.     Zhao, Q; Zhou, X; Kuiper, R; Curbo, S; and Karlsson, A. Specific depletion of
       thymidine kinase 2 in liver tissue does not affect mice survival. Manuscript
CONTENTS
1 INTRODUCTION........................................................................................................... 1
2 LITERATURE REVIEW ............................................................................................... 3
2.1 Mitochondria ......................................................................................................... 3
2.1.1 Mitochondrial DNA .................................................................................. 3
2.1.2 Deoxyribonucleotides for mitochondrial DNA synthesis ........................ 3
2.1.3 TK2 mutation related disorders ................................................................ 5
2.1.4 DGUOK related disorders ........................................................................ 6
2.1.5 Other mutations related to mitochondrial disorders ................................. 6
2.1.6 Mitochondria in cell metabolism .............................................................. 8
2.2 Mitochondria and aging ........................................................................................ 9
2.2.1 mtDNA variation/mutations and aging .................................................... 9
2.2.2 mtDNA copy numbers and aging ............................................................. 9
2.3 angiotensin-converting enzyme 2 (ACE2) .........................................................10
2.3.1 ACE2 in cardiovascular system ..............................................................10
2.3.2 ACE2 expression in different organs in animal models ........................10
2.4 Lipid metabolidm ................................................................................................10
2.4.1 Lipid composition ...................................................................................10
2.4.2 Liver function in lipid metabolism .........................................................11
2.4.3 Myocardial lipid metabolism ..................................................................12
2.4.4 Lipoprotein lipase....................................................................................12
2.4.5 Skeletal muscle function in lipid metabolism ........................................13
2.5 Cancer cell metabolism .......................................................................................13
2.6 Metformin ............................................................................................................14
2.6.1 Metformin in diabetes .............................................................................14
2.6.2 Metformin action on mitochondrial complex I in cancer ......................14
2.7 The SLC25A10 mitochondrial carrier ................................................................15
3 RESEARCH AIMS .......................................................................................................17
4 MATERIALS AND METHODS .................................................................................19
4.1 Materials and reagents .........................................................................................19
4.2 methods ................................................................................................................19
4.2.1 Transgene constructs ...............................................................................20
5 RESULTS and discussion .............................................................................................23
6 CONCLUSIONS ...........................................................................................................25
7 POINTS OF PERSPECTIVE .......................................................................................27
8 ACKNOWLEDGEMENTS..........................................................................................29
9 REFERENCES ..............................................................................................................31LIST OF ABBREVIATIONS araC arabinofuranosylcytosine ATP adenosine triphosphate CD36 cluster of differentiation 36 CoA coenzyme A CPEO chronic progressive external ophthalmoplegia dAdo deoxyadenosine dCK deoxycytidine kinase dCyd deoxycytidine dFdC difluorodeoxycytidine dGK/DGUOK deoxyguanosine kinase dGuo deoxyguanosine dIno deoxyinosine Dm-dNK Drosophila melanogaster deoxyribonucleoside kinase DNA deoxyribonucleic acid dNKs deoxyribonucleoside kinases dNTP deoxyribonucleotide triphosphate dThd deoxythymidine dU deoxyuridine FABP fatty acids binding protein plasma membrane FADH2 reduced form of flavin adenine dinucleotide FATP fatty acids transport protein FFAs free fatty acids HDL high-density lipoproteins HSV TK herpes simplex virus thymidine kinase IDL intermediate-density lipoproteins
LDL        low-density lipoproteins

LPL        lipoprotein lipase

MDS        mitochondrial DNA depletion syndromes

MELAS      mitochondrial encephalopathy, lactic acidosis and stroke-like episodes

MNGIE      neurogastrointestinal encephalopathy

mtDNA      mitochondrial DNA

NADH       reduced form of nicotinamide adenine dinucleotide

nDNA       nuclear DNA

NDPK       nucleoside diphosphate kinase

NMPKs      nucleoside monophosphate kinases

OXPHOS     oxidative phosphorylation

PEO        progressive external ophthalmoplegia

PRPP       5-phosphoribosyl-1-pyrophosphate

RAS        renin-angiotensin system

RNA        ribonucleic acid

ROS        reactive oxygen species

rRNA       ribosomal ribonucleic acid

SLC25A10   solute carrier family 25 member 10

TK1        thymidine kinase 1

TK2        thymidine kinase 2

tRNA       transfer ribonucleic acid

VLDL       very-low-density lipoproteins
1 INTRODUCTION
Mitochondria are the powerhouse (ATP production) of the cells and are also involved in other
activities like creating heat, generation of radical oxygen species (ROS) and contribution to
lipid metabolism. A dysfunction of mitochondria usually results in diseases with poor
prognosis. Among mitochondrial disorders are genetically inherited diseases with altered gene
function of either nuclear genes or genes encoded by mitochondrial DNA. Phenotypically
heterogenous syndromes with severe reduction in mitochondrial DNA (mtDNA) copy number
are called mitochondrial DNA depletion syndromes (MDS). Studies in the present thesis
mainly focus on enzymes that phosphorylate precursors for mtDNA. Deficiency of these
enzymes results in MDS with a broad range of clinical presentations.

Depletion of the nuclear encoded mitochondrial nucleoside kinases thymidine kinase 2 (TK2)
and deoxyguanosine kinase (DGUOK) was investigated in mouse models. TK2 phosphorylates
deoxythymidine (dThd), deoxycytidine (dCyd), and deoxyuridine (dU) to their corresponding
monophosphate. DGUOK phosphorylates deoxyguanosine (dGuo), deoxyadenosine (dAdo),
and deoxyinosine (dIno) to their monophosphate form. A TK2 complete knockout mouse
model was generated in our group, and showed short survival of 2-4 weeks [1], and with severe
beta oxidation impairment in liver tissue [2]. The lifetime expectancy of the TK2 complete
knockout mice was not long enough to allow studies of additional symptoms and metabolic
changes. TK2 deficiency in humans causes muscle related symptoms. To enable further studies
of this, our group established a TK2 cardiac and skeletal muscle specific knockout mouse
model. The study demonstrated a specific reduction of mtDNA in heart and skeletal muscle
and the knockout mice had longer life expectancy, about 16 weeks and, interestingly, showed
a marked change in metabolism. In another mouse strain constructed, TK2 was specifically
deleted in liver tissue. These mice did not show an apparent phenotype although the mtDNA
levels in liver were markedly reduced.

The other mitochondrial nucleoside kinase is DGUOK. Deficiency of DGUOK in humans
results in a hepatocerebral form of mtDNA deficiency. Until now, there is no effective
treatment for these genetic diseases. Our group established a DGUOK complete knockout
mouse model and found a systemic deficiency of mtDNA. The DGUOK deficient mice were
also found to have alterations in metabolism.

Mitochondrial dysfunction often results from genetic inherited diseases with different clinical
presentations. There are myopathic, encephalomyopathic, hepatocerebral and
neurogastrointestinal forms. Mitochondrial alterations are also found in cancer cells where
metabolic changes are a landmark for cancer [3]. Metformin, mainly a traditional diabetes type
2 medicine, has been found to have effects in cancer treatment. Previous studies indicated
metformin to be involved in the metabolism of cancer cells, and to be strongly related to the
glucose level in blood. Cancer cell experiments in vitro have been performed to address
questions on the effects of metformin on cancer cell metabolism.

                                                1
2 LITERATURE REVIEW
2.1 MITOCHONDRIA
Mitochondria have evolved from aerobic bacteria to become organelles in eukaryotic cells in
an endosymbiotic event [4, 5]. Mitochondria are double-membrane cell organelles essential for
cellular ATP and carbohydrate intermediate production through the process of TCA cycle and
oxidative phosphorylation [3]. Mitochondria number per cell has a very large range in
eukaryotes from a single mitochondrion to thousands of mitochondria, depending on the cell
type [6]. The mitochondrial DNA copy number is related to the energy requirement of the
specific cell type. The requirement of energy of a specific cell will determine the turnover of
mitochondria. The most common form of cellular energy is adenosine triphosphate (ATP), and
the main site of ATP production is through the electron transport chain and ATP synthase in
the inner mitochondrial membrane [3]. The outer membrane has pores that are big enough for
ions and small molecules to pass. In contrast, the inner mitochondrial membrane has a
permeability limit which keep the TCA cycle substrates and other functional molecules inside
the mitochondria. Other important functions of mitochondria, in addition to ATP production,
are the metabolism of sugars and fatty acids, calcium storage [7] and signaling and regulation
of the cellular redox state [3]. Mitochondria divide independently of the cell cycle and thus the
mitochondrial DNA synthesis is not coupled to cell division.
2.1.1 Mitochondrial DNA
Most mitochondrial proteins are encoded by nuclear genes in the cell nucleus and transported
into the mitochondria [8-10]. Mitochondrial DNA (mtDNA) has a size of 16569 bp in humans
and encodes 37 genes. These genes encode 22 tRNAs, 2 rRNAs and 13 of the proteins involved
in oxidative phosphorylation [11]. Usually, each mitochondrion contains 2 to 10 mtDNA
copies, but there is a great variation depending on the type of tissue [12]. Since the replication
and repair of mitochondrial DNA proceed throughout the cell cycle, mitochondria need a
continuous supply of DNA precursors. Mitochondrial DNA depletion syndromes (MDS) are
genetic disorders characterized by decreased mtDNA levels and may affect different tissues
including muscle, liver, and brain [13]. We mainly discuss the nuclear encoded genes that cause
mitochondrial DNA depletion, which are summarized in table 2.
2.1.2 Deoxyribonucleotides for mitochondrial DNA synthesis
Deoxyribonucleotides (dNTPs) cannot freely cross the cell membrane due to their negative
charge and there are only known transporters of deoxyribonucleosides [14]. For the nucleotide
biosynthesis, there are two pathways. The de novo pathway only exists outside mitochondria,
while the salvage pathway functions both outside and inside mitochondria by using different
phosphate transfer enzymes (figure 1). Both purines and pyrimidines can be synthesized de
novo from 5-phoshoribosyl-1-pyrophosphate (PRPP)[15]. IMP is the first product in the purine
biosynthesis pathway and IMP is subsequently converted into AMP or GMP. The
monophosphates can be further phosphorylated to the di- and triphosphate forms by
3monophosphate kinases (NMPKs) and nucleoside diphosphate kinase (NDPK)[15]. The
committed step in de novo dNTP synthesis is the reduction of ribonucleotides by ribonucleotide
reductase (RNR) [16]. RNR contains two subunits, R1 and R2 [17]. R1 is constantly expressed
in the dividing cell [18], while R2 is regulated by the synthesis phase (S phase) of the cell cycle
[19, 20]. RNR can reduce all four ribonucleotides to their corresponding deoxyribonucleotides
[21]. RNR activity results in a balanced supply of dNTPs sufficient for both nuclear and
mitochondrial DNA in dividing cells [22].
The situation is different in non-dividing cells. A similar R2 subunit, which is called p53R2, is
encoded by RRM2B and induced by p53 [23]. This p53R2, together with the R1 subunit,
contributes to mtDNA synthesis and DNA repair in both proliferating cells and non-
proliferating cells [24, 25]. The de novo and salvage pathways together support the demand of
DNA building blocks during all cell cycles. Deoxyribonucleosides can enter the cells from
external sources or be recycled in catabolic processes within the cells and phosphorylated by
deoxyribonucleoside kinases (dNKs) to produce deoxyribonucleotides. There are four dNKs in
mammalian cells, cytosolic thymidine kinase 1 (TK1) and deoxycytidine kinase (dCK), and
the mitochondrial thymidine kinase 2 (TK2) and deoxyguanosine kinase (DGUOK) [26] (Table
2). TK2 and DGUOK are encoded by nuclear DNA with an N-terminal mitochondrial targeting
sequence, and thus these proteins are transported to the mitochondrial compartment. TK1 is
strictly active in dividing cells and as such it is used as a proliferation marker. The sequence
related enzyme dCK, have overlapping substrate specificity to mitochondrial TK2 and
DGUOK, but without a mitochondrial targeting signal. The activity of dCK is of clinical
importance since dCK phosphorylates several clinically important nucleoside analogs used in
cancer treatment, such as arabinofuranosylcytosine (araC, cytarabine) and
difluorodeoxycytidine (dFdC, gemcitabine)[27, 28].
Deoxyribonucleoside kinase Natural substrates Expression phase
TK1 dThd, dUrd S phase
TK2 dThd, dUrd, dCyd constitutively
DGUOK dGuo, dAdo, dIno constitutively
dCK dCyd, dAdo, dGuo constitutively
Table 1. Substrates and expression of deoxyribonucleoside kinases
4Figure 1. Nucleotide biosynthesis
TK2 is a nuclear gene located on chromosome 16q22 and the enzyme has a peptide sequence
with an N-terminal mitochondrial targeting sequence [29]. TK2 is constitutively expressed
throughout the cell cycle and its expression level is correlated to the mitochondrial content of
the specific cell. The substrates phosphorylated by TK2 to their corresponding
monophosphates are dThd and dCyd. TK2 is expressed at much lower levels than the cytosolic
TK1 and thus is not regarded as a significant enzyme in proliferating cells. In contrast, TK2
plays an important role in post-mitotic tissues [15], since TK1 is not expressed outside the S
phase. TK2 is genetically related to DGUOK, dCK, and herpes simplex virus thymidine kinase
(HSV TK), but not to TK1 [30]. The primary sequences show that the deoxyribonucleoside
kinases can be divided into two distinct families. TK2 belongs to a homologous family together
with DGUOK, dCK, HSV TK and the multisubstrate nucleoside kinase from Drosophila
melanogaster (Dm-dNK) [31, 32]. Dm-dNK is the only identified deoxyribonucleoside kinase
that can phosphorylate all four deoxyribonucleosides (A,T,C,G) and with higher catalytic
efficiency compared to the related mammalian enzymes [33].
2.1.3 TK2 mutation related disorders
Mutations of the TK2 gene results in mtDNA depletion and is predominately associated with
a myopatic form of MDS [34, 35]. The first diagnose of TK2 mutations causing MDS was
presented in 2001 [36]. Two mutations, His90Asn and Ile181Asn were identified in four
patients with mtDNA depletion, skeletal myopathy, and early age death [36]. Since then,
several additional TK2 mutations have been identified, among these many that result in multi
organ involvement, and a common cause of early death is respiratory failure [37-40]. There are
also reports on later onset and milder forms of TK2 associated MDS which usually is related
to preserved residual TK2 activity [41]. The severity of the TK2 deficiency correlates to the
clinical picture with a close to complete loss of TK2 activity that results in severe
5encephalomyopathy and a partial reduction of TK2 activity that is associated with myopathy
and sometimes a later onset of disease [42].
For studies of the mechanisms of TK2 deficiency two mouse models have been reported [1,
43]. A complete TK2 knockout mouse model and a TK2 knock in of mutation H126N
(analogous to human H121N) showed similar pathology with progressive mtDNA depletion in
skeletal muscle, liver, heart, and spleen [43]. The TK2 knockout mice also showed severe
ataxia, neurodegeneration and died within 2-4 weeks [1]. In an attempt to rescue the TK2
depletion mice, the Dm-dNK which is related to dNK, was transgene expressed in the TK2 KO
mice [44]. The Dm-dNK expression resulted in a very large dTTP pool and a complete rescue
of the TK2 deficient phenotype, but interesting the mice did not have adipose tissue stored as
wild type mice [44, 45]. The study demonstrated that nucleosides phosphorylated outside the
mitochondria could support mtDNA synthesis in all tissues affected by TK2 deficiency and
also that very unbalanced dNTP pools were not mutagenic in this specific mouse model.
2.1.4 DGUOK related disorders
The DGUOK gene is located on chromosome 2 and like TK2 the peptide contains an N-
terminal positively charged mitochondrial targeting signal [46]. Similar to TK2, DGUOK is
constitutively expressed throughout the cell cycle and its expression level is correlated to the
mitochondrial content of the specific cell. The DNA precursor substrates phosphorylated by
DGUOK to their corresponding monophosphates are dGuo and dAdo. DGUOK and TK2 are
closely sequence related and together they account for the synthesis of all four dNTPs in
quiescent cells. In proliferating cells, the TK1 activity is high and makes TK2 activity of little
importance in the co-presence of TK1. There is no corresponding S-phase specific nucleoside
kinase for the substrates of DGUOK where instead both dCK and RNR probably accounts for
the increased demand of the DGUOK specific substrates.
The most common phenotype of DGUOK deficiency in humans presents as a neonatal
multisystem disorder. Common symptoms of affected individuals are lactic acidosis, hepatic
disease, hypoglycemia, and neurologic dysfunction [47]. Late onset of this disease has also
been reported with a clinical presentation of liver failure but without neurological symptoms
[48]. Individuals with symptoms restricted to the liver have been treated with liver
transplantation and some of them responded well to the procedure [47, 49-51]. There have been
no previous DGUOK deficient mice model presented for mechanistic and treatment studies of
DGUOK deficiency.
2.1.5 Other mutations related to mitochondrial disorders
The first report of multiple mtDNA deletions was in muscle tissue, with autosomal dominant
progressive external ophthalmoplegia (adPEO) in 1989 [52], and the initial description of
profound depletion of mtDNA presenting as infantile myopathy, hepatopathy and
nephropathy [53]. A TK2 deficiency related disorder was first diagnosed in children in
2001[36]. In 2013, an adult form of disease linked to TK2 deficiency was reported and was
6found because of advanced genetic testing [42]. Until now, many genes have been linked to
mitochondrial DNA depletion syndromes (Table 2).
Table 2. Summary of mitochondrial DNA depletion syndromes
Gene Protein Clinical phenotype Reference
TK2 Thymidine kinase 2 Myopathy [36]
DGUOK Deoxyguanosine Hepatopathy, neurological symptoms [54]
kinase
MPV17 MPV17 Hepatopathy, neurohepatopathy, neuropathy, [55]
leukoencephalopathy, Charcot-Marie-Tooth
POLG1 Polymerase gamma Encephalohepatopathy, epilepsy, ataxia, neuropathy [56]
C10orf2 Twinkle Ataxia, neuropathy, ophthalmoplegia, hearing [57]
impairment, epilepsy, liver involvement
SUCLA2 Beta subunit of Dystonic motor disability, deafness, hypotonia [58]
succinyl-CoA
ligase
SUCLG1 Alpha subunit of Metabolic crisis, dystonic motor disability, deafness, [59]
succinyl-CoA hypotonia
ligase
RRM2B p53-R2 Hypotonia, developmental delay, tubulopathy [60]
TYMP Thymidine Ophthalmoparesis, ptosis, gastrointestinal [61]
phosphorylase dysmotility, cachexia, neuropathy, ataxia,
leukoencephalopathy, mitochondrial
neurogastrointestinal encephalopathy (MNGIE)
MGME1 Mitochondrial Progressive external ophthalmoplegia (PEO), [62]
genome emaciation and respiratory failure
maintenance
exonuclease 1
RNASEH1 Ribonuclease H1 Chronic progressive external ophthalmoplegia [63]
(CPEO), muscle weakness, dysphagia,
spinocerebellar signs
TFAM Mitochondrial Hyperbilirubinemia and hypoglycemia with [64]
transcription factor progression to liver failure
A
7SSBP1 Mitochondrial Optic atrophy, liver failure, neurological syndrome, [65]
single strand retinopathy
binding protein
LIG3 Ligase III Severe gut dysmotility and neurological [66]
abnormalities, including leukoencephalopathy,
epilepsy, migraine, stroke-like episodes, and
neurogenic bladder.
MFN2 Mitofusin-2 Optic atrophy, myopathy, axonal neuropathy, [67]
Charcot-Marie-Tooth
MSTO1 Mitochondrial Muscular dystrophy with cerebellar involvement, [68]
fusion myopathy, ataxia
MICOS13 MICOS complex Hepato-encephalopathy [69]
subunit MIC13
SLC25A21 Mitochondrial 2- Spinal muscular atrophy-like [70]
oxodicarboxylate
carrier
SLC25A10 Mitochondrial Epileptic encephalopathy [71]
dicarboxylate
carrier
AGK Acylglycerol Congenital cataract, hypertrophic cardiomyopathy, [72]
kinase skeletal myopathy and lactic acidosis, Sengers
syndrome
FBXL4 Protein Encephalomyopathy [73]
homeostasis
ABAT Aminotransferase Encephalomyopathy [74]
MRM2 Mito rRNA Mitochondrial encephalopathy, lactic acidosis, and [75]
maturation stroke-like episodes (MELAS) syndrome
2.1.6 Mitochondria in cell metabolism
Mitochondria are key organelles in cellular metabolism and known as the powerhouse of the
cell. They break down nutrients and produce energy rich molecules such as ATP. In the
biochemical process known as cellular respiration glucose and other nutrients are converted
into energy necessary for movements and growth. Glucose is first converted to pyruvate in the
cytosol either under aerobic or anerobic conditions. Pyruvate is transported into the
mitochondrial matrix and subsequently metabolized into acetyl coenzyme A (acetyl CoA).
8Acetyl CoA enters the tricarboxylic acid cycle and generates dicarboxylic intermediates and
NADH. High ATP demands is met by increasing mitochondrial mass and more OXPHOS and
endurance exercise can thus increase mitochondrial mass and activity [76]. In this metabolic
pathway NADH is converted to NAD+, FADH2 is converted to FAD+, due to those chemical
reaction, electrons are handed over to O2 with the help of other mobile electron carriers. The
release of energy is used to produce ATP in a highly efficient way. In humans, certain cells are
more dependent on mitochondria energy supply, like hepatocytes, while other cells are more
likely to use glycolysis, like immune cells and embryonic cells when they are in the resting
state [77]. In hepatocytes, mitochondria not only provide energy, but also support substrates to
generate glycogen and lipids for use in the entire body. Low blood lipid levels induce
ketogenesis in liver cells and starvation triggers lipolysis in adipose tissues to provide
peripheral tissues with fuels [78, 79].
2.2 MITOCHONDRIA AND AGING
Mitochondrial loss of function in aging is of increasing interest. Dysfunction of mitochondria
is affecting the metabolism of the aging body. There are some hypotheses of mechanisms that
link the mitochondrial DNA variation/mutations, copy numbers and longevity.
2.2.1 mtDNA variation/mutations and aging
The mtDNA is predominantly maternally inherited, although there are recent reports of
biparental inheritance [80]. The mtDNA may contribute to the heritability of estimated lifespan
[81, 82]. Studies suggest that mtDNA polymorphisms is associated with people’s longevity in
Finnish [83, 84] and Japanese populations [84]. The mtDNA point mutations and deletions
accumulate in an age-dependent manner [85]. In addition, deletions of mtDNA are flanked with
repeats, and often found in elderly living individuals of many species [86-88]. The number of
longer repeats in mtDNA has been shown to restrict the life span in 61 mammalian species
[89].
2.2.2 mtDNA copy numbers and aging
The maintenance of a certain mtDNA copy number is vital for mitochondrial function. Changes
in mtDNA copy number have been linked to life expectancy in humans [90]. A study shows
that mtDNA copy number in peripheral blood mononuclear cells averagely reduce 0.4 copies
each year [91]. The mtDNA copy number decrease age-related in skeletal muscle and this is
more pronounced in males [92]. In contrast, mtDNA increase in liver during aging [92]. High
mtDNA copy number in peripheral blood cells is associated with better health and survival in
elderly people and low mtDNA copy number has poorer prognosis related to cognitive ability,
physical strength, health, and higher mortality [93]. Studies have shown that the mtDNA copy
number and age are strongly correlated with cognitive performance in women, and
furthermore, the mtDNA quantity has been proposed as an early marker of dementia [94].
92.3 ANGIOTENSIN-CONVERTING ENZYME 2 (ACE2)
ACE2 is a membrane-anchored carboxypeptidase, and its discovery was first reported in 2000
[95, 96]. ACE2 converts angiotensin II to angiotensin-(1-7) [97]. The carboxypeptidase activity
both function as an enzyme and as a trafficking regulator for transfer of neutral amino acids in
the intestine [98]. Lack of ACE2 leads to tryptophan depletion in blood [99]. Recently, ACE2
was also found to be the functional receptor of the SARS coronavirus[100].
2.3.1 ACE2 in cardiovascular system
ACE2 is the main enzyme converting angiotensin II to angiotensin-(1-7). The biological
relevance has been shown by administration of encapsulated angiotensin-(1-7) in a slow release
form in animal models, which showed its benefits on cardiovascular function and metabolism,
including antithrombogenic effects [101]. The administration showed several effects including
protection of postinfarction cardiac dysfunction [102, 103], a reduction of the lesion area,
antihypertensive effects [104], and ameliorating type II diabetes mellitus. The heterozygous
ACE2 knockout mice described several cardiac contractility defects and increased angiotensin
II levels [105].
2.3.2 ACE2 expression in different organs in animal models
There are several studies of animal models inhibiting ACE2 or overexpressing ACE2 protein
[106]. Ablation/deletion of ACE2 in the gut of mice resulted in dysregulation of intestinal
antimicrobial peptides, alterations of amino acid homeostasis, and changes of the gut
microbiome [99]. Loss of ACE2 in mice resulted in a decrease of insulin secretion when
exposed to glucose and a cumulative disability of glucose tolerance [107]. Increased human
cardiac ACE2 expression in mice resulted in ventricular tachycardia and sudden death of the
mice [108]. Overexpression of human ACE2 in the kidney had the opposite effect compared
to the heart, with a protective function of ACE2 in podocytes in diabetic nephropathy [109].
ACE2 also plays a particularly important role in the central nervous system. Brain specific
overexpression of human ACE2 in mice attenuated neurogenic hypertension and reduced
angiotensin II-mediated oxidative stress in neuron cells [110], protected heart function in
chronic heart failure through attenuating sympathetic outflow [111], and protected the brain
from ischemia-induced damage [112, 113].
2.4 LIPID METABOLIDM
In recent years, lipid metabolism has gained more attention as important for liver disease,
cancer, and even stem cells metabolism.
2.4.1 Lipid composition
Exogenous lipids through food consumption include triglycerides, cholesterol, free fatty acids
(FFAs), fat-soluble vitamins and phospholipids. Endogenous lipids are synthesized within
cells, and include for example the phospholipids in cell membranes and triacylglycerols
(TAGs) in adipose tissues [114]. Exogenous lipids usually form chylomicrons in the intestine
10and are transported into the body for further use of the lipids or storage (Figure 2) [115]. Lipids
within the body are usually transported by lipoproteins, which includes very-low-density
lipoproteins (VLDL), intermediate-density lipoproteins (IDL), low-density lipoproteins (LDL)
and high-density lipoproteins (HDL). Lipoproteins are synthesized in the liver, and then
circulated through the blood. Lipoprotein carries endogenous triglycerides and cholesterol to
support energy for other organs and tissues [115].
Chylomicrons transport triglycerides and cholesterol to the peripheral tissues [116]. VLDL
export triglycerides from the liver. IDL are the product of lipoprotein lipase processing VLDL.
LDL is the product of VLDL and IDL metabolism. Both IDL and LDL are cleared away by
the liver. LDL can also be taken up by macrophages. HDL are synthesized in both enterocytes
and in the liver [116].
2.4.2 Liver function in lipid metabolism
2.4.2.1 Acquisition of lipids
The uptake of lipids and fatty acids of hepatocytes are mainly from two sources: 1) the dietary
fats are packed into chylomicrons derived from enterocytes in gut, 20% of the chylomicrons
will be transport to the liver, and the liver will hydrolyze the esterified fatty acids into
triglycerides from the chylomicrons [117]. 2) adipose tissue releases the non-esterified free
fatty acids, which will be subjected to lipolysis by the liver during fasting. The hepatocytes can
also generate fatty acids from glucose (de novo lipogenesis) when there is more than enough
glucose in the liver [118].
2.4.2.2 Lipid storage
Triglyceride molecules represent the major form of storage, which are mainly synthesized in
the liver and adipose tissue although partly in the small intestines as well [119]. Triglycerides
synthesized in the liver are stored in cytoplasmic lipid droplets in the form of neutral lipids or
secreted into the bloodstream as VLDL particles [119]. The lipids from the intestine will form
chylomicrons which will also be transported into the liver and skeletal muscle for storage
(figure 2) [120]. Circulating VLDL particles can deliver triglycerides to adipose tissue and
muscle for storage via lipoprotein lipase (LPL) on the capillary endothelial cells [120].
2.4.2.3 Lipid consumption
Very long-chain fatty acids are oxidized within the peroxisomes, while short-chain, medium-
chain, and long-chain fatty acids are oxidized within mitochondria [121]. Mitochondrial
oxidation includes several steps and may not be complete. Incomplete beta oxidation of fatty
acids leads to the formation of ketone bodies [122]. Fatty acid form fatty acyl-CoA in the
endoplasmic reticulum or the outer mitochondrial membrane. Fatty acyl-CoA step by step
finally generates acetyl-CoA through the beta-oxidation pathways. The acetyl-CoA will be
oxidized to carbon dioxide (CO2) in the tricarboxylic acid cycle (TCA). Take palmitic acid (16
carbons) as an example, the whole process finally yields 129 ATP.
11Figure 2. Lipid acquisition and storage
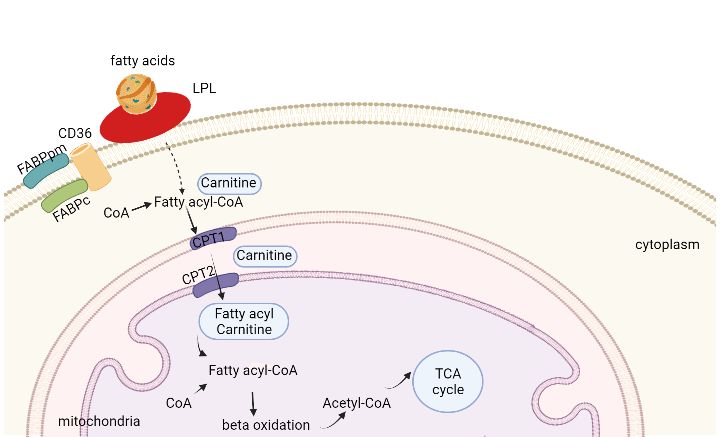
2.4.3 Myocardial lipid metabolism
To sustain continuous contractions, the human heart needs an exceptional amount of energy
per gram of tissue, about 6-30 kg of ATP per day [123, 124]. The healthy heart can adapt fast
during exercise or fever, while the failing heart cannot because of depletion of fuel [125]. In
resting condition, around 70% of the ATP production in the heart is generated from
mitochondrial oxidative phosphorylation of fatty acids [126].
Cardiac cells take up fatty acids in the form of free fatty acids or triacylglycerol within
chylomicrons or VLDL [127]. To facilitate fatty acids uptake, there are three fatty acid
transporters in cardiac cells: cluster of differentiation 36 (CD36), fatty acids transport protein
(FATP), and the fatty acids binding protein plasma membrane (FABPpm)[128].
2.4.4 Lipoprotein lipase
Apoprotein C-II in the capillaries of adipose tissue and muscle tissue, can activate endothelial
LPL which is on the endothelial surface, converting triglycerides to fatty acids and glycerol.
Then the adipocytes and muscle cells take the fatty acids and glycerol for energy or storage.
LPL cardiomyocytes specific transgene mice developed cardiomyopathy due to uptake of
excess amounts of lipids in heart[129]. These results seem to suggest the heart does need a
large amount of lipids for energy, but too much lipids will cause damage to the cardiac cells.
122.4.5 Skeletal muscle function in lipid metabolism
Triglycerides (TGs) is stored in adipose tissue and within muscle fibres. Metabolism demand
during exercise, recovery from exercise, and the lipid availability will decide the fatty acids
uptake in the skeletal muscle [130, 131]. When there are more fatty acids available, the
mitochondria will take the fatty acids as the energy source in priority [132, 133]. In a normal
condition, how much fatty acids enter the cell decides the rate of mitochondrial oxidation[134].
There are also three proteins that support transport of fatty acids from plasma to the skeletal
muscle fiber cells, CD36, FATP[135], and FABP[136]. A study showed that exercise do not
have any effect on the CD36 protein expression when doing regular training no matter women
or men[137]. However, another study showed that the CD36 content increased 36% after
moderate daily aerobic exercise[138]. Later, it was found that exercise does increase the CD36
content in mitochondria but not in sarcolemma[139]. The high fat food intake will upregulate
the CD36 mRNA and protein expression, and thereby stimulate the translocation of skeletal
muscle fatty acids [140]. When the fatty acids enter the skeletal muscle fibers, they will either
be stored as triglycerides or go to mitochondrial oxidation depending on the muscle
condition[141]. Studies show that 8 weeks endurance training will enhance the fatty acid usage
in type 1 fibers (slow twitch fiber)[142]. The whole process is shown in figure 3.
Figure 3 skeletal muscle lipid metaboism
2.5 CANCER CELL METABOLISM
Gene mutations can cause reprogramming of cellular metabolism and result in tumorigenesis
[143]. The reprogramming results in high consumption of glucose and increased production of
NADH and other nutrients for cell viability and the production of new biomass [144, 145]. The
Warburg theory is based on the observation that cancer cells consume large amounts of glucose
in glycolysis, and convert the surplus pyruvate to lactate, which is subsequently secreted into
13the extracellular environment, instead of the more efficient oxidative phosphorylation [143].
This takes place in cancer cells also with fully functioning mitochondria. Despite a large
interest and many studies, the mechanism of the Warburg effect is still unclear[146]. There are,
however, several studies that try to explain the Warburg effect such as a more rapid ATP
synthesis, more efficient biosynthetic pathways and importance for ROS mediated signal
transduction[146]. In recent years many studies show that mitochondrial function is important
for cancer cells. Mitochondrial DNA depletion reduces the chances of tumor generation in
cancer cell lines in vitro and in vivo [147-149]. Lung cancer cells like A549 cells have powerful
mitochondrial functions with high ability to balance the cellular redox state. Mitochondria
benefits cancer cell survival in severe conditions, like hypoxia, lack of nutrition, and cancer
treatment, so it plays a key role in tumorigenesis [150].
2.6 METFORMIN
2.6.1 Metformin in diabetes
Metformin has been widely used as a drug for treatment of type 2 diabetes for over 50 years. It
is recommended as a first line medicine for newly diagnosed type 2 diabetes patients [151]. Its
anti-diabetic effects are through lowering the hepatocellular gluconeogenesis [152]and through
improving the utilization of glucose by peripheral tissues, such as adipose tissue and skeletal
muscle [153].
2.6.2 Metformin action on mitochondrial complex I in cancer
In recent years, epidemiology has indicated that metformin slows down tumor growth and
lowers the risk of tumorigenesis [154-158]. This has been confirmed by studies both in vitro
and in vivo. Now it is generally acknowledged that metformin’s activity on mitochondria is due
to the pleiotropic effects of the drug[159]. The mechanisms of metformin effects on cancer
cells are intensively studied but still not fully understood. Results from studies suggest that
metformin has inhibitory effects specifically on mitochondrial complex I of the mitochondrial
respiratory chain [156-158] and thereby lowers the level of NAD+ /NADH ratio [160]. There
are studies that indicate that it may be the NAD+ level that alters tumor growth, and thus the
metformin action is to alter the level of NAD+ through mitochondrial complex I.
Metformin inhibition of the mitochondrial respiratory chain complex I, the mitochondrial ATP
synthesis, and oxygen consumption has been confirmed in several models, including mouse,
rat, and human primary hepatocytes [156, 158, 161], liver cancer cell lines, and adrenocortical
carcinoma derived cell lines [162-164], endothelial cells [165], pancreatic beta cells [166],
neurons[164], peripheral blood mononuclear cells and platelets [167], and in cancer cells and
cancer stem cells as well [157, 168-170].
The inhibition of mitochondrial complex I results in cellular ATP concentration decrease.
This subsequently influences the ADP/ATP and AMP/ATP ratios, which actives the energy
sensor AMPK [159].
142.7 THE SLC25A10 MITOCHONDRIAL CARRIER
SLC25A10 is a mitochondrial carrier located in the inner mitochondrial membrane,
transporting malate and succinate out of mitochondrial, in exchange of phosphate and
thiosulfate. SLC25A10 has recently been shown to be a key factor involved in lipid synthesis
[171], supporting malate for the transport of citrate which is required for the synthesis of fatty
acid[172]. Data from our lab showed that an A549 SLC25A10 knockdown cell line shifted the
metabolism from glycolysis to oxidative phosphorylation and also increased the sensitivity of
the cells to certain anti-cancer compounds [173].
153 RESEARCH AIMS
The general aim of the thesis is to gather knowledge on the connection between the nuclear
encodes proteins and mitochondrial function, and to investigate nuclear-mitochondria
interaction in vivo and in vitro.
• To study how the mitochondrial transporter SLC25A10 is regulated in the presence of
metformin (Paper I).
• To construct and characterize a DGUOK complete knockout mouse model, with the
aim to create a model for treatment strategies of DGUOK deficiency, as well as for
other disorders with mtDNA depletion (Paper II).
• To investigate the molecular mechanisms that enabled the extended survival of the
DGUOK complete knockout mice (Paper III).
• To construct and characterize a cardiac and skeletal muscle specific knockout of TK2,
since muscle tissue is primarily affected with mtDNA deficiency in humans with TK2
disorders (Paper IV).
• To construct and characterize a liver specific TK2 knockout mice model for
investigations of liver mtDNA deficiency and its effects on the pathology and life
expectancy of the affected mice (Paper V).
174 MATERIALS AND METHODS
4.1 MATERIALS AND REAGENTS
DNA extraction kit (Qiagen, DNeasy Blood & Tissue Kit 69506), RNeasy Kit (Qiagen, 74106),
RNeasy Fibrous Tissue Mini Kit (50) (Qiagen, 74704), Absolute quantification PCR with
KAPA PROBE Fast Universal Kit (Sigma: KK4702), cDNA synthesis kit (Applied
Biosystems, Life Technologies Corporation 4368814), KAPA SYBR® Fast qPCR Master Mix
(2X) Universal (Kapa Biosystems, Merck KGaA, KM4602), lactate assay kit (Sigma,
MAK064-1KT), Cell Proliferation Kit II (XTT) (Sigma: 11465015001), MitoSOX™ Red
(Thermofisher, M36008).
Rabbit polyclonal to ACE2 antibody (Abcam Inc, Ab15348), mouse monoclonal to MTCO1
(Abcam Inc, ab14705), anti CD68 (marker of macrophages) antibody (Life Technologies,
MA5-16363) from Thermo Fisher Scientific, anti CD31 (platelet endothelial cell adhesion
molecule) antibody (Abcam Inc, ab28364) from Abcam, anti VDAC antibody (Santa Cruz
Biotechnology, sc390996), donkey anti rabbit with HRP (Santa Cruz Biotechnology, Inc. sc-
2313), Dako Polyclonal Rabbit anti-Mouse Immunoglobulins/HRP (Santa Clara, CA, P0260).
Dry ice from Karolinska hospital, isopentane(2-methylbutane) from Sigma-Aldrich, 277258
CAS:78-78-4, cryostat embedding solution from Sakura Finetek Tissue, Tek 4583. rabbit anti-
ADFP antibody (ab78920), anti-Ki-67 (Abcam; ab92742), Mouse anti-beta actin (Santa Cruz)
or rabbit-anti-VADC (Abcam).
Dulbecco’s Modified Eagle's medium (DMEM) (Life Tech, REF 31966), 10% FBS (Gibco,
ref 10270), 1000 U/ml penicillin and 1000 μg/mL streptomycin (Thermo Fisher, ref 15140).
Fetal bovine serum (FBS, REF: F0392), Metformin (1, 1-dimethylbiguanide hydrochloride)
(Sigma, PHR1084), N-acetylcystein (NAC, negative control) (Sigma, A7250), (±)-6-
Hydroxy-2,5,7,8-tetramethylchromane-2-carboxylic acid (Trolox, negative control) (Sigma,
238813-1G), 4β-phorbol 12-myristate 13-acetate (PMA, positive control) (Santa Cruz, sc-
3576B), Rotenone (Sigma, R8875); PKM2 inhibitor compound 3 k (Sigma,
AMBH303C6BA3); DASA-58 (Sigma, SML2853); Serine (Sigma, S4500), Methanol, HPLC-
grade was obtained from Fischer Scientific, Chloroform, Suprasolv for GC was obtained from
Merck, Stable isotopes internal standards: L-proline-13C5, alpha-ketoglutarate-13C4, myristic
acid-13C3, cholesterol-D7 were obtained from Cil. Succinic acid-D4, salicylic acid-D6, L-
glutamic acid-13C5,15 N, putrescine-D4, hexadecanoic acid-13C4, D-glucose-13C6, D-
sucrose-13C12 were obtained from Sigma.
4.2 METHODS
The methods for the experiments in lab used in this thesis are well established methods. Cell
culture techniques were done in a P1 lab, DNA (excellent quality) extraction, RNA extraction,
19and cDNA synthesis followed the protocol from the kit. Hotshot method DNA extraction, and
polymerase chain reaction (PCR) were used for genotyping. Western blot was used for protein
expression studies, and real time PCR (qPCR) for mtDNA copy number determination and
gene expression profiling, serum biochemistry analysis, are all described in detail in papers I,
II, III, IV, and V. Histopathology and immunohistochemistry analysis of mouse tissues using
microscopy, confocal microscopy, and electron microscopy was performed in collaboration
with the Division of Pathology, Department of Laboratory Medicine, Karolinska Institute.
4.2.1 Transgene constructs
4.2.1.1 DGUOK KO mice construct
To generate DGUOK KO mice, 129S6/SvEvTac mice DNA were used as a vector to replace
the DGUOK (NM 013764.2) gene in 129/SVJ mice embryonic stem cells. A clone (RPCI22-
274F23) from bacterial artificial chromosome library that contained exon II and part of exon
III of the Dguok gene was identified. Those Dguok genes were subcloned into a pBluescript
plasmid vector with extra designed two complementary oligonucleotides including multiple
restriction enzyme sites, Neo cassette and two LoxP sites. The targeting vector was
electroporated into 129/SVJ embryonic stem cells, continued with gentamicin selection and
southern blot screening. For heterozygous DGUOK knockout mice, the exon II and neomycin
cassette were simultaneously deleted after the new generation born, by breeding Dguok+/Neo-
loxP mice with transgenic mice expressing Cre recombinase. The Dguok +/- knockout mice
were intercrossed to generate homozygous Dguok -/- mice.
4.2.1.2 Cardiac and skeletal muscle specificTK2 knockout mice construct
With homologous recombination, original TK2 exon V were replaced with exon V additionally
two loxp sites, two flp sites, and a neo cassette, were inserted in the mouse stem cells to generate
TK2 conditional knockout mice. TK2loxP/TK2loxP mice with neo cassette depletion were mated
to heterozygous transgenic mice (+/Ckmm-cre). Double heterozygous (+/TK2 loxP, +/Ckmm-
cre) mice were backcrossed with TK2 loxP/TK2 loxP strain to generate tissue specific knockout
mice (TK2-/-, +/Ckmm-cre).
4.2.1.3 Liver specific TK2 knockout mice construct
TK2 conditional knockout mice were generated by using homologous recombination with
replaced modified TK2 exon V (with additionally two loxp sites, two flp sites, and a neo
cassette). TK2loxP/TK2loxP mice with a deleted neo cassette were mated to heterozygous
transgenic mice (+/liver-cre) to generate double heterozygous mice. Double heterozygous
(+/TK2 loxP, +/liver-cre) mice were cross breeding with TK2loxP/TK2loxP strain to generate the
liver tissue specific knockout mice (TK2-/-, +/liver-cre).
4.2.1.4 Ethical consideration
All studies in the thesis were honest reported data, results, methods and procedures, and
publication status. No studies involved any human or patient’s data. In paper I a commercial
20cancer cell line was the only study object. Paper II to V used mice model as the study objects. All animal experiments were approved and performed following the guidelines of the local ethical committee (B101–15) and (6487-2021). 4.2.1.5 Determination of fat volume with CT scan and muscle strength PET CT scan was used to analyze the 16 weeks old, sacrificed mice. The Analyze 12.0 software from AnalyzeDirect was used to determine the 3D volumes of fat, skeletal muscle, and heart. The control group and cardiac and skeletal muscle Tk2 knockout mice muscle strength was measured, with 5 mice included in each group. The animals were tested for muscle strength for a maximum of 2 minutes and then let them free. The mice were tested every week between 4 to 16 weeks of age and were sacrificed when they showed low body weights or other conditions according to the ethical permit. 4.2.1.6 Gene expression determined by microarray The experiment was performed with Mouse GENE 2.2-ST Array and the data use analyzed by the Qlucore Omics Explorer version 3.2. Two-group comparison was performed using unpaired student’s t-test and cluster analysis (k-means) with false discovery rate (FDR) adjusted at P(q)
5 RESULTS AND DISCUSSION
In study I, cell growth experiment results showed that wild type A549 cells consumed nutrition
faster in the medium and reached the growth plateau earlier than the siSLC25A10 cells. The
proliferation marker Ki-67 was investigated in 4.5, 1.0, and 0.1g/L glucose concentration in
presence of 5 mM metformin. The results showed that proliferation was inhibited mostly in
0.1g/L glucose, indicating that Ki-67 gene expression was dependent on glucose in the presence
of metformin. The siSLC25A10 gene expression and protein level were tested in cells grown
in 4.5, 1.0 or 0.1g/L glucose and 5mM metformin as well, showing an inhibitory effect of
SLC25A10 expression especially in 0.1 g/L glucose medium.

Expression levels of the metabolic enzymes pyruvate dehydrogenase (PDH), lactate
dehydrogenase (LDH), and glutamate dehydrogenase (GDH) were investigated 24 h after
addition of metformin. Compared to the control A549 cells, PDHA, but not PDHB, was
significantly augmented in the siSLC25A10 cell line, with and without metformin. GDH was
not significantly changed compared to the untreated cells in both cell lines, although the
average level in siSLC25A10 cell lines was higher, with and without metformin. Both LDHA
and LDHB increased their expression in siSLC25A10 cells. The high expression of PDH and
LDH in siSLC25A10 cells, indicated a fast use of glucose in glycolysis. The expression of
GOT1 increased in the siSLC25A10 cells, whereas it decreased in control A549 cells. This
suggested that in siSLC25A10 cells, grown in 0.1g/L glucose with metformin, aspartate was
converted to oxaloacetate and thereafter goes back to mitochondria to generate ATP, with the
final purpose to keep the cell surviving. The significant increase of the cyclin-dependent kinase
inhibitor (CDKN1A) p21 gene in the siSLC25A10 cells suggested an arrest of the cell cycle
following the decrease of SLC25A10 expression in the presence of metformin. Metformin
stimulated mitochondrial reactive oxygen species (ROS) production at low glucose
concentration but not at high glucose concentrations. These results indicated that siSLC25A10
cells could be more dependent on mitochondrial function than the control cells, both with and
without metformin. The BioGRID database shows that the SLC25A10 protein is deeply
interactive with the mitochondrial NADH dehydrogenase (Ubiquinone) 1 alpha subcomplex,
4 (NDUFA4) gene, which is part of mitochondrial complex I. This may contribute to the results
that siSLC25A10 cells were more affected by metformin, since metformin is generally
accepted to target complex I [174]. However, the mechanisms om metformin is still not clearly
elucidated.

In study II and study III, a model of DGUOK knockout mice was generated to study the
molecular mechanism of DGUOK deficiency and to explore novel treatment strategies. The
Dguok complete knockout mice (Dguok−/−) were born normal, but the body weight began to
drop at week 6. Multiple tissues showed a mtDNA copy number decrease, with liver as the
most severely affected organ among the tissues investigated. The mtDNA related cytochrome
c oxidase protein was decreased, while the nuclear encoded protein succinate dehydrogenase
complex subunit A was unaffected. The subcutaneous fat layer in Dguok−/− mice was not
visible by eye, suggesting an altered lipid metabolism. The Dguok−/− mice, especially the

                                                23
female mice could survive for one year. This phenomenon was studied by using
transcriptomics, proteomics and metabolomics followed by in vitro assays, aiming to illustrate
the mechanism of this extended survival. We found that serine synthesis and increased folate
cycle supported the early stage of the Dguok−/− mice. The TCA cycle and the urea cycle were
highly functioning to fuel the body. Two pyruvate kinase genes, PKLR and PKM, showed
increased expression, suggesting that this was to support the TCA cycle. The mechanism of
how the DGUOK knockout mice could survive long indicated the strong compensation ability
in liver. The invisible adipose tissue also supported the mechanism that the DGUOK knockout
mice has used the energy to maintain living activity instead of storing the energy as fat in body.
In study IV and study V, we have generated a cardiac and skeletal muscle specific TK2
knockout mice, and a liver specific TK2 knockout mice. The mtDNA copy number was
specifically decreased in the targeted tissue. The mTK2 KO mice body weights decreased and
survived about 16 weeks, but the livTK2 KO mice showed normal body weight, and could
survive for more than one and a half years. The body weight loss of mTK2 KO mice was mainly
due to loss of adipose tissue and a decrease of muscle volume. We further found an altered
lipid metabolism in mTK2 KO mice and histopathology results showed damage in the cardiac
and skeletal muscle tissue. In the livTK2 KO mice, only the hepatocytes mtDNA copy number
dropped and no other symptoms were observed. The comparison of these two knockout mice
indicated the heart and skeletal muscle relying on the mitochondrion function very much. Only
liver mtDNA deficiency could be compensated and do not show any symptoms. The mTK2
KO mice showed dilated heart and with ACE2 highly expressed in cardiomyocytes. Since
ACE2 is the SARS-CoV-2 receptor, fragile patients with heart failure may be even more
susceptible to infection with SARS-Cov-2 if the receptor of the virus is up regulated. If
mitochondrial dysfunction contributes to poor prognosis of corona virus infection has not yet
been clarified.
24You can also read


