Powering Homes Today, Powering Nations Tomorrow - Ocean Energy ...
←
→
Page content transcription
If your browser does not render page correctly, please read the page content below

Powering Homes Today,
Powering Nations Tomorrow
Policy Solutions to Deliver Ocean Energy Industrial Roll-Out

     This project has received funding from the European Union’s Horizon 2020
     research and innovation programme under grant agreement No 727483
                                                                                An Integrated Strategy for
                                                                                 the ocean energy sector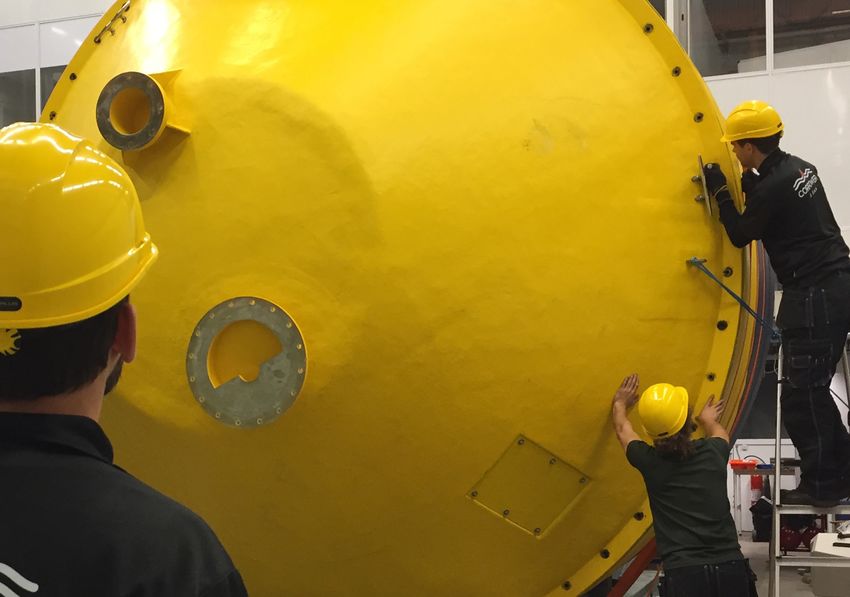
LEAD AUTHORS Donagh Cagney, Remi Gruet, Ocean Energy Europe GRAPHIC DESIGN JQ&ROS Visual Communications The European Commission support for the production of this publication does not constitute an endorsement of the contents which reflects the views only of the authors, and the Commission cannot be held responsible for any use which may be made of the information contained therein. Document to be cited as ETIP Ocean (2019), ‘Powering Homes Today, Powering Nations Tomorrow’ ACKNOWLEDGEMENTS ‘ETIP Ocean was managed during this time by Ocean Energy Europe (OEE) in partnership with the University of Edin- burgh, representing the European Energy Research Alliance (EERA).’ Valuable information and feedback was received from members of the ocean energy sector, and in particular the ETIP Ocean Steering Committee, via workshops and webinars during 2017-2018. Photographic content Images used with kind permission of the following organisations, not to be copied without their prior agreement: Albatern, Andritz, AW Energy, Basque Country Energy Agency, BiMEP, CorPower Ocean, EC Joint Re- search Centre, Engie, EMEC, Fred Olsen, HydroQuest, Laminaria, Minesto, Naval Energies, Nova Innovation, Oceantec – Idom, Orbital Marine Energy, REDStack, Resen Waves, Sabella, SIMEC Atlantis Energy, Schottel Hydro, Sustainable Marine Energy, Tidal Lagoon Power, Tocardo, Wello Oy. 2 Powering Homes Today, Powering Nations Tomorrow

CONTENTS

 Executive summary                                                                        4

 PART I – Europe needs Ocean Energy                                                       9

 PART II – State of the technology                                                      12

      1. Tidal stream – Delivering GWh of power on demand while seeking market visibility 13
      2. Wave energy – A step-by-step approach to prototype development                  19
      3. OTEC & SWAC – Developing onshore to exploit synergies and lower costs           23
      4. Salinity Gradient – Research at scale                                           25
      5. Tidal range – Proven technology, commercial with revenue support                26

 PART III – Key innovations to progress Ocean Energy
            through 5 phases of development                                             27

 PART IV – Challenges in financing innovation,
           from early stage to commercialisation		                                      32

      R&D and prototypes: Financing projects that do not make a return                   33
      Demonstration and Pre-Commercial farms: Removing technology risk,
      lowering costs of capital and providing market visibility                          35
      Industrial Roll-out: Reducing costs through volume                                 38
      Across all stages: Licensing and consenting, mandatory steps for any project       40

 PART V – An Integrated Strategy: actions required to develop
          technology from early research to industrial roll-out                          43

      Action 1- R&D and Prototype: Finalise an EU-wide stage-gate programme
      while keeping grant funding                                                        44
      Action 2 - Demonstration and Pre-commercial farms:
      A blend of grant & financial instruments for projects to reach financial close     45
      Action 3 - From Demonstration to Industrial roll-out:
      revenue support as only way to fully finance projects                              47
      Action 4 - A set of initiatives to generate data and best practice
      for licensing and consenting                                                       48

      Sources                                                                           49
EXECUTIVE SUMMARY

         Europe needs Ocean Energy
         Europe has a rich source of clean, predictable ocean energy, which today remains largely un-
         tapped. The ocean energy industry estimates that 100GW of wave and tidal energy capacity
         can be deployed in Europe by 2050, meeting 10% of Europe’s current electricity needs.

         Ocean energy produces electricity at different times from wind and solar. It is an essential
         solution to help a variable wind and solar production match with a variable power demand
         every hour of the day. This will become increasingly valuable as Europe reaches 80%-100%
         renewable electricity.

         Ocean energy is a new industry, that can deliver 400,000 EU jobs by 2050, billions of euros
         in exports, and industrial activity – specifically in coastal regions, where this is most needed.

         5 innovative technologies,
         ranging from R&D to pre-commercial stage
         Tidal stream – In recent years, tidal stream supplied record volumes of predictable power.
         New projects are being deployed in Europe and across the globe, with economic impacts al-
         ready visible across the supply chain.

         Wave energy – Several promising prototypes have been deployed or will reach European
         waters in 2019. They target different wave climates and markets, and are stimulating the
         first wave energy industrial clusters. Step-by-step approaches are producing fewer but more
         effective technologies.

         OTEC & SWAC – Ocean Thermal Energy Conversion (OTEC) projects now focus onshore, to
         reduce costs and benefit from economies of scale. Sea Water Air Conditioning (SWAC) is more
         advanced and is already servicing commercial districts and data centres in Europe.

         Salinity Gradient – Small scale prototypes aim to prove the technology and reduce costs to
         enable scaling-up.

         Tidal range – A proven technology, tidal range is commercial with revenue support. The infra-
         structure works needed can provide additional benefits, such as tourism or costal protection.
         Industrial roll-out will be triggered by the right policy conditions.

4 Powering Homes Today, Powering Nations Tomorrow
Challenges to financing innovation across 5 stages
of development
R&D AND PROTOTYPES: FINANCING PROJECTS THAT DO NOT MAKE A RETURN

The objective of R&D and prototype deployments is to generate learnings and allow further
innovation. Such projects do not generate returns, so a high percentage of grant funding is
thus required - often up to 100%.

Grant funding through Horizon 2020 or national programmes has been rather successful in
bringing innovations from design to full-scale sea-worthy prototypes. Rationalisation is still
possible to optimise public expenditure, reward innovative success, and avoid duplication of
R&D activities. Such a ‘stage-gate’ solution is currently running in Scotland. Action 1 presents
which benefits a European approach could bring.

DEMONSTRATION AND PRE-COMMERCIAL FARMS: REMOVING TECHNOLOGY RISK, LOWER-
ING COSTS OF CAPITAL AND PROVIDING MARKET VISIBILITY

The objective of demonstration and pre-commercial farms is to standardise technology and
validate the business model. Technological or business uncertainties remain at those stages,
in manufacturing, installation and operation. Those uncertainties constrain access to finance,
except for more risk-savvy institutions or programmes, who require much higher returns than
for commercial technologies.

To attract investors, those projects must be able to repay interests on loans and dividends on
equity. The price of electricity is not sufficient to generate those returns, as all innovative tech-
nologies require economies of scale to reduce costs. A ‘top up’ on power sales is thus needed
to allow the project to secure further investments.

Beyond financial institutions, OEM and utilities also require future market visibility to justify
riskier investments into a new industry. Energy policies such as renewable energy targets,
decarbonisation strategies and tendering processes, are essential to provide them with the
necessary market visibility.

                                                          Powering Homes Today, Powering Nations Tomorrow 5
INDUSTRIAL ROLL-OUT – REDUCING COSTS THROUGH VOLUME

        At industrial roll-out, the objective is to use volumes to drive down costs. Economies of scale
        will allow ocean energy to achieve the same dramatic cost reductions as wind and solar, given
        the similarity in business models. This can only be achieved with good market visibility, which
        justifies investments into production facilities and incremental R&D.

        As for Demonstration and Pre-commercial projects, revenue support beyond electricity market
        prices is required to harness investor finance. Utilities and independent financiers will not en-
        gage if they cannot make a minimum return on projects. OEMs will not engage if they do not
        see a pipeline of orders that justifies the initial investment and ramp-up of production.

        Revenue support, earmarked for ocean energy, will make projects financeable, and will demon-
        strate to OEMs that there is market for their products, as presented in Action 3.

        ACROSS ALL STAGES: LICENSING AND CONSENTING MANDATORY STEPS FOR ANY PROJECT

        Deploying devices in the ocean enables to develop the technology and learn about potential
        impacts, while respecting local environments and communities.

        Licensing and consenting authorities must strike the right balance between protecting against
        potential risks and allowing ocean energy deployments to happen so they can generate learn-
        ings. Initial studies show no significant impacts on the environment from ocean energy, though
        monitoring must continue as more devices are put in the water.

        Action 4 highlights how better data collection, sharing best practices and a more structured
        ‘adaptive management’ approach to decision-making will strengthen ocean energy licensing
        and consenting.

6 Powering Homes Today, Powering Nations Tomorrow
An Integrated Strategy: actions required to develop
technology from early research to industrial roll-out
Part V of this document lays down 4 actions required to get the sector to commercial roll-out.
They will create the right policy framework for each of the 5 development phases that devices
must pass through to reach commercialisation.

ACTION 1 – R&D AND PROTOTYPE: FINALISE A EUROPE-WIDE STAGE GATE PROGRAMME
WHILE MAINTAINING CLASSIC GRANT FUNDING

The establishment of a European stage-gate programme will further improve an already well
functioning funding structure for those stages. This action is informed by discussions with na-
tional governments, the European Commission and academia, and follows the positive results
achieved by an existing national scheme: Wave Energy Scotland.

In a stage-gate programme, grants are awarded via a series of competitive calls, covering up
to 100% of costs. Calls target improvements in devices, components and sub-systems, and
are assessed according to clear metrics and standards. The programme works like a funnel
for the most successful innovations: manufacturers compete, with each call awarding more
funding to fewer applicants until only the best devices, components or sub-systems remain in
the programme.

A pan-European programme would be more cost-efficient, and avoid duplication of R&D.

ACTION 2 – DEMONSTRATION AND PRE-COMMERCIAL FARMS: A BLEND OF GRANT & FINAN-
CIAL INSTRUMENTS TO HELP PROJECTS REACH FINANCIAL CLOSE

A blend of financial instruments is needed to finance demonstration and pre-commercial
farms, as no private party will invest without return and visibility on future markets. Such
instruments should include:

 • Grant funding – to reduce the total financing requirement and cost of finance

 • Public-supported equity – to improve access to capital, and lower cost of finance. Public equi-
   ty can price risk more appropriately – and thus facilitate project financing. The EU Investment
   Platform scheme is an example.

 • Public-guaranteed loans – to improve access to capital, and lower cost of finance. Loans can
   be guaranteed by public bodies – such as the EU Innovfin EDP scheme – to enable lower
   rates than with commercial lenders.

 • Insurance & Guarantee Fund – to cover technical risk, reduce financial exposure and allow
   private investors to fill the remaining financing gap at lower cost.

 • Revenue support – to finance OPEX, interests from debt and dividends for equity

Those instruments can ideally be used in combination, as each reduces total finance needs,
whether upfront or annual. This ensures best use of available public funding. Reaching finan-
cial close without the entire blend of programmes is possible, yet it means the other available
programmes will have to provide proportionally more.

                                                        Powering Homes Today, Powering Nations Tomorrow 7
ACTION 3 – FROM DEMONSTRATION TO INDUSTRIAL ROLL-OUT: REVENUE SUPPORT AS
         ONLY WAY TO FULLY FINANCE PROJECTS

         National-level revenue support earmarked for ocean energy will allow projects to deploy. Man-
         ufacturing of large numbers of devices will reduce the cost per kWh – as has happened with
         wind and solar.

         Several options are available to design effective revenue support mechanisms: competitive
         auctions in reserved ‘pots’, Feed-In-Tariffs, tax credits for private Power Purchase Agreements,
         etc. Support should slowly move from low volumes at higher €/kWh, to larger volumes at lower
         €/kWh. Capacity limits can be set to control total budgets. Further clauses can ensure support
         levels that avoid overcompensation.

         ACTION 4 – A SET OF INITIATIVES TO GENERATE DATA AND BEST PRACTICE FOR LICENSING
         AND CONSENTING

         Better data and best practices will empower licensing and consenting authorities to allow
         ocean energy deployments while still protecting local environments.

         Programmes to monitor the environmental impacts of projects across Europe will produce
         comparable and consistent data for authorities. The sharing of best practice will allow au-
         thorities to learn from their peers and to develop similar processes across Europe. An ‘Adap-
         tive Management’ approach can empower authorities to protect local environments while still
         gathering data on deployments to make better decisions in the future.

         Action 2 proposes a blending of solutions to those challenges.

8 Powering Homes Today, Powering Nations Tomorrow
PART I

Europe needs Ocean Energy

EUROPE NEEDS OCEAN ENERGY
                           BY 2050

 10% of Europe’s                               Predictable                                Jobs & economic
  energy needs                                  energy to                                  development in
    by 2050                                   complement                                    coastal areas
                                            other renewables
 OCEAN ENERGY RESOURCE ESTIMATES           RENEWABLES PENETRATION: 80%-100%              OCEAN ENERGY CAN DELIVER...

                                                                                               400,000 jobs
                                                                                                       by 2050
           100GW                                  Driven by the moon
            Capacity
                                            100% predictable
                                                    Years in advance
      10% of Europe’s
                                              Europe in 2050 must become very
     power consumption                      different from today to reach net zero           Ocean energy can deliver skilled
                                            carbon emissions.iii Much more of the               400,000 jobs by 2050v.
   Europe has a rich source of clean,       economy will be electrified. Wind and
 predictable ocean energy, a valuable       solar energies will form the backbone         These jobs will cluster along Europe’s
 resource, which as of today remains         of the electricity system. Renewable           coastline, close to where the first
 untapped. The ocean energy industry       penetration will reach up to 80%-100%           ocean energy farms are deployed.
estimates that 100GW of capacity can                       of supply.iv
 be deployed in Europe by 2050. This
target is consistent with recent studies
                                                                                            GROWTH           OPPORTUNITIES
                                            To balance this variability, more flexible
 on the practical deployment potential      electricity sources will be needed. Tidal
  of ocean energy in Europe. Globally,       stream and wave energy produce at
the market for ocean energy could see         different times from wind or solar,
337GW of installed capacity by 2050i.        making them an ideal complement to
                                                       those technologies.

                                             Driven by the moon, the energy that
                                               tidal stream and tidal range can
                                            harness is 100% predictable, years in
           337GW                            advance. Waves can also be predicted
                                           with high accuracy as they are created
     Installed Capacity                     by the wind and persist long after the
   Wave and Tidal Energy                   wind is gone. OTEC and salinity gradient
                                           can deliver non-stop power, and can be
                                                ramped up or down as needed.                 This means economic activity for
 100GW of ocean energy could meet
                                                                                          Europe’s coastal regions. It means the
    around 10% of Europe’s power
                                               Ocean energy’s production profile          revitalisation of the infrastructure and
   consumption.ii This is as much as
                                                 means that it becomes most                supply chains that serviced historical
  standard hydro-electric dams are
                                               valuable as Europe completes its             sectors such as shipbuilding, fishing
producing today. And it will be needed,
                                              energy transition, and more variable          and oil & gas. And it means growth
 as Europe’s energy transition further
                                            renewables are connected to electricity       and opportunities for Europe’s coastal
             accelerates.
                                                            systems.                                    communities.

    10 Powering Homes Today, Powering Nations Tomorrow
European export Security of supply Benefit for
leadership and avoided EU islands
imports bill for
fossil fuels
EUROPEAN PATENTS HAVE LITTLE TO NO VISUAL IMPACT
66% 44%
Tidal Wave
Europe is already a global leader in
ocean energy technology. The latest info
shows that Europe has 66% of global
tidal energy patents, and 44% for wave
energy.vi Most projects around the globe
use European technology1.
Europe can now translate this into
export success, and dominance of a
market worth €53bn annually.vii Tidal currents and waves are usually
EUROPEAN CAN SAVE
strong around and between islands,
making them a prime location to extract
the most electricity via ocean devices.
EUROPE CAN DOMINANCE
The high cost of electricity from diesel
A MARKET OF €2
66 generation on islands – 300-600€/
BN
€53BN ENERGY
IMPORTS
A YEAR
MWh – makes ocean energy already
appealing today, in some cases, even
competitive. Producing at different
ANNUALLY
times from wind and solar, they are an
ideal complement to balance small or
independent grid systems.
In doing so, Europe will be building on
successes already achieved within the Europe cannot afford to indefinitely
Ocean energy technologies have little
wind sector. By 2015 European wind rely on geopolitical competitors,
to no visual impact, preserving the
turbine manufacturers had supplied autocratic regimes and unstable
landscape and touristic value of the
49% of cumulative global wind regions for its energy needs.
environment. Installed offshore, they
capacity.viii The EU now consistently leave land use best used for other
exports €7bn-€8bn of wind energy The continent has been blessed with
economic activities – e.g. tourism. In
goods and services each year.ix some of the greatest ocean energy
many cases installation makes use of
resources in the world. Harnessing this
the local economy and skills – the more
energy sources will play an important
industrialised the island, the more local
role in building an energy-independent
content!
Europe. It will slash the €266bnv that
Europe spends each year on energy
imports.x
1
For example European developers hold all the berths in Canada’s Bay of Fundy test site. Developers such as Wello, Sabella and Tocardo have
projects in Indonesia. European wave developers are installing devices in Hawaii.
Powering Homes Today, Powering Nations Tomorrow 11PART II State of the technology
1.
                                  TIDAL STREAM
                 Delivering GWh of power on demand
                    while seeking market visibility
 Europe has achieved a technological breakthrough in tidal stream during the past 2 years:
  predictable power is being generated, and the technology’s nascent economic impact is
                   becoming clear. An export market is also developing.

Major progress on electricity and data generation
from pilot projects
2017-2018 have been breakthrough years for tidal         first tidal arrays which are delivering on their poten-
stream. European homes and businesses are being          tial - individual demonstration projects have equally
powered by tidal energy. It is not only the world’s      achieved major successes.

                                                      ◁ Installed in 2017, Orbital Marine Energy’s device
                                                         generated more than 3GWh hours during its year-
                                                         long deployment in the North Sea.xi

 In October 2018 Sabella redeployed its turbine off    ▷
 Ushant Island in Brittany France. On average the
 turbine provides 15% of the island’s energy needs
 and this can increase to 50% when required.xii

                                                      ◁ Since late 2015, Tocardo’s 5 turbines have been
                                                         powering 1000 Dutch homes from tidal flows
                                                         through the Eastern Scheldt storm barrier.

                                                                Powering Homes Today, Powering Nations Tomorrow 13
◁ Nova Innovation is doubling the size of the world’s
first tidal array. The array has delivering baseload
power to the grid. The first turbine was installed in
March 2016.
MeyGen is the world’s largest tidal farm, powered ▷
by 4 turbines developed by Andritz Hydro
Hammerfest and SIMEC Atlantis Energy installed end
2016. Over 12.5GWh have been generated at time
of publication.xiii
Tidal stream’s recent record of power production shows been generated by tidal stream since the start of 2017
just how far the technology has come. More power has than in the previous 13 years combined.
40
35
30
25
20
15
10
5
-
2003 2005 2008 2010 2012 2014 2016 2018
Source: Ofgem Renewables and CHP Register, public releases from developers, information supplied to OEE by developers
Fig. 1 - Cumulative GWh produced by tidal stream in Europe, 2003 - 2018 xiv
Power production from those projects has been con- Europe’s electricity grid, and will become increasingly
sistently confirming the predictability of tidal stream. important as even more power from variable renew-
Predictability makes it easier and cheaper to balance ables such as wind and solar comes online.
14 Powering Homes Today, Powering Nations TomorrowARRAY PRODUCTION
6000
POWER (kW)
5000
4000
3000
2000
1000
0
Fig. 2 - Power generation at the MeyGen tidal farm reflects the flows of the tides. As the tide gathers pace,
more power is generated. Power production peaks when water is flowing at its fastest. During the short
periods of high and low tide, there is no water movement, and so no power is generated.xv Power production
varies because there is a natural rhythm of more powerful ‘spring tides’ and less powerful ‘neap tides’.
Tidal’s predictability and guaranteed short cycle times when it is most needed. Nova Innovation are already
make it the perfect partner for energy storage. The providing this grid service to make tidal array includes
time period between tides is very short, so only a small an integrate battery pack.xvi Sabella has integrat-
volume of storage cans enables a device or array to ed a battery with its turbine at Ushant Island, which
deliver baseload load power on a continuous basis or smooths the power fluctuations that waves can create.
Now that the first range of tidal stream turbines has Many of these projects were originally planned for
been tested and proven, the industry is developing the Europe. But project developers are increasingly being
next phase of projects. attracted abroad, by more favourable market oppor-
tunities.
These will be essential to test new machines, to de-
risk the technology, and to further reduce energy costs.
Powering Homes Today, Powering Nations Tomorrow 15MARKET DEVELOPMENT IN EUROPE….
◁ HydroQuest plans to deploy its 1MW device at EDF’s
Paimpol-Bréhat site in 2019. The grid-connected
site will allow HydroQuest to test their turbine for an
initial 12 month period.
Sabella plans to deploy 2 additional 0.5MW turbines ▷
at their Ushant Island site. These are part of a wider
project to power the island via a combination of tidal,
wind, solar and storage.
◁ SIMEC Atlantis Energy plans to install two extra
turbines of up to 2MW each at the MeyGen site in
2019, and are working towards another expansion.
The MeyGen project is permitted for up to 398MW,
to be built in stages.
Orbital Marine Power is developing what will be ▷
the first floating tidal stream turbine to go into
commercial production. This improved 2MW device
will be deployed and grid connected in early 2020.
16 Powering Homes Today, Powering Nations Tomorrow….AND BEYOND EUROPE
◁ DP Energy have a 9MW site in the Bay of Fundy,
Canada, which boasts some of the world’s
strongest tides. The site is grid connected and
the project is supported by a grant and revenue
support at €350/MWh.xvii
Minesto is developing a pre-consented site off ▷
Keelung City in north Taiwan. This will be a base
for further installations in Taiwan and across Asia.
Minesto has been active in Taiwan for several years,
and established a local subsidiary in 2017.
◁ Several developers are in talks to supply turbines
for a ‘tidal bridge’ of up to 25MW. The bridge will
link 2 islands within Indonesia, and turbines installed
underneath will harness the tidal forces.
Beyond power produced and projects deployed, tidal This is a crucial step in the path to full commercial roll-
stream has seen a convergence in the technology. The out. As a consistent design for tidal turbines emerges,
more successful tidal turbines have all been horizon- common performance standards will be agreed, ‘off
tal-axis, with two or three blades, similar to underwater the shelf’ components can be used, and competitive
wind turbines. supply chains emerge. This will increase the rate of
cost reduction for tidal energy.
Powering Homes Today, Powering Nations Tomorrow 17An already visible economic impact, even at this early stage
Beyond consistent power production, the first farms Such activity has contributed over €130m in Gross
have also demonstrated the industry’s important con- Value Added to the economy of north-west Scotland
tribution to local economies. by 2017, supporting almost 2000 full time equivalent
worker years.xx
• 25% of project expenditure during construction of
Nova Innovation’s tidal array went directly to local Nigg Port is a clear example of a wider trend – the
companies in the Shetland Islands. Over 80% of repurposing of infrastructure and human skills from
its supply chain content expenditure was in Scot- legacy industries such as oil and gas, ship building and
land. 60% of Nova’s supply chain expenditure went fisheries, to service ocean energy needs.
to companies in the Highlands and Islands region
of Scotland.xix The economic impact of tidal energy has not just been
limited to coastal regions. Businesses across Europe
• The Port of Nigg in Scotland has become the base are benefiting from the emergence of a new tidal
for the assembly and maintenance of the MeyGen stream industry:
tidal turbines.
Sweden
UK
Turkey
Source: Ocean Energy Supply Chain in Europe. Joint Research Centre Source: Andritz Hydro
Fig. 3 -The European Commission’s Joint Research Centre Fig. 4 -Turbine manufacturer Andritz Hydro
has mapped wave and tidal’s supply chain along the manufactures in Austria and south Germany,
continent’s coastal regions and has identified at least 14 supplier countries.
18 Powering Homes Today, Powering Nations Tomorrow2.
WAVE ENERGY
A step-by-step approach to prototype development
Wave technologies progress at more sustainable pace than before. This step-by-step
approach has produced several promising prototypes, which cater for different wave
climates and market opportunities.
Several concepts catering for different wave environments
and markets
A variety of promising wave devices have been de- suit a variety of geographical conditions and business
signed, tested and deployed over the past 2 years, to models.
◁ Following successful half-scale testing during 2018,
CorPower Ocean is now focusing on the deployment
of a full-scale version. Reduced costs and complexity
are at the core of the device’s design. While average
energy generation is maximised, the device ‘detunes’
during very large waves, to increase survivability
and reduce capital costs.
Wello’s first ‘Penguin’ device has survived 2 years ▷
in the North Sea, weathering waves of almost 20
metres. A second Penguin has been extensively re-
designed, to exploit learnings from the deployment
of the first device. It will be deployed in spring 2019.
◁ Building on testing of successively larger versions,
AW-Energy will deploy its first commercial
WaveRoller in Portugal in 2019. The device sits on
the seabed and harnesses near-shore waves. The
seabed limits the size of waves which ensures lower
extremes and more consistent power production.
On-board storage allows smooth power to the grid,
and can provide frequency services to electricity
system operators.
Powering Homes Today, Powering Nations Tomorrow 19◁ A grid-connected wave energy convertor has been
deployed off the north coast of Spain for the last
2 consecutive winters. The Marok-A-5 device has
been recently upgraded with an advanced turbine
– which has been first tested in the Mutriku Plant
(see below). The deployment is being supported by
the Basque Energy Agency, and is part of the EU
‘OPERA Project’
The Mutriku Plant has generated over 1.8 GWh ▷
since its commissioning in 2011xxi. The facility was
incorporated into the design of a new breakwater
to protect the harbour, thereby reducing investment
and future operating costs. In addition to producing
electricity for the grid, the plant offers testing
opportunities for turbines and control strategies.
◁ Belgian developer Laminaria will deploy a full scale
prototype in the Orkney Islands in 2019. This follows
an extensive programme of testing, from initial
tank tests to sea trials with a ¼ scale device off the
Belgian coast in 2014-2015.
A SOLUTION FOR SPECIFIC NEEDS AND NICHE MAR- power and data communication to autonomous sensors
KETS on the sea bed. It is now possible to have online access
to under water sensors all year round, without having to
Developers of smaller scale wave-devices have also tak- replace batteries.
en important strides forward. Smaller devices target off-
shore operations, such as aquaculture or oil & gas plat- Fred Olsen is another example, have just completed a
forms, where power is harder to source. deployment of their device, which is designed to remote-
ly power offshore equipment.
The technology within these devices can subsequently be
scaled-up to deliver utility-scale volumes of power. Fo- Albatern has developed a wave energy array product
cusing on niche markets allows the technology to be es- to power fish farms in the rapidly-growing aquaculture
tablished and improved at a lower level of risk and cost. market and other off-grid markets where diesel genera-
tion is currently used.
Resen Waves is a good example, having completed the
commercial sale of a first device. It provides electric
20 Powering Homes Today, Powering Nations TomorrowFirst wave supply chains beginning to emerge
Although not as advanced as tidal stream, the first signs range of organisations, who are increasingly or exclu-
of wave energy industrial clusters are also emerging. sively focusing on wave energy as a source of profits
and future business. For example, Orkney-based Green
For now this economic eco-system is largely build upon Marine operates a fleet of vessels focused on installing,
companies which are already active in related domains, servicing and decommissioning ocean energy projects.
such as maritime operations, electricity systems, engi- The Basque Country’s Energy Agency has mapped the
neering and early-stage research. But there are also a region’s wave energy supply - see below.
Source: The Basque Energy Agency
Fig. 5 - The Energy Agency of the Basque Country has mapped the region’s wave energy supply chain,
and categorised each player according to the critical component, system or service it provides.
Learning from the past: growing slower to progress faster
Wave technology development processes have under- 3. Small-scale testing in larger tanks
gone a revolution in recent years. Following Aquama- 4. Small-scale testing in sheltered sea conditions
rine and Pelamis bankruptcies, the focus has moved
5. Medium-scale testing in sheltered sea conditions
away from quickly building large-scale prototypes.
6. Full-scale testing in exposed sea conditions
Instead, a more step-by-step approach is taken to de-
This gradual approach allows developers to continually
veloping the latest generation of wave energy conver-
validate and improve their modelling and technology,
tors. Typically, this includes up to six phases, where the
including key components. Once validated, learnings
successful completion of one phase conditions funding
from each step are incorporated into the next, thereby
for the next:
reducing risk and costs.
1. Design, modelling and control
2. Very small-scale separate testing of device, com-
ponents and sub-systems in small tanks
Powering Homes Today, Powering Nations Tomorrow 21STRUCTURED PRODUCT VERIFICATION
2012-2013 2014 2015 2016 2017 2018 2019 2020 2021 2022 2023 2024 2025
Q1 Q2 Q3 Q4 Q1 Q2 Q3 Q4 Q1 Q2 Q3 Q4 Q1 Q2 Q3 Q4 Q1 Q2 Q3 Q4 Q1 Q2 Q3 Q4 Q1 Q2 Q3 Q4 Q1 Q2 Q3 Q4 Q1 Q2 Q3 Q4 Q1 Q2 Q3 Q4 Q1 Q2 Q3 Q4 Q1 Q2 Q3 Q4 Q1 Q2 Q3 Q4
PRE-COMMERCIAL
STAGE 5
STAGE 4 10-20MW Farms
Pilot array
STAGE 3 Full Scale WEC - Dry & Ocean demo
STAGE 2 1:2 WEC - Dry & Ocean demo
STAGE 1 Critical System tests - tank & dry Working capital
€8.8m (SEA, KIC, €12-20m (Public + Private) €25-30m (Public + Private)
Concept Revenues
€1.7m WES, H2020) 23-40 people 40-60 people
Validation >100 people
5-11 people 12-23 people TRL 7-8 TRL 8-9
€500k
TRL 4-5 TRL 5-7
TRL 2-3
WaveBoost - Gen 4 WEC 1:2 - H2020 - €4M
Product verification in 5 stages acording to IEA-OES / equimar best practice
Source: Corpower
Fig. 6 - CorPower Ocean’s step-by-step approach to Research, development and innovation underpinned the
creation of their C3 wave device.
This means that less full-scale wave prototype demon- more successful, the sector as a whole progresses
stration projects hit the water, yet that those who do more rapidly.
are more likely to be successful. And as projects are
22 Powering Homes Today, Powering Nations Tomorrow3.
OTEC & SWAC
Developing onshore to exploit synergies
and lower costs
OTEC generates power by exploiting the difference in temperatures between warm seawater
at the surface and cooler water at deeper levels. The technology can generate 24/7 non-
stop power, and is a key technology for EU islands and export markets around the equator
and in tropical latitudes.
Developers and utilities are also using the core technology to deliver an integrated range of
different solutions, beyond just power production. Existing applications such as Sea Water
Air Conditioning (SWAC) and desalination help the technology build a business case and
break into commercial markets.
Bringing OTEC back onshore to deliver cost savings at scale
More challenging offshore technically and financially, deliver cheaper power, as output can be scaled up with-
ocean thermal energy conversion (OTEC) has shifted out a corresponding increase in costs. Similarly, techni-
back onshore in the past 2 years. Attempts at floating cal challenges such as the pipe pumping cold water to
offshore installations have been delayed for now, until the surface are much simplified onshore.
onshore installations are running.
Efforts have been focused on scaling up to a 10MW
The move will allow developers to make use of the plant, as a first-step towards delivering a commercial
significant economies of scale of larger OTEC installa- offshore product. As an example, Naval Energies has
tions, while lowering technical risks. Larger OTEC plants an onshore OTEC prototype in La Réunion.
Powering Homes Today, Powering Nations Tomorrow 23Harnessing synergies to establish the business case
Pumping deep seawater is at the core of OTEC – and it Desalination is a rapidly growing market – the UN esti-
can be used for more than just power production. Dutch mates that half of the world’s population will be living
company Bluerise is developing projects across the in water-stressed areas by 2030.xxii
Caribbean and the Indian Ocean that combine power
production with district cooling. As well as decarbonis-
ing both power and heating/cooling systems, combining
both revenue streams helps to make projects bankable
and will pave the way towards larger scale offshore
OTEC power production.
OTEC is also well suited to the production of fresh drink-
able water from the sea. Deep seawater’s purity is ideal
for drinking purposes, and is already being brought on-
shore by OTEC activity. The combination of power gen-
eration and desalination process allows formore com-
petitive costs than one process in isolation.
SWAC – an already commercial technology
Monaco has been using seawater heat pumps as far
back as 1963. Today 75 sea water heat pumps produce
20% of the Principality’s energy consumption.xxiv As in
Marseille, the seawater provides heating in winter and
cooling in summer.
Applications are not just limited to district heating/
cooling, nor to warmer regions. Google has been cool-
ing one of its data centres with seawater in the Bay of
Sea Water Air Conditioning (SWAC) projects which pro- Finland since 2011.xxv
vide heating and cooling for buildings and districts are
already being delivered commercially – including in Eu- In summer 2018, a Microsoft data centre was installed
rope. Running since 2016, Engie’s ‘Thassalia’ project on the seabed off the Orkney Islands. Sea tempera-
will service 500,000m² of building space in Marseille tures will reduce the cooling energy needs by up to
by 2020.xxiii Seawater is pumped to heat exchangers 95%. The centre will be immersed for 1 year, but has
and pumps. The heated or cooled water is then piped to been designed to operate for 5 years without direct
individual buildings in the city’s revitalised ‘Euromédi- intervention.xxvi
terranée’ port area.
24 Powering Homes Today, Powering Nations Tomorrow4.
SALINITY GRADIENT
Research at scale
Seawater typically has 200 times more salt than fresh river water. When the two mix, the
resulting chemical pressure can generate non-stop renewable power. Research for this high-
potential technology is at an early stage, but successes have already been achieved.
Small scale demonstrations point to important
market potential
It has been estimated that where large rivers enter the This boosts the business case for the technology. It is
world’s oceans, there is a realistic annual potential of estimated that the river Rhine alone can be used to
5,177 TWh of salinity gradient power.xxiv That’s more generate 1,750 MW of power and produce 1.6bn Nm3
than 22 times Spain’s annual power consumption today. of hydrogen each year.xxviii
Salinity gradient demonstration activity is focused in
the Netherlands. A new technique, known as ‘Reversed
Electro Dialysis’ has been successful implemented at a
pilot in Afsluitdijk. This has paved the way for a scaled-
up 1MW pilot plant.
Fujifilm are involved in the establishment of the pilot
plant. It makes use of two types of membranes, which
allows the pass through of charged ions. Electricity is
generated by arranging these two types of membranes
in a ‘stack’.
In 2018 a process was identified to produce hydrogen,
using leaked voltage from the salinity gradient process.
Membrane research as a path to cost reduction
A 2 MW plant would require at least 2,000,000m2 of capital costs of a salinity gradient project. Membranes
membrane, which will need regular maintenance and suitable for salinity gradient power are currently 2-3
occasional replacement. The membranes are the most times more expensive than standard commercial-
critical cost component, accounting for 50%-80% of ly-available membranes.xxix
Powering Homes Today, Powering Nations Tomorrow 255.
TIDAL RANGE
Proven technology, commercial with revenue support
Tidal range has been producing predictable power in Europe since the 1960s. It uses ‘low-
head’ hydro-electric turbines, the likes of those used in hydro-electric dams. It is thus
proven technology, and can be integrated into pre-existing or custom-built infrastructure,
potentially providing other services.
There is an estimated 1000 GW of technically harvestable tidal range energy resource in
the world.xxx Europe is one of the regions where this potential is strongest. In the UK tidal
range has the potential to supply up to 12% of the country’s power needs.xxxi 2 regions in the
Normandy and Picardy regions of France have up to 15GW of available capacity.xxxii
Individual tidal range installations can deliver significant volumes of power. The proposed
Cardiff Tidal Lagoon project could power 1.5m homes annually.xxxiii
Providing both electric power and infrastructure services
The sites provide wider public services in addition to each day.xxxiv The South Korean installation improves
power generation. The La Rance facility is also a bridge, the water quality within a pre-existing reservoir.
allowing up to 60,000 vehicles to skip a 30km journey
Proven technology, commercially available
with public support
The first major tidal range plant (240MW), at the La Current projects are close to other renewable energy
Rance estuary in France, has been generating power technology prices. Yet their custom-built infrastructure
since 1966. A 254MW plant was opened at Sihwa in and added environmental measures mean the first few
South Korea in 2011. projects will require public financial support. Revenue
support, such as a Feed-In-Tariff, Contract for Differ-
Energy production costs at these two sites are com- ence, or a Certificate/Quota systems, for a small num-
petitive, varying between €0.02-0.04/kWh. These low ber of projects would be enough to bring the technol-
costs are due to the depreciated capital expenditure at ogy to commercial roll-out. For example, the Swansea
La Rance, and the re-purposing of an existing seawall Bay Tidal Lagoon project is seeking support at similar /
at Sihwa.xxxv kWh levels than the Hinkley Point nuclear power plant.
26 Powering Homes Today, Powering Nations TomorrowPART III
Key innovations to progress
Ocean Energy through 5 phases
of development
Powering Homes Today, Powering Nations Tomorrow 27Different ocean energy technologies and devices are useful Technology Readiness Level (TRL) scale and ac-
at different phases of development. The right support count for the fact that project can benefit from similar
framework needs to be in place at each phase, for finance structure throughout several TRLs.
ocean energy to improve performance, reduce costs,
and reach commercialisation. This document will follow the same methodology and
use the Roadmap’s phases as per figure 7 below.
The Ocean Energy Forum Roadmap clearly defined
those phases and their differentiations to simplify the
R&D Prototype Demonstration Pre-Commercial Industrial
Roll-Out
• Small-scale • Representative • Series or small • Medium-scale • Full-scale
device validated single scale array of full-scale array of full- commercial ocean
in lab devices with full- devices scale devices energy power
scale components experiencing plant or farms
• Component • Deployed in
interactions
testing and • Deployed in relevant sea • Deployed in
validation relevant sea conditions • Grid connected operational real
conditions to a hub or sea conditions
• Small/medium- • Ability to evidence
substation (array)
scale Pilots • Ability to evidence power generation • Mass production
energy generation to Grid • Deployed of off-the-shelf
in relevant/ components and
• For OTEC and
operational sea devices
salinity gradient:
conditions
full functionality
downscaled power • For OTEC and
plant salinity gradient:
scalable
TRL 1-4 TRL 3-6 TRL 5-7 TRL 6-8 TRL 7-9
WAVE
TIDAL STREAM
OTEC/SWAC
SALINITY GRADIENT
TIDAL RANGE
Fig. 7-Where ocean energy technologies are in the 5 stages of development
28 Powering Homes Today, Powering Nations TomorrowThe next double-page identifies the key innovations from prototype, demonstration, pre-commercial and
that the ocean energy sector must take to reach indus- even industrial roll-out are all fed back into new R&D
trial roll-out, and indicates at which stage of develop- activities. The main target for this continuous R&D are
ment these actions are likely to take place. Innovation cost reductions and performance improvements. This is
actions are taken from the Strategic Research Agenda a virtuous cycle of innovation.
for Ocean Energy.
Part III and IV of this document first consider the chal-
Allocating those innovations to a specific stage is lenges linked to financing the respective phases and
mostly indicative – individual innovation actions may propose an Integrated Strategy – 4 Actions required to
take place at a different stage than the one presented, bring the sector to commercial readiness.
depending on the project in question. However the wid-
er trend is valid – as technology progresses innovation
actions are more likely to be:
• At a larger scale
• More costly and complex
• Increasingly focused on supply chain and opera-
tion/maintenance actions
The next page also shows how basic R&D requirements
are informed by later-stage developments. Learnings
Powering Homes Today, Powering Nations Tomorrow 29R&D Prototype
Technology • Develop device design • Validate design & recalibrate
& numerical modelling numerical models
methodologies • Prove concept at smaller-scale / in
• Develop and iteratively redevelop test conditions
of higher performance/lower cost • Undertaken accelerated lifespan
devices, components & sub- testing of materials and
system: components
- Power take-off systems – e.g. • Validate interactions of device,
direct drive turbines, bi-radial components, sub-systems,
wave turbines anchoring, moorings and
- Moorings, foundations, anchors foundations.
& cable connections • Improve device reliability/
- Control systems that monitor survivability
conditions and respond
dynamically to mitigate
adverse impacts
- Novel materials for blades,
moorings, power take offs &
hull
- Protections against corrosion
and biofouling
• Improve device reliability/
survivability
• Develop successively larger
devices to improve power to cost
ratios
• Generate first data on
Environmental environmental impacts to inform
& Social consenting & licencing regimes
• Use first results to prove concept
Economic and attract initial investors
viabilityDemonstration Pre-Commercial Industrial Roll-Out
• Implement lessons from prototype • Implement lessons from • Address any serial technical
stage demonstration stage issues
• Prove concept at full-scale • Further improve device • Use additional learnings to
survivability, reliability, availability incrementally improve design &
• Achieve & demonstrate device
and power yield performance of OE devices
survivability, reliability, availability
& power yield • Improve array layouts and device • Optimise operations &
design based on array interactions maintenance procedures for
• Deploy foundations, anchoring &
arrays
mooring systems for extended • Further reduce uncertainty,
periods of time in real ocean risk and cost of foundations, • Establish fleet of vessels tailored
conditions anchoring systems to ocean energy needs, that can
maintain position in rough seas
• Validate performance of device, • Establish manufacturing &
components and sub-systems for assembly lines for standardized
extended periods of time in real devices & components
ocean conditions
• Establish and improve operations
• Validate cable connection and grid & maintenance procedures for
compatibility arrays – including predictive and
preventive O&M processes
• Establish operations &
maintenance procedures for single • Deploy quick release and wet-
devices mate connectors, and hubs for
subsea power connections
• Improve device reliability/
survivability
• Generate data on environmental • Increase standardisation of licensing • Address remaining unresolved
impacts to inform consenting & and environmental consenting of OE health, safety & environmental
licencing regimes projects issues
• Provide examples to inform • Increasingly limit environmental • Establish standardised procedures
national Marine Spatial Plans restrictions to address known risks for zoning and environmental
consenting of OE projects
• Develop of standard procedures • Map social & economic impact on
for monitoring of environmental local/regional/national communities • Set up specialised training
impact of projects programmes to meet industry
needs
• Produce data on performance, • Source from supply chain bespoke • Further reduce risk and cost of
reliability, survivability & costs vessels capable of maintaining capital by fully standardising
to showcase risk reductions to position in rough sea conditions devices, components, sub-systems
investors & procedures for manufacture,
• Prove performance & limited risk
assembly, installation
• Begin standardisation of device, to allow
components and sub-systems • Establish dedicated assembly
• Equity investment at lower
lines/manufacture facilities
• Competitive outsourcing of some Return on Investment
allow major cost reduction via
components & sub-systems • Availability of commercial debt economies of scale
for projects
• Harness new supply chain to
• Dramatically reduced insurance competitively source ‘off the shelf’
premiums components & sub-systems
Powering Homes Today, Powering Nations Tomorrow 31PART IV
Challenges in financing innovation,
from early stage
to commercialisation
32 Powering Homes Today, Powering Nations TomorrowOcean energy technologies are at different phases of tion. The Ocean Energy Forum Roadmap defined five
development. The right financial framework needs to clear phases as presented in PART III and those are the
be in place at each phase, for ocean energy to improve definitions used in this document:
performance, reduce costs, and reach commercialisa-
R&D and prototypes:
Financing projects that do not make a return
Phases: R&D Prototype Demonstration Pre-Commercial Industrial Roll-Out
As per the Ocean Energy Forum definition, these stages Private investors are typically very reluctant to support
culminate in putting a single full-scale prototype in real R&D and prototype activities. They know that there is
sea conditions. Both wave energy and salinity gradi- a high risk that any individual technology will not ever
ent devices are currently going through the ‘Research make a return. They also know that any returns will only
& Development’ and ‘Prototype’ stages. Many tidal be made in the long-term. Where private investment is
stream devices are already at Demonstration stage, available, it is often the developer’s own capital. Grants
though some prototypes are still completing their test of up to 100% funding are required to close the gap.
runs.
CHALLENGE: FUNDING INNOVATION WHILE MAKING
The technological R&D priorities for each ocean energy ‘BEST USE OF PUBLIC MONEY’
technology are already well understood and have been
mapped out at a European level in ocean energy Stra- Grants have clear advantages for funding authorities
tegic Research Agenda reports2. - they are flexible, easy to manage, and can be award-
ed competitively. They also reduce the private financ-
OBJECTIVE: TESTING TO GENERATE LEARNINGS ing need for innovations and don’t put future financial
RATHER THAN REVENUE pressure on companies the way a loan would.
Each step along the way to a full-scale prototype in When funding technology projects, decision-makers’
real conditions serves a learning purpose. That last primary goal is to stimulate innovation and drive for-
step validates the technology. Many of those projects ward technical progress. Decision-makers also have to
are not grid connected and merely monitor electricity balance this objective with other important consider-
generation – no revenues are generated. ations:
Learnings at these stages of development are ex- • Funding cannot create an unfair advantage, by al-
tremely valuable. R&D and prototype work, if under- locating large portions of a total budget to a single
taken well, sets a technology up for success. The risks company. This can push other potentially more suc-
at subsequent stages of development are reduced, and cessful ideas out of the innovation ring.
a structured and documented earlier approach can at- • Funding shouldn’t focus upon one sole device or
tract investors as the technology reaches commercial company. Putting ‘all eggs in one basket’ risks los-
readiness. ing all if the individual device fails.
• Duplication is best avoided – e.g. funding the same
Projects at these phases are only meant to stay in the
research twice in different countries.
water for a given length of time. Once they have sup-
plied the required learnings, they are decommissioned.
There are structured funding mechanisms which bal-
Access to consented ocean sites often require projects
ance these needs while also driving innovation. See
to locate in test centres. Services, operation & main-
the below case study on Wave Energy Scotland. This
tenance activities at these sites also have a cost that
stage gate approach is well suited to wave energy, and
funding will cover for a limited time without a steady
makes best use of public money.
revenue stream.
2
For example, TP Ocean’s Strategic Research Agenda for Ocean Energy – sege: https://www.oceanenergy-europe.eu/wp-content/
uploads/2017/03/TPOcean-Strategic_Research_Agenda_Nov2016.pdf
Powering Homes Today, Powering Nations Tomorrow 33AVAILABLE TODAY: CLASSICAL GRANTS AND A such as FORESEA and its successor OceanDEMO will
NATIONAL STAGE-GATE PROCESS help cover the costs of deploying in test centres.
Grants are available to early-stage research, devel- European entities such as InnoEnergy and nation-
opment and first prototype deployment from a wide al entities such as BPI France have taken equity in
range of EU and national sources. ocean energy companies to complement the funding
needs of some higher TRL projects.
EU sources of grant funding include Horizon 2020,
EU structural funds, the SME Instrument, the LIFE Horizon 2020 has been the single most important
Programme and the Ocean Energy ERA-NET Co- programme for the ocean energy industry in the past
fund. National and regional funding agencies also 5 years, awarding over €180M in projects grants.
offer grants, such as Ireland’s Ocean Energy Proto- Funding has been well targeted to meet ocean ener-
type Development Fund and the Basque Country’s gy’s most important technological challenges, as pre-
Aid Programme for Investment in the Demonstra- sented by ETIP Ocean and the sector3.
tion and Validation of Emerging Marine Renewable
Energy Technologies. MaRINET2 helps developers to The Wave Energy Scotland stage-gate process is also
access research infrastructure, including various labs, a first of its kind – see box for more information.
tanks and open sea test sites. Interreg programmes
USING ‘STAGE-GATE’ PROCESSES TO OPTIMISE
PUBLIC SPENDING FOR INNOVATION
A stage-gate process for wave energy, Wave Energy Scotland (WES), has been set up in
2016 by the Scottish Government. It targets early stage R&D and prototype deployment
and provides 100% funding via a pre-commercial procurement process.
The ‘stage-gate’ concept is based on:
Competitive bidding: an initial competitive call selecting a wide number of technologies
at early stage followed by funding rounds targeting increasing TRLs, for a decreasing
number of awardees
‘Gated’ funding: funding for the next round can only be awarded if the objectives of the
previous rounds or ‘stages’ have been successfully completed – passing the ‘Gate’
The stage-gate process remains competitive, flexible, ensure best use of a finite public
budget, and rewards technological success. It avoids picking winners, duplication of ef-
forts and concentration of funding.
At time of writing WES has funded 86 contracts, invested £38.6m and been involved with
177 separate organisations across 13 different countries xxxvi.
3
E.g. the priorities in the Strategic Research Agenda for Ocean Energy
34 Powering Homes Today, Powering Nations TomorrowPower Take-Off PTO 1 PTO 2 PTO 3 PTO 4
Novel Wave Device NWEC 1 NWEC 2 NWEC 3
Structural Materials and Manufacturing Mat 1 Mat 2 Mat 3
Advance Control Systems C1 CS 2 CS 3
Moorings/Foundations/Electrical Infrastructure MF 1 MF 2
Power Take-Off Materials Call
Novel Wave Energy Converter Call Control Systems Call Moorings/Foundations/Elect Inf. Call
2015 2016 2017 2018 2019 2020 2021
Today
Fig. 8 - WES proposes 5 programmes focused on different elements of wave devices.
CALL FOR ACTION: DIRECT GRANTS TO WAVE VIA A means that a structured stage-gate approach provides
EUROPEAN STAGE-GATE PROGRAMME a valuable direction – a ‘funnel’ – for research.
Because of the absence of revenue, early-stage re- Given the WES experience, an EU-wide stage gate pro-
search and prototype development will always need gramme for pre-commercial procurement would ac-
significant public support - sometimes up to 100% celerate technology demonstration, while minimising
funding. Technology developers invest their own capi- EU-wide spending and avoiding duplication of efforts.
tal during this phase. Yet the time horizon to revenue The Ocean Energy Forum Roadmap was already rec-
generation is generally too far away to attract further ommending such a programme and the European Com-
private investors. mission’s DG Research, Innovation and Development
has produced a stage-gated call for 2019-2020.
A combination of straight grants and a structured ap-
proach, such as a stage-gate is particularly relevant. See Integrated Strategy Action 1 in Part IV for more in-
This approach is well suited to wave energy: the wide formation on the initiative to setup such a programme.
range of potential ways to harness the energy of waves
Demonstration and Pre-Commercial farms:
Removing technology risk, lowering costs of
capital and providing market visibility
Phases: R&D Prototype Demonstration Pre-Commercial Industrial Roll-Out
Tidal stream has reached the stage of demonstra- tainties, cost of finance and total investment needs
tion and pre-commercial arrays. In the coming years, of projects. Unlike in previous phases, ocean energy
wave energy devices will also advance from proto- demonstration and pre-commercial projects do have
type to demonstration stage. A number of larger OTEC to generate revenues. Grant funding for these projects
demonstration projects are being planned, though never covers all project costs. Financial instruments
some are still at prototype stage. and private investment must fill the gap. This will only
happen if expected project revenues are sufficient to
Dubbed “the Valley of Death”, these phases are often repay this capital and its cost.
the most difficult to finance due to technology uncer-
Powering Homes Today, Powering Nations Tomorrow 35You can also read